Segmentation Quick Reference
| Dimension | Sub-Segments | Dominant Segment | Fastest Growing Segment |
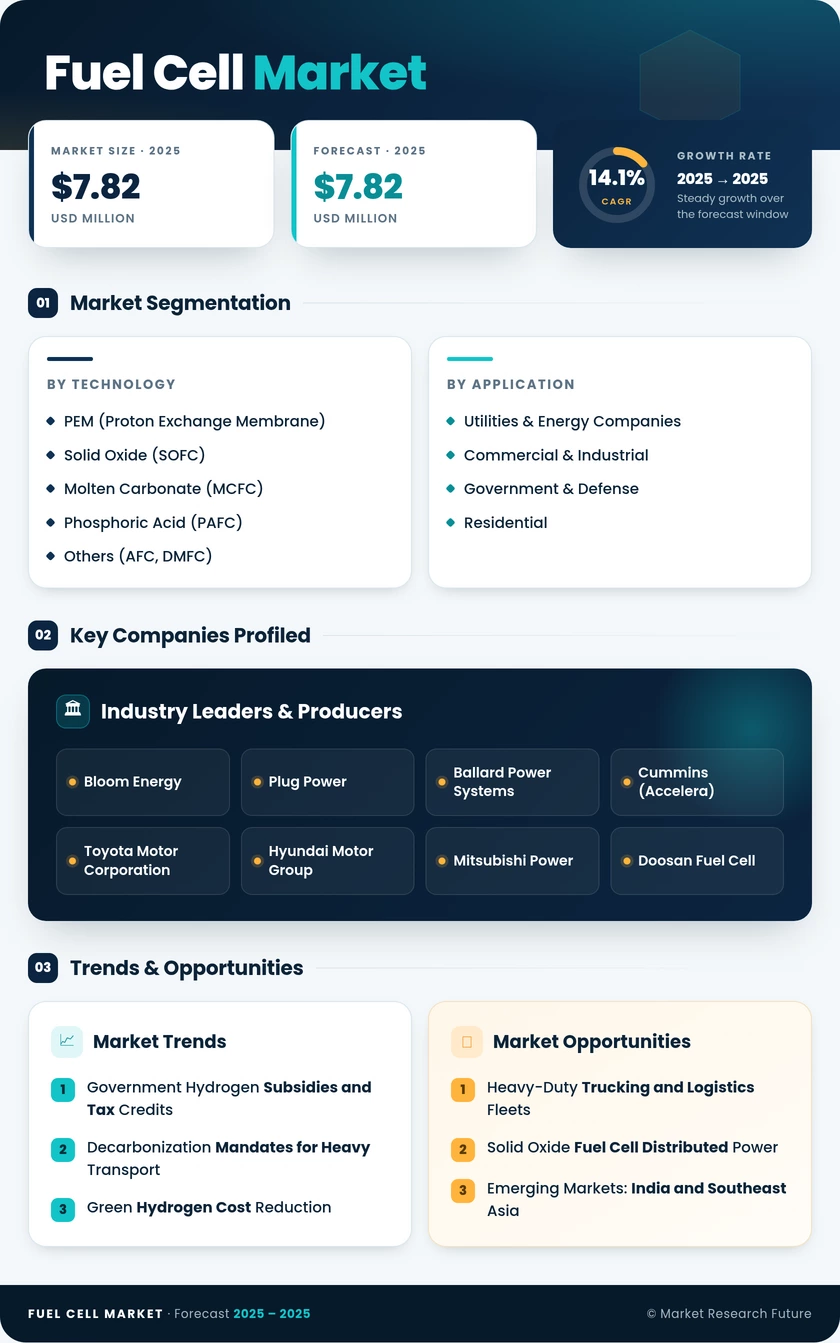
| By Technology | PEM, SOFC, MCFC, PAFC, Others (AFC, DMFC) | PEM (Proton Exchange Membrane) | Solid Oxide (SOFC) |
| By Application | Stationary Power Generation, Transportation, Portable Power | Stationary Power Generation | Transportation |
| By End User | Utilities & Energy Companies, Commercial & Industrial, Government & Defense, Residential | Utilities & Energy Companies | Commercial & Industrial |
| By Region | North America, Europe, Asia-Pacific, South America, Middle East & Africa | North America | Asia-Pacific |
Market Segmentation Overview
By Technology
| Sub-Segment | Key Trend |
| PEM (Proton Exchange Membrane) | Rising automotive FCEV adoption and data-center backup power deployments |
| Solid Oxide (SOFC) | High-efficiency CHP commercialization with fuel-flexible platforms |
| Molten Carbonate (MCFC) | Utility-scale distributed generation with integrated carbon capture |
| Phosphoric Acid (PAFC) | Established commercial building CHP with long-duration reliability |
| Others (AFC, DMFC) | Niche military, portable, and specialty applications |
PEM technology continues to dominate global fuel cell deployments due to its versatility across transport, backup power, and portable applications. SOFC is gaining momentum as manufacturing scale-up reduces system costs and industrial end users seek higher-efficiency alternatives to conventional generation.
By Application
| Sub-Segment | Key Trend |
| Stationary Power Generation | Grid resilience, CHP, and data-center prime/backup power |
| Transportation | Heavy-duty trucking, bus fleets, and passenger FCEV expansion |
| Portable Power | Military field operations, telecom backup, and construction site generators |
Stationary power generation remains the largest application category, benefiting from long-discharge-duration advantages over battery storage and tightening emissions mandates. Transportation is the fastest-growing application as commercial vehicle OEMs scale fuel cell electric truck and bus production.
By End User
| Sub-Segment | Key Trend |
| Utilities & Energy Companies | Distributed generation assets and hydrogen-to-power grid services |
| Commercial & Industrial | On-site CHP for manufacturing, warehouses, and campus facilities |
| Government & Defense | Resilient military power, government building microgrids |
| Residential | Micro-CHP adoption led by Japan's ENE-FARM program |
Utilities anchor end-user demand through large-scale distributed generation installations, while commercial and industrial adoption accelerates as combined heat and power economics improve under stricter carbon-pricing policies.