Segmentation Quick Reference
| Dimension | Sub-Segments | Dominant Segment | Fastest Growing Segment |
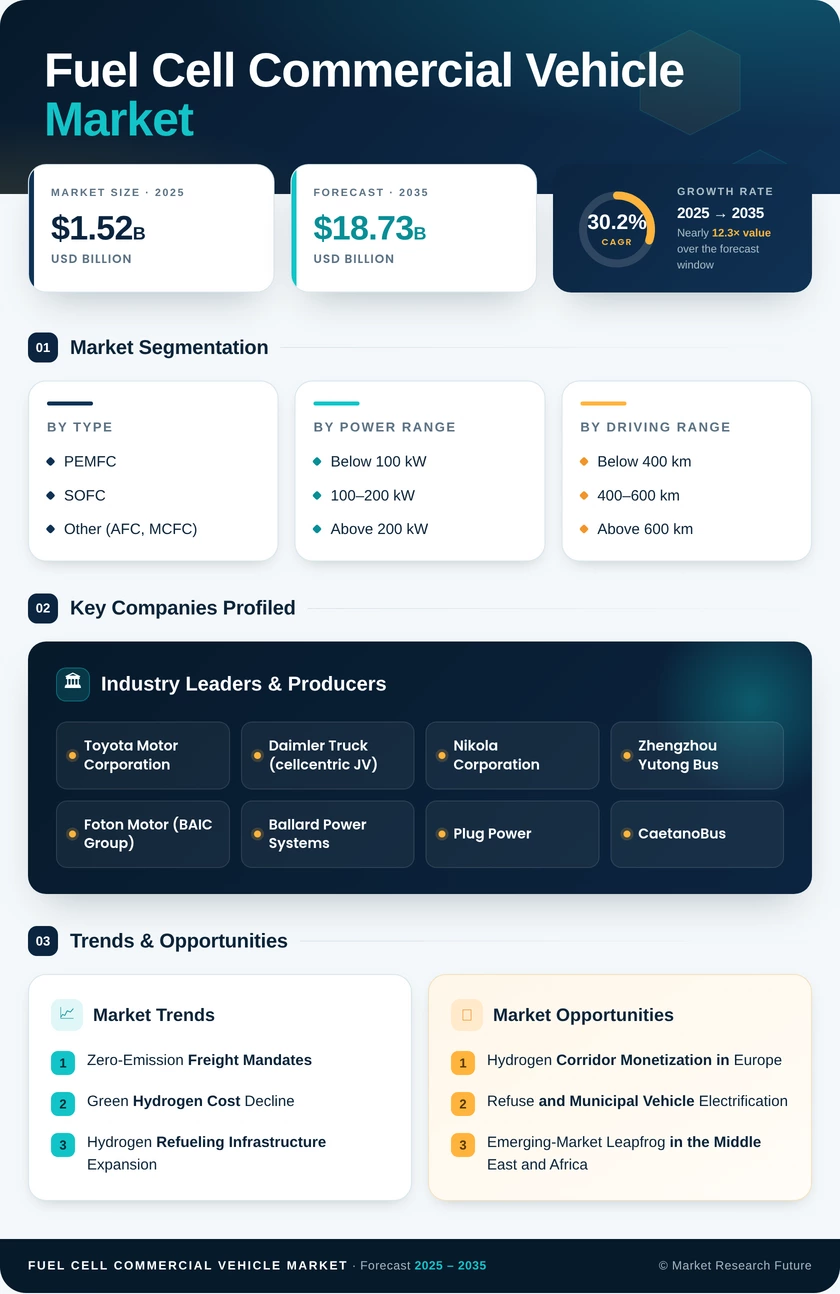
| Vehicle Type | Buses, Trucks, Light Commercial Vehicles (Vans), Special-Purpose Vehicles | Buses | Trucks |
| Fuel Cell Type | PEMFC, SOFC, Other (AFC, MCFC) | PEMFC | SOFC |
| Power Range | Below 100 kW, 100–200 kW, Above 200 kW | 100–200 kW | Above 200 kW |
| Driving Range | Below 400 km, 400–600 km, Above 600 km | 400–600 km | Above 600 km |
| End-User | Public Transit Fleets, Long-Haul Freight & Logistics, Municipal Services, Mining & Industrial | Public Transit Fleets | Long-Haul Freight & Logistics |
| Region | North America, Europe, Asia-Pacific, South America, Middle East & Africa | Asia-Pacific | Middle East & Africa |
Market Segmentation Overview
By Vehicle Type
| Sub-Segment | Key Trend |
| Buses | Fixed-route operations and municipal mandates drive steady procurement volumes globally |
| Trucks | Long-haul hydrogen corridors unlock rapid adoption of Class 8 fuel cell platforms |
| Light Commercial Vehicles (Vans) | Last-mile delivery operators pilot hydrogen vans for urban zero-emission zones |
| Special-Purpose Vehicles | Refuse and port-handling vehicles leverage hydrogen's fast-refueling advantage |
Buses remain the volume backbone of the segment, but the growth story belongs to trucks as hydrogen infrastructure scales along intercity freight routes. Vans and special-purpose vehicles occupy niche roles today, with expansion tied to localized zero-emission mandates.
By Fuel Cell Type
| Sub-Segment | Key Trend |
| PEMFC | Industry standard for commercial vehicles due to low operating temperature and fast cold-start |
| SOFC | Gaining traction in high-power, continuous-duty applications with superior electrical efficiency |
| Other (AFC, MCFC) | Limited to stationary range-extender and auxiliary power applications |
PEMFC dominates because of its proven durability in automotive duty cycles and an established global supply chain for membranes and catalysts. SOFC is carving out a high-value niche in heavy-duty platforms where sustained power output matters more than transient response.
By Power Range
| Sub-Segment | Key Trend |
| Below 100 kW | Suitable for light commercial vehicles and urban shuttle buses |
| 100–200 kW | Standard fitment for transit buses and medium-duty regional trucks |
| Above 200 kW | Required for Class 8 long-haul trucks targeting 500 km+ range operations |
The 100–200 kW band captures the majority of current deployments, but systems above 200 kW are growing fastest as OEMs develop stacks capable of powering fully loaded heavy trucks across long distances.
By Driving Range
| Sub-Segment | Key Trend |
| Below 400 km | Adequate for urban transit and port drayage where refueling is frequent |
| 400–600 km | Sweet spot for regional freight matching daily driving patterns |
| Above 600 km | Emerging requirement for intercity express logistics and cross-border corridors |
The 400–600 km bracket dominates because it aligns with typical single-shift driving distances for commercial operators. Demand for 600 km+ range is accelerating as fleet operators seek diesel-equivalent operational flexibility.
By End-User
| Sub-Segment | Key Trend |
| Public Transit Fleets | Government procurement mandates provide steady, subsidy-backed demand |
| Long-Haul Freight & Logistics | Shipper Scope 3 targets and corridor infrastructure drive the fastest growth |
| Municipal Services | Refuse, and utility fleets value hydrogen's fast refueling for multi-shift operations |
| Mining & Industrial | Underground zero-emission requirements and remote-site energy independence fuel adoption |
Public transit fleets anchor current volumes, but long-haul freight is rapidly closing the gap as hydrogen production costs decline and refueling networks densify along key trade corridors.