info@marketresearchfuture.com   📞 +1 (855) 661-4441(US)   📞 +44 1720 412 167(UK)   📞 +91 2269738890(APAC)
Certified Global Research Member
Isomar 1 Iso 1
Key Questions Answered
  • Global Market Outlook
  • In-depth analysis of global and regional trends
  • Analyze and identify the major players in the market, their market share, key developments, etc.
  • To understand the capability of the major players based on products offered, financials, and strategies.
  • Identify disrupting products, companies, and trends.
  • To identify opportunities in the market.
  • Analyze the key challenges in the market.
  • Analyze the regional penetration of players, products, and services in the market.
  • Comparison of major players financial performance.
  • Evaluate strategies adopted by major players.
  • Recommendations
Why Choose Market Research Future?
  • Vigorous research methodologies for specific market.
  • Knowledge partners across the globe
  • Large network of partner consultants.
  • Ever-increasing/ Escalating data base with quarterly monitoring of various markets
  • Trusted by fortune 500 companies/startups/ universities/organizations
  • Large database of 5000+ markets reports.
  • Effective and prompt pre- and post-sales support.

FRAM Market Research Report By Technology (Ferroelectric RAM, Embedded FRAM, Standalone FRAM, Multi-bit FRAM), By End Use Application (Consumer Electronics, Automotive, Industrial, Telecommunication), By Storage Capacity (128 Kbit, 256 Kbit, 1 Mbit, 4 Mbit), By Product Type (Non-volatile FRAM, Volatile FRAM) and By Regional (North America, Europe, South America, Asia Pacific, Middle East and Africa) - Forecast to 2035


ID: MRFR/SEM/7046-CR | 200 Pages | Author: Shubham Munde| July 2025

Global FRAM Market Overview

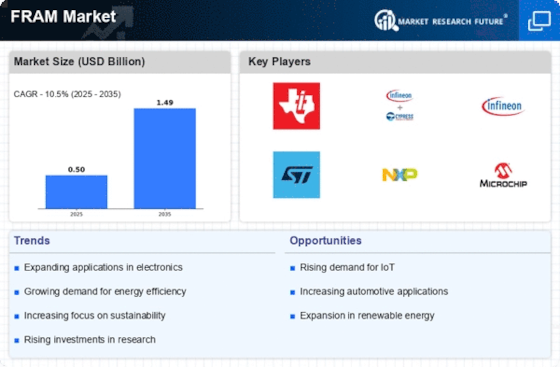
As per MRFR analysis, the FRAM Market Size was estimated at 0.45 (USD Billion) in 2023. The FRAM Market Industry is expected to grow from 0.5 (USD Billion) in 2024 to 1.5 (USD Billion) by 2035. The FRAM Market CAGR (growth rate) is expected to be around 10.5% during the forecast period (2025 - 2035).

Key FRAM Market Trends Highlighted

The FRAM Market has been characterized by significant trends that are primarily propelled by the growing demand for non-volatile memory solutions. As industries transition to more digitalized environments, there is an increase in the demand for integrated circuits that necessitate quick and dependable memory, which FRAM solutions can offer.

Furthermore, the drive for energy-efficient electronics is significant, as FRAM devices utilize less power, thereby addressing the sustainability objectives established by a variety of governments and organizations. Another critical driver is the proliferation of the Internet of Things (IoT), as connected devices frequently necessitate efficient and compact memory solutions. This presents a significant opportunity for FRAM manufacturers.

Collaborations with automotive companies can be pursued to investigate opportunities in the FRAM Market, as the industry progressively incorporates sophisticated technologies into autonomous and connected vehicles. Additionally, the demand for FRAM products is bolstered by the development of smart home devices and sensor technology.

In recent years, there has been a growing emphasis on the importance of reliable data storage in industrial and medical applications. This has made FRAM an appealing option due to its durability and efficiency in unpredictable environments. Furthermore, the emphasis on next-generation memory solutions is increasing, which allows FRAM to maintain a competitive advantage over traditional memory technologies.

In the evolving landscape, FRAM's role in facilitating quicker data processing and energy savings positions it favorably, as global initiatives press for more intelligent systems. In order to effectively capture new market segments and develop innovative applications, stakeholders in the FRAM Market must leverage these trends.

Global FRAM Market Overview

Source: Primary Research, Secondary Research, MRFR Database and Analyst Review

Increasing Demand for IoT Applications

The global Internet of Things (IoT) market is expected to experience exponential growth, with a projected valuation increasing from approximately 250 billion USD in 2020 to over 1 trillion USD by 2030, according to the International Telecommunication Union. This surge in demand for IoT applications directly drives the growth of the FRAM Market Industry, as FRAM (Ferroelectric Random Access Memory) is increasingly utilized for its low power consumption and fast write times.

Companies like Texas Instruments and Fujitsu are investing heavily in Research and Development to enhance FRAM technology, ensuring it meets the evolving demands of IoT devices. The push for smart cities and smart home products across the globe reinforces the need for reliable and efficient memory solutions. As these trends continue, the FRAM Market is expected to capitalize significantly on the innovations in IoT technology.

Growth in Automotive Electronics

The automotive sector is rapidly integrating advanced electronics into vehicles, leading to a significant increase in demand for high-performance memory solutions. It is reported that the global automotive electronics market will reach approximately 400 billion USD by 2025, according to the International Organization of Motor Vehicle Manufacturers. As manufacturers like Bosch and Continental adopt FRAM technology for sensor data storage and processing in electronic control units, this sector becomes a crucial driver for the FRAM Market Industry.

The increasing focus on vehicle automation, safety, and communication further necessitates the need for reliable memory solutions, which FRAM can provide.

Rising Adoption of Wearable Technology

The wearable technology segment is expanding at a remarkable rate, projected to grow from around 70 billion USD in 2020 to 150 billion USD by 2025, as indicated by data from the Consumer Technology Association. As consumer health and fitness consciousness rises globally, wearable devices such as smartwatches and fitness trackers are becoming prevalent. Companies like Apple and Fitbit rely on FRAM for data storage due to its power efficiency and durability, making it an ideal choice for compact devices.

The need for accurate data retention and performance under various operating conditions has established FRAM as a vital memory solution in the FRAM Market Industry.

FRAM Market Segment Insights

FRAM Market Technology Insights

The FRAM Market, a significant segment within the technology landscape, is poised for notable growth. In 2024, the overall market was valued at approximately 0.5 USD billion, reflecting the increasing importance of non-volatile memories in various applications, particularly in automotive and industrial systems.

Key to this market are its several technology types, most prominently Ferroelectric RAM, Embedded FRAM, Standalone FRAM, and Multi-bit FRAM, which cater to diverse industry needs. Ferroelectric RAM, valued at 0.15 USD billion in 2024 and projected to reach 0.45 USD billion by 2035, is gaining traction due to its low power consumption and high-speed operation, making it particularly crucial for applications where efficiency is paramount.

Embedded FRAM held a notable share with a valuation of 0.2 USD billion in 2024, expected to increase to 0.6 USD billion by 2035, emphasizing its role in system-on-chip designs, thereby enabling faster processing speeds and lower overall energy usage in compact devices. Standalone FRAM, though initially smaller with a valuation of 0.1 USD billion in 2024 and aiming for 0.3 USD billion in 2035, serves specific niche markets where separate memory modules are necessary, often found in specialized industrial applications.

Meanwhile, Multi-bit FRAM, beginning at 0.05 USD billion in 2024 and forecasted to grow to 0.15 USD billion in 2035, showcases significant potential as it allows for data storage efficiency, critical for devices where space and power efficiency are critical.

These segments collectively highlight the sustained demand for FRAM technologies, driven by the adoption of IoT and smart electronic devices across the global market, enhancing performance while catering to emerging technological needs.

The FRAM Market data indicates a clear shift towards these segments, driven by both major manufacturers and increasing investments in Research and Development across the technological landscape. Key trends include the push for energy-efficient memory solutions, which further reinforces the significance of these memory types in the global ecosystem.

Overall, the FRAM technology category is set to dominate as industries continue to seek low-power, high-speed memory solutions, thereby creating substantial opportunities for growth and innovation.

FRAM Market Technology Insights

Source: Primary Research, Secondary Research, MRFR Database and Analyst Review

FRAM Market End Use Application Insights

The FRAM Market is poised for substantial growth in the End Use Application segment, showed a market value of 0.5 billion USD in 2024, with projections suggesting it will reach 1.5 billion USD by 2035. This market is characterized by significant demand across various applications, including Consumer Electronics, Automotive, Industrial, and Telecommunication.

Consumer Electronics represents a critical area as it leverages FRAM for its fast write cycles and low power consumption, making technology like wearable devices more efficient. The Automotive sector also plays a vital role, utilizing FRAM for its reliability and durability in smart vehicles and electronic systems, which enhances safety features and automation.

In the Industrial realm, the robust nature of FRAM contributes to its dominance, facilitating various automation processes and control systems. Additionally, the Telecommunication industry benefits from its high-speed data retention capabilities, which are essential for maintaining seamless communication services.

Overall, these applications highlight the FRAM Market's potential, driven by evolving technology trends, increased consumer demand, and ongoing innovations across sectors. The market growth reflects an increase in the use of advanced memory solutions, showcasing the significance of End Use Applications in shaping the industry's future.

FRAM Market Storage Capacity Insights

The FRAM Market, particularly the Storage Capacity segment, is experiencing notable growth as it addresses the evolving needs for non-volatile memory solutions across various applications. In 2024, the overall market was valued at 0.5 billion USD, and by 2035, it is anticipated to reach 1.5 billion USD, showcasing significant market growth. Within the Storage Capacity sector, divisions such as 128 Kbit, 256 Kbit, 1 Mbit, and 4 Mbit cater to diverse requirements across industries, including consumer electronics, automotive, and industrial sectors.

The 1 Mbit and 4 Mbit variants dominate due to their extensive applications in data logging and high-performance computing. These capacities are particularly vital for applications requiring rapid read and write speeds, offering necessary solutions for industry challenges like reliability and performance.

Market trends indicate that the demand for higher storage capacities will continue to grow, driven by increasing data generation and the need for effective data management solutions. The FRAM Market data reflects a robust structure, with diverse applications reinforcing the significance of the Storage Capacity segment, thus representing a critical aspect of the FRAM Market industry dynamics.

FRAM Market Product Type Insights

The FRAM Market is a dynamic and growing sector, reached a valuation of 0.5 Billion USD in 2024 and showing significant expansion towards 1.5 Billion USD by 2035. The Product Type segmentation of the FRAM Market includes Non-volatile FRAM and Volatile FRAM, with Non-volatile FRAM positioned as a key player due to its ability to retain data without power, making it essential for applications in sectors such as automotive, consumer electronics, and industrial automation. The Volatile FRAM segment, while smaller, plays a crucial role in scenarios requiring faster access times and data refresh capability, appealing to high-performance computing markets.

As the demand for energy-efficient and reliable memory solutions rises, the FRAM Market is expected to witness substantial growth driven by advancements in technology and increasing adoption in smart devices. However, challenges such as production costs and competition from alternative memory technologies may impact market dynamics. Enhanced efficiency in manufacturing processes presents opportunities for stakeholders in the FRAM Market, paving the way for innovation and market growth.

FRAM Market Regional Insights

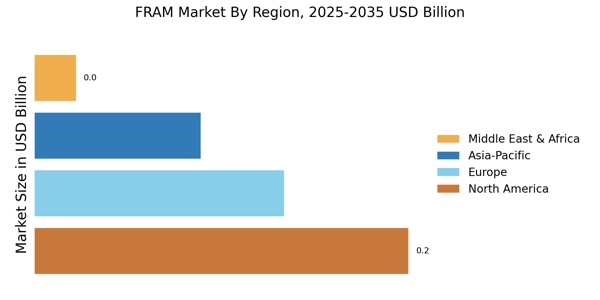
The FRAM Market is poised for steady growth with varying contributions from its regional segments. In 2024, North America led with a valuation of 0.15 USD Billion, reflecting its robust technological advancements and high demand across various applications.

Europe follows closely with an expected valuation of 0.13 USD Billion, driven by increasing investments in Research and Development and a growing focus on smart technologies. Asia Pacific is projected at 0.12 USD Billion, benefiting from rapid industrialization and increasing electronics demand.

South America and the Middle East and Africa contribute more modestly, with valuations of 0.05 USD Billion each in 2024, reflecting emerging market potential. As the FRAM Market grows, the majority holding in North America signifies its dominant position, attributed to a strong consumer base and high adoption rates of innovative solutions.

Additionally, the expansion of the automotive and consumer electronics sectors further enhances market growth opportunities across all regions. Understanding these dynamics is crucial for industry stakeholders to align their strategies with the evolving market landscape and capture emerging trends.

FRAM Market Regional Insights

Source: Primary Research, Secondary Research, MRFR Database and Analyst Review

FRAM Market Key Players and Competitive Insights

The FRAM Market is characterized by intense competition, driven by the growing demand for non-volatile memory solutions across various applications such as automotive, consumer electronics, and industrial sectors. Companies within this market are consistently innovating and improving their offerings to capture market share and meet the evolving needs of end-users.

As the market expands, organizations are leveraging advanced technologies to enhance performance, reduce power consumption, and increase data retention capabilities. The competitive landscape is marked by both established players and new entrants striving to differentiate their products through unique value propositions. Strategic alliances, mergers, and acquisitions have become key tactics employed by companies to bolster their market presence and broaden their product portfolios.

Nippon Electric Glass has established a solid foothold in the FRAM Market through its commitment to innovation and product quality. The company’s strength lies in its extensive expertise in glass materials and manufacturing processes, which has enabled it to produce high-performance FRAM products that meet stringent industry standards.

Nippon Electric Glass focuses on delivering reliable memory solutions suitable for a range of applications, from automotive to industrial uses. The company’s dedication to research and development has led to the development of next-generation memory technologies, enhancing its competitive edge. Additionally, Nippon Electric Glass benefits from strong partnerships with other technology firms, facilitating the integration of its products into diverse electronic systems.

Rohm Semiconductor is another prominent player in the FRAM Market, recognized for its innovative approach and diversified product offerings. The company specializes in a wide array of components, including memory solutions that cater to various sectors such as automotive, telecommunications, and consumer electronics. Rohm Semiconductor boasts significant capabilities in manufacturing high-capacity FRAM products, which are particularly geared towards applications requiring fast data processing and low power consumption.

The company's strengths lie in its robust R&D efforts, enabling it to introduce cutting-edge FRAM technologies that meet global market demands. Rohm Semiconductor has also engaged in strategic mergers and acquisitions to enhance its technological capabilities and market presence, allowing for a more comprehensive range of products and services to clients in the global arena.

Key Companies in the FRAM Market Include

  • Nippon Electric Glass
  • Rohm Semiconductor
  • Fujitsu Limited
  • Silicon Storage Technology
  • Cypress Semiconductor
  • Winbond Electronics
  • Infineon Technologies
  • NXP Semiconductors
  • Alliance Memory
  • Texas Instruments
  • STMicroelectronics
  • Toshiba Corporation
  • Microchip Technology
  • Idt Inc

FRAM Industry Developments

Recent developments in the FRAM Market indicate a growing emphasis on high-performance and energy-efficient memory solutions, driven by advancements in IoT applications, automotive technology, and consumer electronics. Rohm Semiconductor is acknowledged as a significant participant in the field of non-volatile memories, which includes FRAM.

The company is currently conducting research and development in low-power, automotive-grade FRAM solutions. Infineon Technologies and NXP Semiconductors both reported substantial revenue growth, which was partially fueled by the demand for industrial and automotive electronic solutions. Their financials demonstrate a positive trajectory; however, the specifics do not correspond to FRAM-specific valuations.

Fram Market Segmentation Insights

  • FRAM Market Technology Outlook

    • Ferroelectric RAM
    • Embedded FRAM
    • Standalone FRAM
    • Multi-bit FRAM
  • FRAM Market End Use Application Outlook

    • Consumer Electronics
    • Automotive
    • Industrial
    • Telecommunication
  • FRAM Market Storage Capacity Outlook

    • 128 Kbit
    • 256 Kbit
    • 1 Mbit
    • 4 Mbit
  • FRAM Market Product Type Outlook

    • Non-volatile FRAM
    • Volatile FRAM
  • FRAM Market Regional Outlook

    • North America
    • Europe
    • South America
    • Asia Pacific
    • Middle East and Africa
Report Attribute/Metric Details
Market Size 2023 0.45 (USD Billion)
Market Size 2024 0.5 (USD Billion)
Market Size 2035 1.5 (USD Billion)
Compound Annual Growth Rate (CAGR) 10.5% (2025 - 2035)
Report Coverage Revenue Forecast, Competitive Landscape, Growth Factors, and Trends
Base Year 2024
Market Forecast Period 2025 - 2035
Historical Data 2019 - 2024
Market Forecast Units USD Billion
Key Companies Profiled Nippon Electric Glass, Rohm Semiconductor, Fujitsu Limited, Silicon Storage Technology, Cypress Semiconductor, Winbond Electronics, Infineon Technologies, NXP Semiconductors, Alliance Memory, Texas Instruments, STMicroelectronics, Toshiba Corporation, Microchip Technology, Idt Inc
Segments Covered Technology, End Use Application, Storage Capacity, Product Type, Regional
Key Market Opportunities Increasing demand in IoT devices, Growth in automotive applications, Expansion in consumer electronics, Rising adoption in industrial automation, Advancements in smart grid technology
Key Market Dynamics Technological advancements, Growing IoT applications, Increasing demand for memory solutions, Rising automotive electronics, Enhanced data retention needs
Countries Covered North America, Europe, APAC, South America, MEA


Frequently Asked Questions (FAQ):

The FRAM Market was valued at 0.5 USD Billion in 2024.

By 2035, the FRAM Market is anticipated to reach a valuation of 1.5 USD Billion.

The expected CAGR for the FRAM Market from 2025 to 2035 is 10.5%.

North America is expected to have the highest market value in 2035, projected at 0.45 USD Billion.

The market value for Embedded FRAM is projected to be 0.6 USD Billion in 2035.

Major players in the FRAM Market include Cypress Semiconductor, Fujitsu Limited, and Texas Instruments, among others.

The Asia Pacific region is anticipated to grow to 0.36 USD Billion by 2035 from 0.12 USD Billion in 2024.

Embedded FRAM is expected to experience significant growth, with its market size increasing from 0.2 USD Billion in 2024 to 0.6 USD Billion in 2035.

Key applications driving the FRAM market include consumer electronics, automotive applications, and industrial automation.

Challenges such as technological advancements and competition from alternative memory technologies may impact the market’s growth.

Comments

FRAM Market Segmentation


  • FRAM Market By Technology (USD Billion, 2019-2035)


    • Ferroelectric RAM


    • Embedded FRAM


    • Standalone FRAM


    • Multi-bit FRAM


  • FRAM Market By End Use Application (USD Billion, 2019-2035)


    • Consumer Electronics


    • Automotive


    • Industrial


    • Telecommunication


  • FRAM Market By Storage Capacity (USD Billion, 2019-2035)


    • 128 Kbit


    • 256 Kbit


    • 1 Mbit


    • 4 Mbit


  • FRAM Market By Product Type (USD Billion, 2019-2035)


    • Non-volatile FRAM


    • Volatile FRAM


  • FRAM Market By Regional (USD Billion, 2019-2035)


    • North America


    • Europe


    • South America


    • Asia Pacific


    • Middle East and Africa


FRAM Market Regional Outlook (USD Billion, 2019-2035)


  • North America Outlook (USD Billion, 2019-2035)


    • North America FRAM Industry by Technology Type


      • Ferroelectric RAM


      • Embedded FRAM


      • Standalone FRAM


      • Multi-bit FRAM


    • North America FRAM Industry by End Use Application Type


      • Consumer Electronics


      • Automotive


      • Industrial


      • Telecommunication


    • North America FRAM Industry by Storage Capacity Type


      • 128 Kbit


      • 256 Kbit


      • 1 Mbit


      • 4 Mbit


    • North America FRAM Industry by Product Type


      • Non-volatile FRAM


      • Volatile FRAM


    • North America FRAM Industry by Regional Type


      • US


      • Canada


    • US Outlook (USD Billion, 2019-2035)


    • US FRAM Industry by Technology Type


      • Ferroelectric RAM


      • Embedded FRAM


      • Standalone FRAM


      • Multi-bit FRAM


    • US FRAM Industry by End Use Application Type


      • Consumer Electronics


      • Automotive


      • Industrial


      • Telecommunication


    • US FRAM Industry by Storage Capacity Type


      • 128 Kbit


      • 256 Kbit


      • 1 Mbit


      • 4 Mbit


    • US FRAM Industry by Product Type


      • Non-volatile FRAM


      • Volatile FRAM


    • CANADA Outlook (USD Billion, 2019-2035)


    • CANADA FRAM Industry by Technology Type


      • Ferroelectric RAM


      • Embedded FRAM


      • Standalone FRAM


      • Multi-bit FRAM


    • CANADA FRAM Industry by End Use Application Type


      • Consumer Electronics


      • Automotive


      • Industrial


      • Telecommunication


    • CANADA FRAM Industry by Storage Capacity Type


      • 128 Kbit


      • 256 Kbit


      • 1 Mbit


      • 4 Mbit


    • CANADA FRAM Industry by Product Type


      • Non-volatile FRAM


      • Volatile FRAM


  • Europe Outlook (USD Billion, 2019-2035)


    • Europe FRAM Industry by Technology Type


      • Ferroelectric RAM


      • Embedded FRAM


      • Standalone FRAM


      • Multi-bit FRAM


    • Europe FRAM Industry by End Use Application Type


      • Consumer Electronics


      • Automotive


      • Industrial


      • Telecommunication


    • Europe FRAM Industry by Storage Capacity Type


      • 128 Kbit


      • 256 Kbit


      • 1 Mbit


      • 4 Mbit


    • Europe FRAM Industry by Product Type


      • Non-volatile FRAM


      • Volatile FRAM


    • Europe FRAM Industry by Regional Type


      • Germany


      • UK


      • France


      • Russia


      • Italy


      • Spain


      • Rest of Europe


    • GERMANY Outlook (USD Billion, 2019-2035)


    • GERMANY FRAM Industry by Technology Type


      • Ferroelectric RAM


      • Embedded FRAM


      • Standalone FRAM


      • Multi-bit FRAM


    • GERMANY FRAM Industry by End Use Application Type


      • Consumer Electronics


      • Automotive


      • Industrial


      • Telecommunication


    • GERMANY FRAM Industry by Storage Capacity Type


      • 128 Kbit


      • 256 Kbit


      • 1 Mbit


      • 4 Mbit


    • GERMANY FRAM Industry by Product Type


      • Non-volatile FRAM


      • Volatile FRAM


    • UK Outlook (USD Billion, 2019-2035)


    • UK FRAM Industry by Technology Type


      • Ferroelectric RAM


      • Embedded FRAM


      • Standalone FRAM


      • Multi-bit FRAM


    • UK FRAM Industry by End Use Application Type


      • Consumer Electronics


      • Automotive


      • Industrial


      • Telecommunication


    • UK FRAM Industry by Storage Capacity Type


      • 128 Kbit


      • 256 Kbit


      • 1 Mbit


      • 4 Mbit


    • UK FRAM Industry by Product Type


      • Non-volatile FRAM


      • Volatile FRAM


    • FRANCE Outlook (USD Billion, 2019-2035)


    • FRANCE FRAM Industry by Technology Type


      • Ferroelectric RAM


      • Embedded FRAM


      • Standalone FRAM


      • Multi-bit FRAM


    • FRANCE FRAM Industry by End Use Application Type


      • Consumer Electronics


      • Automotive


      • Industrial


      • Telecommunication


    • FRANCE FRAM Industry by Storage Capacity Type


      • 128 Kbit


      • 256 Kbit


      • 1 Mbit


      • 4 Mbit


    • FRANCE FRAM Industry by Product Type


      • Non-volatile FRAM


      • Volatile FRAM


    • RUSSIA Outlook (USD Billion, 2019-2035)


    • RUSSIA FRAM Industry by Technology Type


      • Ferroelectric RAM


      • Embedded FRAM


      • Standalone FRAM


      • Multi-bit FRAM


    • RUSSIA FRAM Industry by End Use Application Type


      • Consumer Electronics


      • Automotive


      • Industrial


      • Telecommunication


    • RUSSIA FRAM Industry by Storage Capacity Type


      • 128 Kbit


      • 256 Kbit


      • 1 Mbit


      • 4 Mbit


    • RUSSIA FRAM Industry by Product Type


      • Non-volatile FRAM


      • Volatile FRAM


    • ITALY Outlook (USD Billion, 2019-2035)


    • ITALY FRAM Industry by Technology Type


      • Ferroelectric RAM


      • Embedded FRAM


      • Standalone FRAM


      • Multi-bit FRAM


    • ITALY FRAM Industry by End Use Application Type


      • Consumer Electronics


      • Automotive


      • Industrial


      • Telecommunication


    • ITALY FRAM Industry by Storage Capacity Type


      • 128 Kbit


      • 256 Kbit


      • 1 Mbit


      • 4 Mbit


    • ITALY FRAM Industry by Product Type


      • Non-volatile FRAM


      • Volatile FRAM


    • SPAIN Outlook (USD Billion, 2019-2035)


    • SPAIN FRAM Industry by Technology Type


      • Ferroelectric RAM


      • Embedded FRAM


      • Standalone FRAM


      • Multi-bit FRAM


    • SPAIN FRAM Industry by End Use Application Type


      • Consumer Electronics


      • Automotive


      • Industrial


      • Telecommunication


    • SPAIN FRAM Industry by Storage Capacity Type


      • 128 Kbit


      • 256 Kbit


      • 1 Mbit


      • 4 Mbit


    • SPAIN FRAM Industry by Product Type


      • Non-volatile FRAM


      • Volatile FRAM


    • REST OF EUROPE Outlook (USD Billion, 2019-2035)


    • REST OF EUROPE FRAM Industry by Technology Type


      • Ferroelectric RAM


      • Embedded FRAM


      • Standalone FRAM


      • Multi-bit FRAM


    • REST OF EUROPE FRAM Industry by End Use Application Type


      • Consumer Electronics


      • Automotive


      • Industrial


      • Telecommunication


    • REST OF EUROPE FRAM Industry by Storage Capacity Type


      • 128 Kbit


      • 256 Kbit


      • 1 Mbit


      • 4 Mbit


    • REST OF EUROPE FRAM Industry by Product Type


      • Non-volatile FRAM


      • Volatile FRAM


  • APAC Outlook (USD Billion, 2019-2035)


    • APAC FRAM Industry by Technology Type


      • Ferroelectric RAM


      • Embedded FRAM


      • Standalone FRAM


      • Multi-bit FRAM


    • APAC FRAM Industry by End Use Application Type


      • Consumer Electronics


      • Automotive


      • Industrial


      • Telecommunication


    • APAC FRAM Industry by Storage Capacity Type


      • 128 Kbit


      • 256 Kbit


      • 1 Mbit


      • 4 Mbit


    • APAC FRAM Industry by Product Type


      • Non-volatile FRAM


      • Volatile FRAM


    • APAC FRAM Industry by Regional Type


      • China


      • India


      • Japan


      • South Korea


      • Malaysia


      • Thailand


      • Indonesia


      • Rest of APAC


    • CHINA Outlook (USD Billion, 2019-2035)


    • CHINA FRAM Industry by Technology Type


      • Ferroelectric RAM


      • Embedded FRAM


      • Standalone FRAM


      • Multi-bit FRAM


    • CHINA FRAM Industry by End Use Application Type


      • Consumer Electronics


      • Automotive


      • Industrial


      • Telecommunication


    • CHINA FRAM Industry by Storage Capacity Type


      • 128 Kbit


      • 256 Kbit


      • 1 Mbit


      • 4 Mbit


    • CHINA FRAM Industry by Product Type


      • Non-volatile FRAM


      • Volatile FRAM


    • INDIA Outlook (USD Billion, 2019-2035)


    • INDIA FRAM Industry by Technology Type


      • Ferroelectric RAM


      • Embedded FRAM


      • Standalone FRAM


      • Multi-bit FRAM


    • INDIA FRAM Industry by End Use Application Type


      • Consumer Electronics


      • Automotive


      • Industrial


      • Telecommunication


    • INDIA FRAM Industry by Storage Capacity Type


      • 128 Kbit


      • 256 Kbit


      • 1 Mbit


      • 4 Mbit


    • INDIA FRAM Industry by Product Type


      • Non-volatile FRAM


      • Volatile FRAM


    • JAPAN Outlook (USD Billion, 2019-2035)


    • JAPAN FRAM Industry by Technology Type


      • Ferroelectric RAM


      • Embedded FRAM


      • Standalone FRAM


      • Multi-bit FRAM


    • JAPAN FRAM Industry by End Use Application Type


      • Consumer Electronics


      • Automotive


      • Industrial


      • Telecommunication


    • JAPAN FRAM Industry by Storage Capacity Type


      • 128 Kbit


      • 256 Kbit


      • 1 Mbit


      • 4 Mbit


    • JAPAN FRAM Industry by Product Type


      • Non-volatile FRAM


      • Volatile FRAM


    • SOUTH KOREA Outlook (USD Billion, 2019-2035)


    • SOUTH KOREA FRAM Industry by Technology Type


      • Ferroelectric RAM


      • Embedded FRAM


      • Standalone FRAM


      • Multi-bit FRAM


    • SOUTH KOREA FRAM Industry by End Use Application Type


      • Consumer Electronics


      • Automotive


      • Industrial


      • Telecommunication


    • SOUTH KOREA FRAM Industry by Storage Capacity Type


      • 128 Kbit


      • 256 Kbit


      • 1 Mbit


      • 4 Mbit


    • SOUTH KOREA FRAM Industry by Product Type


      • Non-volatile FRAM


      • Volatile FRAM


    • MALAYSIA Outlook (USD Billion, 2019-2035)


    • MALAYSIA FRAM Industry by Technology Type


      • Ferroelectric RAM


      • Embedded FRAM


      • Standalone FRAM


      • Multi-bit FRAM


    • MALAYSIA FRAM Industry by End Use Application Type


      • Consumer Electronics


      • Automotive


      • Industrial


      • Telecommunication


    • MALAYSIA FRAM Industry by Storage Capacity Type


      • 128 Kbit


      • 256 Kbit


      • 1 Mbit


      • 4 Mbit


    • MALAYSIA FRAM Industry by Product Type


      • Non-volatile FRAM


      • Volatile FRAM


    • THAILAND Outlook (USD Billion, 2019-2035)


    • THAILAND FRAM Industry by Technology Type


      • Ferroelectric RAM


      • Embedded FRAM


      • Standalone FRAM


      • Multi-bit FRAM


    • THAILAND FRAM Industry by End Use Application Type


      • Consumer Electronics


      • Automotive


      • Industrial


      • Telecommunication


    • THAILAND FRAM Industry by Storage Capacity Type


      • 128 Kbit


      • 256 Kbit


      • 1 Mbit


      • 4 Mbit


    • THAILAND FRAM Industry by Product Type


      • Non-volatile FRAM


      • Volatile FRAM


    • INDONESIA Outlook (USD Billion, 2019-2035)


    • INDONESIA FRAM Industry by Technology Type


      • Ferroelectric RAM


      • Embedded FRAM


      • Standalone FRAM


      • Multi-bit FRAM


    • INDONESIA FRAM Industry by End Use Application Type


      • Consumer Electronics


      • Automotive


      • Industrial


      • Telecommunication


    • INDONESIA FRAM Industry by Storage Capacity Type


      • 128 Kbit


      • 256 Kbit


      • 1 Mbit


      • 4 Mbit


    • INDONESIA FRAM Industry by Product Type


      • Non-volatile FRAM


      • Volatile FRAM


    • REST OF APAC Outlook (USD Billion, 2019-2035)


    • REST OF APAC FRAM Industry by Technology Type


      • Ferroelectric RAM


      • Embedded FRAM


      • Standalone FRAM


      • Multi-bit FRAM


    • REST OF APAC FRAM Industry by End Use Application Type


      • Consumer Electronics


      • Automotive


      • Industrial


      • Telecommunication


    • REST OF APAC FRAM Industry by Storage Capacity Type


      • 128 Kbit


      • 256 Kbit


      • 1 Mbit


      • 4 Mbit


    • REST OF APAC FRAM Industry by Product Type


      • Non-volatile FRAM


      • Volatile FRAM


  • South America Outlook (USD Billion, 2019-2035)


    • South America FRAM Industry by Technology Type


      • Ferroelectric RAM


      • Embedded FRAM


      • Standalone FRAM


      • Multi-bit FRAM


    • South America FRAM Industry by End Use Application Type


      • Consumer Electronics


      • Automotive


      • Industrial


      • Telecommunication


    • South America FRAM Industry by Storage Capacity Type


      • 128 Kbit


      • 256 Kbit


      • 1 Mbit


      • 4 Mbit


    • South America FRAM Industry by Product Type


      • Non-volatile FRAM


      • Volatile FRAM


    • South America FRAM Industry by Regional Type


      • Brazil


      • Mexico


      • Argentina


      • Rest of South America


    • BRAZIL Outlook (USD Billion, 2019-2035)


    • BRAZIL FRAM Industry by Technology Type


      • Ferroelectric RAM


      • Embedded FRAM


      • Standalone FRAM


      • Multi-bit FRAM


    • BRAZIL FRAM Industry by End Use Application Type


      • Consumer Electronics


      • Automotive


      • Industrial


      • Telecommunication


    • BRAZIL FRAM Industry by Storage Capacity Type


      • 128 Kbit


      • 256 Kbit


      • 1 Mbit


      • 4 Mbit


    • BRAZIL FRAM Industry by Product Type


      • Non-volatile FRAM


      • Volatile FRAM


    • MEXICO Outlook (USD Billion, 2019-2035)


    • MEXICO FRAM Industry by Technology Type


      • Ferroelectric RAM


      • Embedded FRAM


      • Standalone FRAM


      • Multi-bit FRAM


    • MEXICO FRAM Industry by End Use Application Type


      • Consumer Electronics


      • Automotive


      • Industrial


      • Telecommunication


    • MEXICO FRAM Industry by Storage Capacity Type


      • 128 Kbit


      • 256 Kbit


      • 1 Mbit


      • 4 Mbit


    • MEXICO FRAM Industry by Product Type


      • Non-volatile FRAM


      • Volatile FRAM


    • ARGENTINA Outlook (USD Billion, 2019-2035)


    • ARGENTINA FRAM Industry by Technology Type


      • Ferroelectric RAM


      • Embedded FRAM


      • Standalone FRAM


      • Multi-bit FRAM


    • ARGENTINA FRAM Industry by End Use Application Type


      • Consumer Electronics


      • Automotive


      • Industrial


      • Telecommunication


    • ARGENTINA FRAM Industry by Storage Capacity Type


      • 128 Kbit


      • 256 Kbit


      • 1 Mbit


      • 4 Mbit


    • ARGENTINA FRAM Industry by Product Type


      • Non-volatile FRAM


      • Volatile FRAM


    • REST OF SOUTH AMERICA Outlook (USD Billion, 2019-2035)


    • REST OF SOUTH AMERICA FRAM Industry by Technology Type


      • Ferroelectric RAM


      • Embedded FRAM


      • Standalone FRAM


      • Multi-bit FRAM


    • REST OF SOUTH AMERICA FRAM Industry by End Use Application Type


      • Consumer Electronics


      • Automotive


      • Industrial


      • Telecommunication


    • REST OF SOUTH AMERICA FRAM Industry by Storage Capacity Type


      • 128 Kbit


      • 256 Kbit


      • 1 Mbit


      • 4 Mbit


    • REST OF SOUTH AMERICA FRAM Industry by Product Type


      • Non-volatile FRAM


      • Volatile FRAM


  • MEA Outlook (USD Billion, 2019-2035)


    • MEA FRAM Industry by Technology Type


      • Ferroelectric RAM


      • Embedded FRAM


      • Standalone FRAM


      • Multi-bit FRAM


    • MEA FRAM Industry by End Use Application Type


      • Consumer Electronics


      • Automotive


      • Industrial


      • Telecommunication


    • MEA FRAM Industry by Storage Capacity Type


      • 128 Kbit


      • 256 Kbit


      • 1 Mbit


      • 4 Mbit


    • MEA FRAM Industry by Product Type


      • Non-volatile FRAM


      • Volatile FRAM


    • MEA FRAM Industry by Regional Type


      • GCC Countries


      • South Africa


      • Rest of MEA


    • GCC COUNTRIES Outlook (USD Billion, 2019-2035)


    • GCC COUNTRIES FRAM Industry by Technology Type


      • Ferroelectric RAM


      • Embedded FRAM


      • Standalone FRAM


      • Multi-bit FRAM


    • GCC COUNTRIES FRAM Industry by End Use Application Type


      • Consumer Electronics


      • Automotive


      • Industrial


      • Telecommunication


    • GCC COUNTRIES FRAM Industry by Storage Capacity Type


      • 128 Kbit


      • 256 Kbit


      • 1 Mbit


      • 4 Mbit


    • GCC COUNTRIES FRAM Industry by Product Type


      • Non-volatile FRAM


      • Volatile FRAM


    • SOUTH AFRICA Outlook (USD Billion, 2019-2035)


    • SOUTH AFRICA FRAM Industry by Technology Type


      • Ferroelectric RAM


      • Embedded FRAM


      • Standalone FRAM


      • Multi-bit FRAM


    • SOUTH AFRICA FRAM Industry by End Use Application Type


      • Consumer Electronics


      • Automotive


      • Industrial


      • Telecommunication


    • SOUTH AFRICA FRAM Industry by Storage Capacity Type


      • 128 Kbit


      • 256 Kbit


      • 1 Mbit


      • 4 Mbit


    • SOUTH AFRICA FRAM Industry by Product Type


      • Non-volatile FRAM


      • Volatile FRAM


    • REST OF MEA Outlook (USD Billion, 2019-2035)


    • REST OF MEA FRAM Industry by Technology Type


      • Ferroelectric RAM


      • Embedded FRAM


      • Standalone FRAM


      • Multi-bit FRAM


    • REST OF MEA FRAM Industry by End Use Application Type


      • Consumer Electronics


      • Automotive


      • Industrial


      • Telecommunication


    • REST OF MEA FRAM Industry by Storage Capacity Type


      • 128 Kbit


      • 256 Kbit


      • 1 Mbit


      • 4 Mbit


    • REST OF MEA FRAM Industry by Product Type


      • Non-volatile FRAM


      • Volatile FRAM


Table of Contents


  1. EXECUTIVE SUMMARY


    1. Market Overview


    2. Key Findings


    3. Market Segmentation


    4. Competitive Landscape


    5. Challenges and Opportunities


    6. Future Outlook


  1. MARKET INTRODUCTION


    1. Definition


    2. Scope of the study


      1. Research Objective


      2. Assumption


      3. Limitations


  2. RESEARCH METHODOLOGY


    1. Overview


    2. Data Mining


    3. Secondary Research


    4. Primary Research


      1. Primary Interviews and Information Gathering Process


      2. Breakdown of Primary Respondents


    5. Forecasting Model


    6. Market Size Estimation


      1. Bottom-Up Approach


      2. Top-Down Approach


    7. Data Triangulation


    8. Validation


  1. MARKET DYNAMICS


    1. Overview


    2. Drivers


    3. Restraints


    4. Opportunities


  2. MARKET FACTOR ANALYSIS


    1. Value chain Analysis


    2. Porter's Five Forces Analysis


      1. Bargaining Power of Suppliers


      2. Bargaining Power of Buyers


      3. Threat of New Entrants


      4. Threat of Substitutes


      5. Intensity of Rivalry


    3. COVID-19 Impact Analysis


      1. Market Impact Analysis


      2. Regional Impact


      3. Opportunity and Threat Analysis


  1. FRAM Market, BY Technology (USD Billion)


    1. Ferroelectric RAM


    2. Embedded FRAM


    3. Standalone FRAM


    4. Multi-bit FRAM


  2. FRAM Market, BY End Use Application (USD Billion)


    1. Consumer Electronics


    2. Automotive


    3. Industrial


    4. Telecommunication


  3. FRAM Market, BY Storage Capacity (USD Billion)


    1. 128 Kbit


    2. 256 Kbit


    3. 1 Mbit


    4. 4 Mbit


  4. FRAM Market, BY Product Type (USD Billion)


    1. Non-volatile FRAM


    2. Volatile FRAM


  5. FRAM Market, BY Regional (USD Billion)


    1. North America


      1. US


      2. Canada


    2. Europe


      1. Germany


      2. UK


      3. France


      4. Russia


      5. Italy


      6. Spain


      7. Rest of Europe


    3. APAC


      1. China


      2. India


      3. Japan


      4. South Korea


      5. Malaysia


      6. Thailand


      7. Indonesia


      8. Rest of APAC


    4. South America


      1. Brazil


      2. Mexico


      3. Argentina


      4. Rest of South America


    5. MEA


      1. GCC Countries


      2. South Africa


      3. Rest of MEA


  1. Competitive Landscape


    1. Overview


    2. Competitive Analysis


    3. Market share Analysis


    4. Major Growth Strategy in the FRAM Market


    5. Competitive Benchmarking


    6. Leading Players in Terms of Number of Developments in the FRAM Market


    7. Key developments and growth strategies


      1. New Product Launch/Service Deployment


      2. Merger & Acquisitions


      3. Joint Ventures


    8. Major Players Financial Matrix


      1. Sales and Operating Income


      2. Major Players R&D Expenditure. 2023


  2. Company Profiles


    1. Winbond Electronics


      1. Financial Overview


      2. Products Offered


      3. Key Developments


      4. SWOT Analysis


      5. Key Strategies


    2. Renesas Electronics


      1. Financial Overview


      2. Products Offered


      3. Key Developments


      4. SWOT Analysis


      5. Key Strategies


    3. Fujitsu


      1. Financial Overview


      2. Products Offered


      3. Key Developments


      4. SWOT Analysis


      5. Key Strategies


    4. Infineon Technologies


      1. Financial Overview


      2. Products Offered


      3. Key Developments


      4. SWOT Analysis


      5. Key Strategies


    5. Cypress Semiconductor


      1. Financial Overview


      2. Products Offered


      3. Key Developments


      4. SWOT Analysis


      5. Key Strategies


    6. NXP Semiconductors


      1. Financial Overview


      2. Products Offered


      3. Key Developments


      4. SWOT Analysis


      5. Key Strategies


    7. STMicroelectronics


      1. Financial Overview


      2. Products Offered


      3. Key Developments


      4. SWOT Analysis


      5. Key Strategies


    8. Microchip Technology


      1. Financial Overview


      2. Products Offered


      3. Key Developments


      4. SWOT Analysis


      5. Key Strategies


    9. Toshiba


      1. Financial Overview


      2. Products Offered


      3. Key Developments


      4. SWOT Analysis


      5. Key Strategies


    10. Texas Instruments


      1. Financial Overview


      2. Products Offered


      3. Key Developments


      4. SWOT Analysis


      5. Key Strategies


    11. Samsung Electronics


      1. Financial Overview


      2. Products Offered


      3. Key Developments


      4. SWOT Analysis


      5. Key Strategies


    12. ON Semiconductor


      1. Financial Overview


      2. Products Offered


      3. Key Developments


      4. SWOT Analysis


      5. Key Strategies


    13. Kioxia


      1. Financial Overview


      2. Products Offered


      3. Key Developments


      4. SWOT Analysis


      5. Key Strategies


    14. Etron Technology


      1. Financial Overview


      2. Products Offered


      3. Key Developments


      4. SWOT Analysis


      5. Key Strategies


    15. Seiko Instruments


      1. Financial Overview


      2. Products Offered


      3. Key Developments


      4. SWOT Analysis


      5. Key Strategies


  3. Appendix


    1. References


    2. Related Reports


LIST Of tables


  1. LIST OF ASSUMPTIONS


  2. North America Market SIZE ESTIMATES & FORECAST, BY TECHNOLOGY, 2019-2035 (USD Billions)


  3. North America Market SIZE ESTIMATES & FORECAST, BY END USE APPLICATION, 2019-2035 (USD Billions)


  4. North America Market SIZE ESTIMATES & FORECAST, BY STORAGE CAPACITY, 2019-2035 (USD Billions)


  5. North America Market SIZE ESTIMATES & FORECAST, BY PRODUCT TYPE, 2019-2035 (USD Billions)


  6. North America Market SIZE ESTIMATES & FORECAST, BY REGIONAL, 2019-2035 (USD Billions)


  7. US Market SIZE ESTIMATES & FORECAST, BY TECHNOLOGY, 2019-2035 (USD Billions)


  8. US Market SIZE ESTIMATES & FORECAST, BY END USE APPLICATION, 2019-2035 (USD Billions)


  9. US Market SIZE ESTIMATES & FORECAST, BY STORAGE CAPACITY, 2019-2035 (USD Billions)


  10. US Market SIZE ESTIMATES & FORECAST, BY PRODUCT TYPE, 2019-2035 (USD Billions)


  11. US Market SIZE ESTIMATES & FORECAST, BY REGIONAL, 2019-2035 (USD Billions)


  12. Canada Market SIZE ESTIMATES & FORECAST, BY TECHNOLOGY, 2019-2035 (USD Billions)


  13. Canada Market SIZE ESTIMATES & FORECAST, BY END USE APPLICATION, 2019-2035 (USD Billions)


  14. Canada Market SIZE ESTIMATES & FORECAST, BY STORAGE CAPACITY, 2019-2035 (USD Billions)


  15. Canada Market SIZE ESTIMATES & FORECAST, BY PRODUCT TYPE, 2019-2035 (USD Billions)


  16. Canada Market SIZE ESTIMATES & FORECAST, BY REGIONAL, 2019-2035 (USD Billions)


  17. Europe Market SIZE ESTIMATES & FORECAST, BY TECHNOLOGY, 2019-2035 (USD Billions)


  18. Europe Market SIZE ESTIMATES & FORECAST, BY END USE APPLICATION, 2019-2035 (USD Billions)


  19. Europe Market SIZE ESTIMATES & FORECAST, BY STORAGE CAPACITY, 2019-2035 (USD Billions)


  20. Europe Market SIZE ESTIMATES & FORECAST, BY PRODUCT TYPE, 2019-2035 (USD Billions)


  21. Europe Market SIZE ESTIMATES & FORECAST, BY REGIONAL, 2019-2035 (USD Billions)


  22. Germany Market SIZE ESTIMATES & FORECAST, BY TECHNOLOGY, 2019-2035 (USD Billions)


  23. Germany Market SIZE ESTIMATES & FORECAST, BY END USE APPLICATION, 2019-2035 (USD Billions)


  24. Germany Market SIZE ESTIMATES & FORECAST, BY STORAGE CAPACITY, 2019-2035 (USD Billions)


  25. Germany Market SIZE ESTIMATES & FORECAST, BY PRODUCT TYPE, 2019-2035 (USD Billions)


  26. Germany Market SIZE ESTIMATES & FORECAST, BY REGIONAL, 2019-2035 (USD Billions)


  27. UK Market SIZE ESTIMATES & FORECAST, BY TECHNOLOGY, 2019-2035 (USD Billions)


  28. UK Market SIZE ESTIMATES & FORECAST, BY END USE APPLICATION, 2019-2035 (USD Billions)


  29. UK Market SIZE ESTIMATES & FORECAST, BY STORAGE CAPACITY, 2019-2035 (USD Billions)


  30. UK Market SIZE ESTIMATES & FORECAST, BY PRODUCT TYPE, 2019-2035 (USD Billions)


  31. UK Market SIZE ESTIMATES & FORECAST, BY REGIONAL, 2019-2035 (USD Billions)


  32. France Market SIZE ESTIMATES & FORECAST, BY TECHNOLOGY, 2019-2035 (USD Billions)


  33. France Market SIZE ESTIMATES & FORECAST, BY END USE APPLICATION, 2019-2035 (USD Billions)


  34. France Market SIZE ESTIMATES & FORECAST, BY STORAGE CAPACITY, 2019-2035 (USD Billions)


  35. France Market SIZE ESTIMATES & FORECAST, BY PRODUCT TYPE, 2019-2035 (USD Billions)


  36. France Market SIZE ESTIMATES & FORECAST, BY REGIONAL, 2019-2035 (USD Billions)


  37. Russia Market SIZE ESTIMATES & FORECAST, BY TECHNOLOGY, 2019-2035 (USD Billions)


  38. Russia Market SIZE ESTIMATES & FORECAST, BY END USE APPLICATION, 2019-2035 (USD Billions)


  39. Russia Market SIZE ESTIMATES & FORECAST, BY STORAGE CAPACITY, 2019-2035 (USD Billions)


  40. Russia Market SIZE ESTIMATES & FORECAST, BY PRODUCT TYPE, 2019-2035 (USD Billions)


  41. Russia Market SIZE ESTIMATES & FORECAST, BY REGIONAL, 2019-2035 (USD Billions)


  42. Italy Market SIZE ESTIMATES & FORECAST, BY TECHNOLOGY, 2019-2035 (USD Billions)


  43. Italy Market SIZE ESTIMATES & FORECAST, BY END USE APPLICATION, 2019-2035 (USD Billions)


  44. Italy Market SIZE ESTIMATES & FORECAST, BY STORAGE CAPACITY, 2019-2035 (USD Billions)


  45. Italy Market SIZE ESTIMATES & FORECAST, BY PRODUCT TYPE, 2019-2035 (USD Billions)


  46. Italy Market SIZE ESTIMATES & FORECAST, BY REGIONAL, 2019-2035 (USD Billions)


  47. Spain Market SIZE ESTIMATES & FORECAST, BY TECHNOLOGY, 2019-2035 (USD Billions)


  48. Spain Market SIZE ESTIMATES & FORECAST, BY END USE APPLICATION, 2019-2035 (USD Billions)


  49. Spain Market SIZE ESTIMATES & FORECAST, BY STORAGE CAPACITY, 2019-2035 (USD Billions)


  50. Spain Market SIZE ESTIMATES & FORECAST, BY PRODUCT TYPE, 2019-2035 (USD Billions)


  51. Spain Market SIZE ESTIMATES & FORECAST, BY REGIONAL, 2019-2035 (USD Billions)


  52. Rest of Europe Market SIZE ESTIMATES & FORECAST, BY TECHNOLOGY, 2019-2035 (USD Billions)


  53. Rest of Europe Market SIZE ESTIMATES & FORECAST, BY END USE APPLICATION, 2019-2035 (USD Billions)


  54. Rest of Europe Market SIZE ESTIMATES & FORECAST, BY STORAGE CAPACITY, 2019-2035 (USD Billions)


  55. Rest of Europe Market SIZE ESTIMATES & FORECAST, BY PRODUCT TYPE, 2019-2035 (USD Billions)


  56. Rest of Europe Market SIZE ESTIMATES & FORECAST, BY REGIONAL, 2019-2035 (USD Billions)


  57. APAC Market SIZE ESTIMATES & FORECAST, BY TECHNOLOGY, 2019-2035 (USD Billions)


  58. APAC Market SIZE ESTIMATES & FORECAST, BY END USE APPLICATION, 2019-2035 (USD Billions)


  59. APAC Market SIZE ESTIMATES & FORECAST, BY STORAGE CAPACITY, 2019-2035 (USD Billions)


  60. APAC Market SIZE ESTIMATES & FORECAST, BY PRODUCT TYPE, 2019-2035 (USD Billions)


  61. APAC Market SIZE ESTIMATES & FORECAST, BY REGIONAL, 2019-2035 (USD Billions)


  62. China Market SIZE ESTIMATES & FORECAST, BY TECHNOLOGY, 2019-2035 (USD Billions)


  63. China Market SIZE ESTIMATES & FORECAST, BY END USE APPLICATION, 2019-2035 (USD Billions)


  64. China Market SIZE ESTIMATES & FORECAST, BY STORAGE CAPACITY, 2019-2035 (USD Billions)


  65. China Market SIZE ESTIMATES & FORECAST, BY PRODUCT TYPE, 2019-2035 (USD Billions)


  66. China Market SIZE ESTIMATES & FORECAST, BY REGIONAL, 2019-2035 (USD Billions)


  67. India Market SIZE ESTIMATES & FORECAST, BY TECHNOLOGY, 2019-2035 (USD Billions)


  68. India Market SIZE ESTIMATES & FORECAST, BY END USE APPLICATION, 2019-2035 (USD Billions)


  69. India Market SIZE ESTIMATES & FORECAST, BY STORAGE CAPACITY, 2019-2035 (USD Billions)


  70. India Market SIZE ESTIMATES & FORECAST, BY PRODUCT TYPE, 2019-2035 (USD Billions)


  71. India Market SIZE ESTIMATES & FORECAST, BY REGIONAL, 2019-2035 (USD Billions)


  72. Japan Market SIZE ESTIMATES & FORECAST, BY TECHNOLOGY, 2019-2035 (USD Billions)


  73. Japan Market SIZE ESTIMATES & FORECAST, BY END USE APPLICATION, 2019-2035 (USD Billions)


  74. Japan Market SIZE ESTIMATES & FORECAST, BY STORAGE CAPACITY, 2019-2035 (USD Billions)


  75. Japan Market SIZE ESTIMATES & FORECAST, BY PRODUCT TYPE, 2019-2035 (USD Billions)


  76. Japan Market SIZE ESTIMATES & FORECAST, BY REGIONAL, 2019-2035 (USD Billions)


  77. South Korea Market SIZE ESTIMATES & FORECAST, BY TECHNOLOGY, 2019-2035 (USD Billions)


  78. South Korea Market SIZE ESTIMATES & FORECAST, BY END USE APPLICATION, 2019-2035 (USD Billions)


  79. South Korea Market SIZE ESTIMATES & FORECAST, BY STORAGE CAPACITY, 2019-2035 (USD Billions)


  80. South Korea Market SIZE ESTIMATES & FORECAST, BY PRODUCT TYPE, 2019-2035 (USD Billions)


  81. South Korea Market SIZE ESTIMATES & FORECAST, BY REGIONAL, 2019-2035 (USD Billions)


  82. Malaysia Market SIZE ESTIMATES & FORECAST, BY TECHNOLOGY, 2019-2035 (USD Billions)


  83. Malaysia Market SIZE ESTIMATES & FORECAST, BY END USE APPLICATION, 2019-2035 (USD Billions)


  84. Malaysia Market SIZE ESTIMATES & FORECAST, BY STORAGE CAPACITY, 2019-2035 (USD Billions)


  85. Malaysia Market SIZE ESTIMATES & FORECAST, BY PRODUCT TYPE, 2019-2035 (USD Billions)


  86. Malaysia Market SIZE ESTIMATES & FORECAST, BY REGIONAL, 2019-2035 (USD Billions)


  87. Thailand Market SIZE ESTIMATES & FORECAST, BY TECHNOLOGY, 2019-2035 (USD Billions)


  88. Thailand Market SIZE ESTIMATES & FORECAST, BY END USE APPLICATION, 2019-2035 (USD Billions)


  89. Thailand Market SIZE ESTIMATES & FORECAST, BY STORAGE CAPACITY, 2019-2035 (USD Billions)


  90. Thailand Market SIZE ESTIMATES & FORECAST, BY PRODUCT TYPE, 2019-2035 (USD Billions)


  91. Thailand Market SIZE ESTIMATES & FORECAST, BY REGIONAL, 2019-2035 (USD Billions)


  92. Indonesia Market SIZE ESTIMATES & FORECAST, BY TECHNOLOGY, 2019-2035 (USD Billions)


  93. Indonesia Market SIZE ESTIMATES & FORECAST, BY END USE APPLICATION, 2019-2035 (USD Billions)


  94. Indonesia Market SIZE ESTIMATES & FORECAST, BY STORAGE CAPACITY, 2019-2035 (USD Billions)


  95. Indonesia Market SIZE ESTIMATES & FORECAST, BY PRODUCT TYPE, 2019-2035 (USD Billions)


  96. Indonesia Market SIZE ESTIMATES & FORECAST, BY REGIONAL, 2019-2035 (USD Billions)


  97. Rest of APAC Market SIZE ESTIMATES & FORECAST, BY TECHNOLOGY, 2019-2035 (USD Billions)


  98. Rest of APAC Market SIZE ESTIMATES & FORECAST, BY END USE APPLICATION, 2019-2035 (USD Billions)


  99. Rest of APAC Market SIZE ESTIMATES & FORECAST, BY STORAGE CAPACITY, 2019-2035 (USD Billions)


  100. Rest of APAC Market SIZE ESTIMATES & FORECAST, BY PRODUCT TYPE, 2019-2035 (USD Billions)


  101. Rest of APAC Market SIZE ESTIMATES & FORECAST, BY REGIONAL, 2019-2035 (USD Billions)


  102. South America Market SIZE ESTIMATES & FORECAST, BY TECHNOLOGY, 2019-2035 (USD Billions)


  103. South America Market SIZE ESTIMATES & FORECAST, BY END USE APPLICATION, 2019-2035 (USD Billions)


  104. South America Market SIZE ESTIMATES & FORECAST, BY STORAGE CAPACITY, 2019-2035 (USD Billions)


  105. South America Market SIZE ESTIMATES & FORECAST, BY PRODUCT TYPE, 2019-2035 (USD Billions)


  106. South America Market SIZE ESTIMATES & FORECAST, BY REGIONAL, 2019-2035 (USD Billions)


  107. Brazil Market SIZE ESTIMATES & FORECAST, BY TECHNOLOGY, 2019-2035 (USD Billions)


  108. Brazil Market SIZE ESTIMATES & FORECAST, BY END USE APPLICATION, 2019-2035 (USD Billions)


  109. Brazil Market SIZE ESTIMATES & FORECAST, BY STORAGE CAPACITY, 2019-2035 (USD Billions)


  110. Brazil Market SIZE ESTIMATES & FORECAST, BY PRODUCT TYPE, 2019-2035 (USD Billions)


  111. Brazil Market SIZE ESTIMATES & FORECAST, BY REGIONAL, 2019-2035 (USD Billions)


  112. Mexico Market SIZE ESTIMATES & FORECAST, BY TECHNOLOGY, 2019-2035 (USD Billions)


  113. Mexico Market SIZE ESTIMATES & FORECAST, BY END USE APPLICATION, 2019-2035 (USD Billions)


  114. Mexico Market SIZE ESTIMATES & FORECAST, BY STORAGE CAPACITY, 2019-2035 (USD Billions)


  115. Mexico Market SIZE ESTIMATES & FORECAST, BY PRODUCT TYPE, 2019-2035 (USD Billions)


  116. Mexico Market SIZE ESTIMATES & FORECAST, BY REGIONAL, 2019-2035 (USD Billions)


  117. Argentina Market SIZE ESTIMATES & FORECAST, BY TECHNOLOGY, 2019-2035 (USD Billions)


  118. Argentina Market SIZE ESTIMATES & FORECAST, BY END USE APPLICATION, 2019-2035 (USD Billions)


  119. Argentina Market SIZE ESTIMATES & FORECAST, BY STORAGE CAPACITY, 2019-2035 (USD Billions)


  120. Argentina Market SIZE ESTIMATES & FORECAST, BY PRODUCT TYPE, 2019-2035 (USD Billions)


  121. Argentina Market SIZE ESTIMATES & FORECAST, BY REGIONAL, 2019-2035 (USD Billions)


  122. Rest of South America Market SIZE ESTIMATES & FORECAST, BY TECHNOLOGY, 2019-2035 (USD Billions)


  123. Rest of South America Market SIZE ESTIMATES & FORECAST, BY END USE APPLICATION, 2019-2035 (USD Billions)


  124. Rest of South America Market SIZE ESTIMATES & FORECAST, BY STORAGE CAPACITY, 2019-2035 (USD Billions)


  125. Rest of South America Market SIZE ESTIMATES & FORECAST, BY PRODUCT TYPE, 2019-2035 (USD Billions)


  126. Rest of South America Market SIZE ESTIMATES & FORECAST, BY REGIONAL, 2019-2035 (USD Billions)


  127. MEA Market SIZE ESTIMATES & FORECAST, BY TECHNOLOGY, 2019-2035 (USD Billions)


  128. MEA Market SIZE ESTIMATES & FORECAST, BY END USE APPLICATION, 2019-2035 (USD Billions)


  129. MEA Market SIZE ESTIMATES & FORECAST, BY STORAGE CAPACITY, 2019-2035 (USD Billions)


  130. MEA Market SIZE ESTIMATES & FORECAST, BY PRODUCT TYPE, 2019-2035 (USD Billions)


  131. MEA Market SIZE ESTIMATES & FORECAST, BY REGIONAL, 2019-2035 (USD Billions)


  132. GCC Countries Market SIZE ESTIMATES & FORECAST, BY TECHNOLOGY, 2019-2035 (USD Billions)


  133. GCC Countries Market SIZE ESTIMATES & FORECAST, BY END USE APPLICATION, 2019-2035 (USD Billions)


  134. GCC Countries Market SIZE ESTIMATES & FORECAST, BY STORAGE CAPACITY, 2019-2035 (USD Billions)


  135. GCC Countries Market SIZE ESTIMATES & FORECAST, BY PRODUCT TYPE, 2019-2035 (USD Billions)


  136. GCC Countries Market SIZE ESTIMATES & FORECAST, BY REGIONAL, 2019-2035 (USD Billions)


  137. South Africa Market SIZE ESTIMATES & FORECAST, BY TECHNOLOGY, 2019-2035 (USD Billions)


  138. South Africa Market SIZE ESTIMATES & FORECAST, BY END USE APPLICATION, 2019-2035 (USD Billions)


  139. South Africa Market SIZE ESTIMATES & FORECAST, BY STORAGE CAPACITY, 2019-2035 (USD Billions)


  140. South Africa Market SIZE ESTIMATES & FORECAST, BY PRODUCT TYPE, 2019-2035 (USD Billions)


  141. South Africa Market SIZE ESTIMATES & FORECAST, BY REGIONAL, 2019-2035 (USD Billions)


  142. Rest of MEA Market SIZE ESTIMATES & FORECAST, BY TECHNOLOGY, 2019-2035 (USD Billions)


  143. Rest of MEA Market SIZE ESTIMATES & FORECAST, BY END USE APPLICATION, 2019-2035 (USD Billions)


  144. Rest of MEA Market SIZE ESTIMATES & FORECAST, BY STORAGE CAPACITY, 2019-2035 (USD Billions)


  145. Rest of MEA Market SIZE ESTIMATES & FORECAST, BY PRODUCT TYPE, 2019-2035 (USD Billions)


  146. Rest of MEA Market SIZE ESTIMATES & FORECAST, BY REGIONAL, 2019-2035 (USD Billions)


  147. PRODUCT LAUNCH/PRODUCT DEVELOPMENT/APPROVAL


  148. ACQUISITION/PARTNERSHIP


LIST Of figures


  1. FRAM MARKET SYNOPSIS


  2. NORTH AMERICA FRAM MARKET ANALYSIS


  3. US MARKET ANALYSIS BY TECHNOLOGY


  4. US MARKET ANALYSIS BY END USE APPLICATION


  5. US MARKET ANALYSIS BY STORAGE CAPACITY


  6. US MARKET ANALYSIS BY PRODUCT TYPE


  7. US MARKET ANALYSIS BY REGIONAL


  8. CANADA MARKET ANALYSIS BY TECHNOLOGY


  9. CANADA MARKET ANALYSIS BY END USE APPLICATION


  10. CANADA MARKET ANALYSIS BY STORAGE CAPACITY


  11. CANADA MARKET ANALYSIS BY PRODUCT TYPE


  12. CANADA MARKET ANALYSIS BY REGIONAL


  13. EUROPE FRAM MARKET ANALYSIS


  14. GERMANY MARKET ANALYSIS BY TECHNOLOGY


  15. GERMANY MARKET ANALYSIS BY END USE APPLICATION


  16. GERMANY MARKET ANALYSIS BY STORAGE CAPACITY


  17. GERMANY MARKET ANALYSIS BY PRODUCT TYPE


  18. GERMANY MARKET ANALYSIS BY REGIONAL


  19. UK MARKET ANALYSIS BY TECHNOLOGY


  20. UK MARKET ANALYSIS BY END USE APPLICATION


  21. UK MARKET ANALYSIS BY STORAGE CAPACITY


  22. UK MARKET ANALYSIS BY PRODUCT TYPE


  23. UK MARKET ANALYSIS BY REGIONAL


  24. FRANCE MARKET ANALYSIS BY TECHNOLOGY


  25. FRANCE MARKET ANALYSIS BY END USE APPLICATION


  26. FRANCE MARKET ANALYSIS BY STORAGE CAPACITY


  27. FRANCE MARKET ANALYSIS BY PRODUCT TYPE


  28. FRANCE MARKET ANALYSIS BY REGIONAL


  29. RUSSIA MARKET ANALYSIS BY TECHNOLOGY


  30. RUSSIA MARKET ANALYSIS BY END USE APPLICATION


  31. RUSSIA MARKET ANALYSIS BY STORAGE CAPACITY


  32. RUSSIA MARKET ANALYSIS BY PRODUCT TYPE


  33. RUSSIA MARKET ANALYSIS BY REGIONAL


  34. ITALY MARKET ANALYSIS BY TECHNOLOGY


  35. ITALY MARKET ANALYSIS BY END USE APPLICATION


  36. ITALY MARKET ANALYSIS BY STORAGE CAPACITY


  37. ITALY MARKET ANALYSIS BY PRODUCT TYPE


  38. ITALY MARKET ANALYSIS BY REGIONAL


  39. SPAIN MARKET ANALYSIS BY TECHNOLOGY


  40. SPAIN MARKET ANALYSIS BY END USE APPLICATION


  41. SPAIN MARKET ANALYSIS BY STORAGE CAPACITY


  42. SPAIN MARKET ANALYSIS BY PRODUCT TYPE


  43. SPAIN MARKET ANALYSIS BY REGIONAL


  44. REST OF EUROPE MARKET ANALYSIS BY TECHNOLOGY


  45. REST OF EUROPE MARKET ANALYSIS BY END USE APPLICATION


  46. REST OF EUROPE MARKET ANALYSIS BY STORAGE CAPACITY


  47. REST OF EUROPE MARKET ANALYSIS BY PRODUCT TYPE


  48. REST OF EUROPE MARKET ANALYSIS BY REGIONAL


  49. APAC FRAM MARKET ANALYSIS


  50. CHINA MARKET ANALYSIS BY TECHNOLOGY


  51. CHINA MARKET ANALYSIS BY END USE APPLICATION


  52. CHINA MARKET ANALYSIS BY STORAGE CAPACITY


  53. CHINA MARKET ANALYSIS BY PRODUCT TYPE


  54. CHINA MARKET ANALYSIS BY REGIONAL


  55. INDIA MARKET ANALYSIS BY TECHNOLOGY


  56. INDIA MARKET ANALYSIS BY END USE APPLICATION


  57. INDIA MARKET ANALYSIS BY STORAGE CAPACITY


  58. INDIA MARKET ANALYSIS BY PRODUCT TYPE


  59. INDIA MARKET ANALYSIS BY REGIONAL


  60. JAPAN MARKET ANALYSIS BY TECHNOLOGY


  61. JAPAN MARKET ANALYSIS BY END USE APPLICATION


  62. JAPAN MARKET ANALYSIS BY STORAGE CAPACITY


  63. JAPAN MARKET ANALYSIS BY PRODUCT TYPE


  64. JAPAN MARKET ANALYSIS BY REGIONAL


  65. SOUTH KOREA MARKET ANALYSIS BY TECHNOLOGY


  66. SOUTH KOREA MARKET ANALYSIS BY END USE APPLICATION


  67. SOUTH KOREA MARKET ANALYSIS BY STORAGE CAPACITY


  68. SOUTH KOREA MARKET ANALYSIS BY PRODUCT TYPE


  69. SOUTH KOREA MARKET ANALYSIS BY REGIONAL


  70. MALAYSIA MARKET ANALYSIS BY TECHNOLOGY


  71. MALAYSIA MARKET ANALYSIS BY END USE APPLICATION


  72. MALAYSIA MARKET ANALYSIS BY STORAGE CAPACITY


  73. MALAYSIA MARKET ANALYSIS BY PRODUCT TYPE


  74. MALAYSIA MARKET ANALYSIS BY REGIONAL


  75. THAILAND MARKET ANALYSIS BY TECHNOLOGY


  76. THAILAND MARKET ANALYSIS BY END USE APPLICATION


  77. THAILAND MARKET ANALYSIS BY STORAGE CAPACITY


  78. THAILAND MARKET ANALYSIS BY PRODUCT TYPE


  79. THAILAND MARKET ANALYSIS BY REGIONAL


  80. INDONESIA MARKET ANALYSIS BY TECHNOLOGY


  81. INDONESIA MARKET ANALYSIS BY END USE APPLICATION


  82. INDONESIA MARKET ANALYSIS BY STORAGE CAPACITY


  83. INDONESIA MARKET ANALYSIS BY PRODUCT TYPE


  84. INDONESIA MARKET ANALYSIS BY REGIONAL


  85. REST OF APAC MARKET ANALYSIS BY TECHNOLOGY


  86. REST OF APAC MARKET ANALYSIS BY END USE APPLICATION


  87. REST OF APAC MARKET ANALYSIS BY STORAGE CAPACITY


  88. REST OF APAC MARKET ANALYSIS BY PRODUCT TYPE


  89. REST OF APAC MARKET ANALYSIS BY REGIONAL


  90. SOUTH AMERICA FRAM MARKET ANALYSIS


  91. BRAZIL MARKET ANALYSIS BY TECHNOLOGY


  92. BRAZIL MARKET ANALYSIS BY END USE APPLICATION


  93. BRAZIL MARKET ANALYSIS BY STORAGE CAPACITY


  94. BRAZIL MARKET ANALYSIS BY PRODUCT TYPE


  95. BRAZIL MARKET ANALYSIS BY REGIONAL


  96. MEXICO MARKET ANALYSIS BY TECHNOLOGY


  97. MEXICO MARKET ANALYSIS BY END USE APPLICATION


  98. MEXICO MARKET ANALYSIS BY STORAGE CAPACITY


  99. MEXICO MARKET ANALYSIS BY PRODUCT TYPE


  100. MEXICO MARKET ANALYSIS BY REGIONAL


  101. ARGENTINA MARKET ANALYSIS BY TECHNOLOGY


  102. ARGENTINA MARKET ANALYSIS BY END USE APPLICATION


  103. ARGENTINA MARKET ANALYSIS BY STORAGE CAPACITY


  104. ARGENTINA MARKET ANALYSIS BY PRODUCT TYPE


  105. ARGENTINA MARKET ANALYSIS BY REGIONAL


  106. REST OF SOUTH AMERICA MARKET ANALYSIS BY TECHNOLOGY


  107. REST OF SOUTH AMERICA MARKET ANALYSIS BY END USE APPLICATION


  108. REST OF SOUTH AMERICA MARKET ANALYSIS BY STORAGE CAPACITY


  109. REST OF SOUTH AMERICA MARKET ANALYSIS BY PRODUCT TYPE


  110. REST OF SOUTH AMERICA MARKET ANALYSIS BY REGIONAL


  111. MEA FRAM MARKET ANALYSIS


  112. GCC COUNTRIES MARKET ANALYSIS BY TECHNOLOGY


  113. GCC COUNTRIES MARKET ANALYSIS BY END USE APPLICATION


  114. GCC COUNTRIES MARKET ANALYSIS BY STORAGE CAPACITY


  115. GCC COUNTRIES MARKET ANALYSIS BY PRODUCT TYPE


  116. GCC COUNTRIES MARKET ANALYSIS BY REGIONAL


  117. SOUTH AFRICA MARKET ANALYSIS BY TECHNOLOGY


  118. SOUTH AFRICA MARKET ANALYSIS BY END USE APPLICATION


  119. SOUTH AFRICA MARKET ANALYSIS BY STORAGE CAPACITY


  120. SOUTH AFRICA MARKET ANALYSIS BY PRODUCT TYPE


  121. SOUTH AFRICA MARKET ANALYSIS BY REGIONAL


  122. REST OF MEA MARKET ANALYSIS BY TECHNOLOGY


  123. REST OF MEA MARKET ANALYSIS BY END USE APPLICATION


  124. REST OF MEA MARKET ANALYSIS BY STORAGE CAPACITY


  125. REST OF MEA MARKET ANALYSIS BY PRODUCT TYPE


  126. REST OF MEA MARKET ANALYSIS BY REGIONAL


  127. KEY BUYING CRITERIA OF FRAM MARKET


  128. RESEARCH PROCESS OF MRFR


  129. DRO ANALYSIS OF FRAM MARKET


  130. DRIVERS IMPACT ANALYSIS: FRAM MARKET


  131. RESTRAINTS IMPACT ANALYSIS: FRAM MARKET


  132. SUPPLY / VALUE CHAIN: FRAM MARKET


  133. FRAM MARKET, BY TECHNOLOGY, 2025 (% SHARE)


  134. FRAM MARKET, BY TECHNOLOGY, 2019 TO 2035 (USD Billions)


  135. FRAM MARKET, BY END USE APPLICATION, 2025 (% SHARE)


  136. FRAM MARKET, BY END USE APPLICATION, 2019 TO 2035 (USD Billions)


  137. FRAM MARKET, BY STORAGE CAPACITY, 2025 (% SHARE)


  138. FRAM MARKET, BY STORAGE CAPACITY, 2019 TO 2035 (USD Billions)


  139. FRAM MARKET, BY PRODUCT TYPE, 2025 (% SHARE)


  140. FRAM MARKET, BY PRODUCT TYPE, 2019 TO 2035 (USD Billions)


  141. FRAM MARKET, BY REGIONAL, 2025 (% SHARE)


  142. FRAM MARKET, BY REGIONAL, 2019 TO 2035 (USD Billions)


  143. BENCHMARKING OF MAJOR COMPETITORS


Leading companies partner with us for data-driven Insights.

clients

Kindly complete the form below to receive a free sample of this Report

We do not share your information with anyone. However, we may send you emails based on your report interest from time to time. You may contact us at any time to opt-out.

Tailored for You
  • Dedicated Research on any specifics segment or region.
  • Focused Research on specific players in the market.
  • Custom Report based only on your requirements.
  • Flexibility to add or subtract any chapter in the study.
  • Historic data from 2014 and forecasts outlook till 2040.
  • Flexibility of providing data/insights in formats (PDF, PPT, Excel).
  • Provide cross segmentation in applicable scenario/markets.
report-img
ChatGPT Summarize Gemini Summarize Perplexity AI Summarize Grok AI Summarize Copilot Summarize