Fortified Beverages Market
ID: MRFR/FnB/2174-HCR
128 Pages
Sakshi Gupta
Last Updated: April 24, 2026
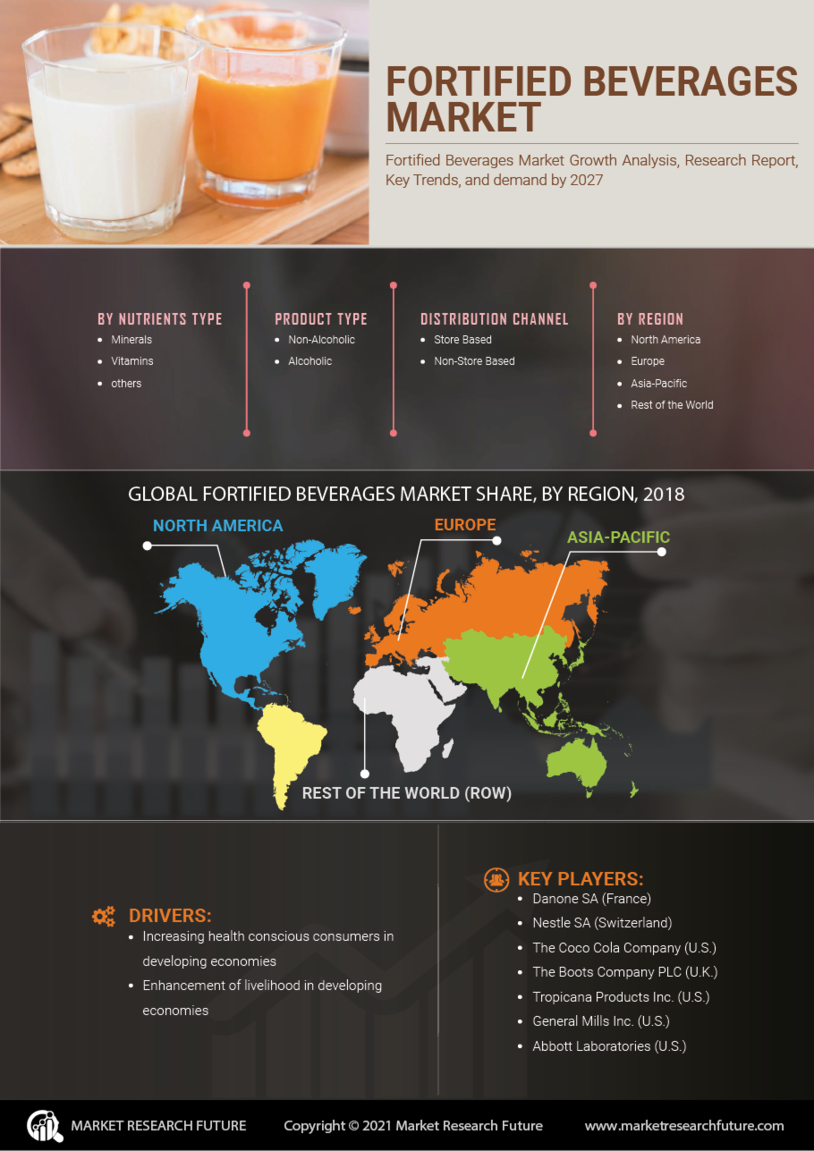
Fortified Beverages Market Size, Share, Industry Trend & Analysis Research Report By Product Type (Vitamins, Minerals, Protein, Electrolytes), By Distribution Channel (Supermarkets, Online Retail, Convenience Stores, Health Food Shops), By Consumer Type (Children, Adults, Elderly), By Form (Liquid, Powder, Ready-to-Drink) andBy Regional (North America, Europe, South America, Asia Pacific, Middle East and Africa)- Forecast to 2035