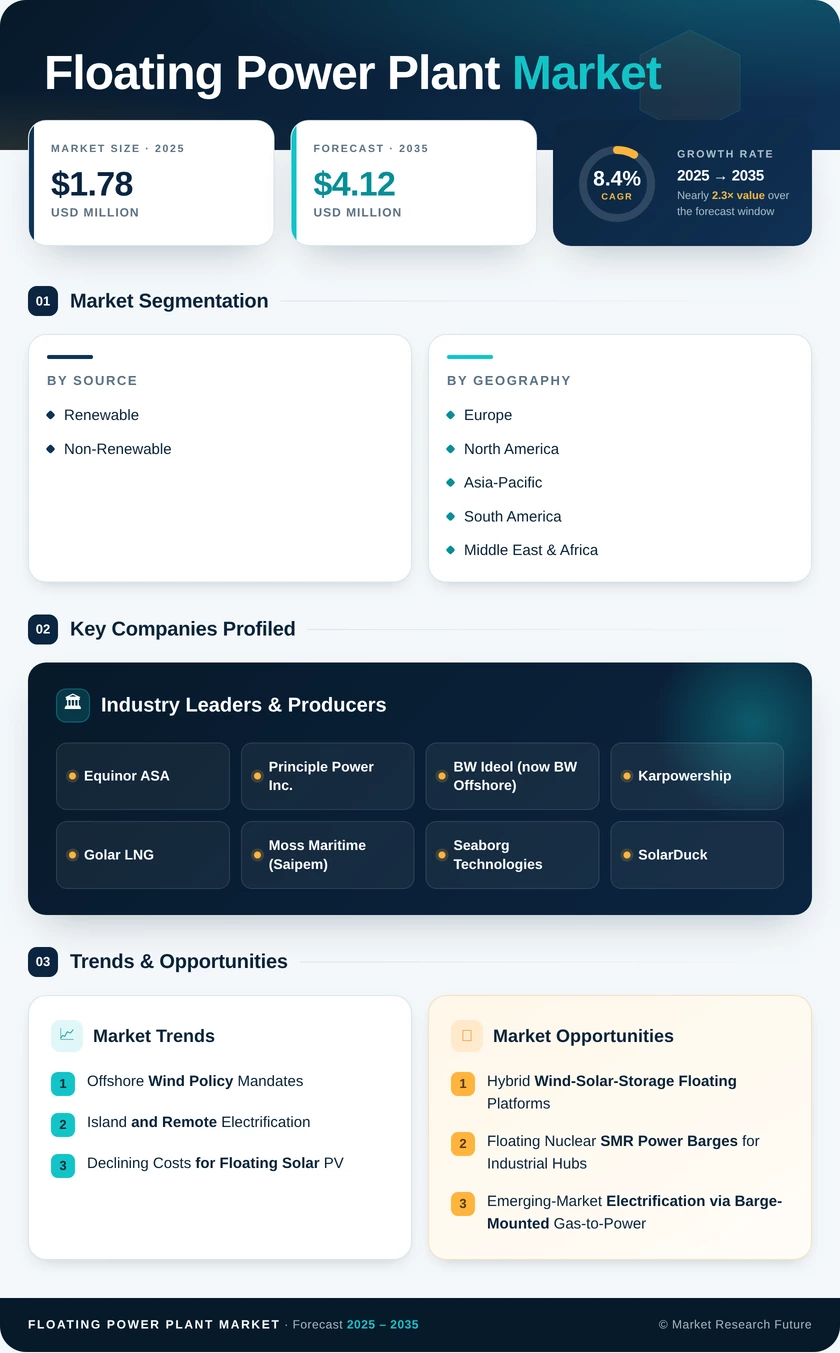
Floating Power Plant Market (2026 - 2035)

ID: MRFR/EnP/2512-CR
135 Pages
Anshula Mandaokar
Last Updated: July 07, 2026
Floating Power Plant Market Size, Share & Growth Analysis Report By Fuel Type (Natural Gas, Biomass, Coal, Renewable Energy, Diesel), By Technology (Floating Solar, Floating Wind, Ocean Thermal Energy Conversion, Wave Energy Conversion), By Installation Type (Fixed, Mobile, Hybrid), By End Use (Utility, Industrial, Commercial, Residential) and By Regional (North America, Europe, South America, Asia Pacific, Middle East and Africa) - Trends & Industry Forecast to 2035
Floating Power Plant Market
Market Size
Forecast Period2026-2035
CAGR (2026-2035)8.4%
2025 Market SizeUSD 1.78 Billion
2035 Market SizeUSD 4.12 Billion
Key Players
Equinor ASA
Principle Power Inc.
BW Ideol
Karpowership
Golar LNG
Moss Maritime
Opportunities
  • Hybrid Wind-Solar-Storage Floating Platforms
  • Floating Nuclear SMR Power Barges for Industrial Hubs
  • Emerging-Market Electrification via Barge-Mounted Gas-to-Power
  1. 1 Market Overview |
    1. 1.1 Study Assumptions & Market Definition |
    2. 1.2 Scope of the Study |
    3. 1.3 Research Methodology
  2. 2 Market Summary & Key Takeaways
  3. 3 Market Dynamics |
    1. 3.1 Market Drivers Analysis | |
      1. 3.1.1 Offshore Wind Policy Mandates & Feed-in Tariffs | |
      2. 3.1.2 Island & Remote Electrification Demand | |
      3. 3.1.3 Declining LCOE for Floating Solar PV | |
      4. 3.1.4 LNG-to-Power Bridge Fuel Strategy | |
      5. 3.1.5 Automation & Digital Twin Integration | |
      6. 3.1.6 Climate Resilience & Disaster-Recovery Power | |
      7. 3.1.7 Floating Nuclear SMR R&D Programs |
    2. 3.2 Market Restraints Analysis | |
      1. 3.2.1 High Upfront Capital Costs & Limited Project Finance | |
      2. 3.2.2 Environmental Permitting & Marine Ecology Concerns | |
      3. 3.2.3 Grid Interconnection Bottlenecks for Offshore Assets | |
      4. 3.2.4 Technology Risk Perception for Novel Hull Designs | |
      5. 3.2.5 Geopolitical Supply-Chain Disruptions |
    3. 3.3 Market Opportunity Analysis | |
      1. 3.3.1 Hybrid Wind-Solar-Storage Floating Platforms | |
      2. 3.3.2 Floating Nuclear SMR Power Barges for Industrial Hubs | |
      3. 3.3.3 Emerging-Market Electrification via Barge-Mounted Gas-to-Power | |
      4. 3.3.4 Data Monetization Through Digital Twin Operations | |
      5. 3.3.5 Disaster-Recovery and Emergency Floating Power |
    4. 3.4 Industry Value Chain Analysis |
    5. 3.5 Porter's Five Forces Analysis
  4. 4 Global Floating Power Plant Market Size & Forecast (2021–2035) |
    1. 4.1 Historical Market Size (2021–2025) |
    2. 4.2 Current & Forecast Market Size (2026–2035) |
    3. 4.3 Market Size by Revenue (USD Billion) |
    4. 4.4 Year-over-Year Growth Analysis
  5. 5 Segmentation Analysis |
    1. 5.1 By Source | |
      1. 5.1.1 Renewable | |
      2. 5.1.2 Non-Renewable |
    2. 5.2 By Geography | |
      1. 5.2.1 North America | |
      2. 5.2.2 Europe | |
      3. 5.2.3 Asia-Pacific | |
      4. 5.2.4 South America | |
      5. 5.2.5 Middle East & Africa
  6. 6 Regional Analysis |
    1. 6.1 North America | |
      1. 6.1.1 United States | |
      2. 6.1.2 Canada | |
      3. 6.1.3 Mexico |
    2. 6.2 Europe | |
      1. 6.2.1 Germany | |
      2. 6.2.2 United Kingdom | |
      3. 6.2.3 France | |
      4. 6.2.4 Italy | |
      5. 6.2.5 Spain | |
      6. 6.2.6 Nordic Countries | |
      7. 6.2.7 Russia | |
      8. 6.2.8 Rest of Europe |
    3. 6.3 Asia-Pacific | |
      1. 6.3.1 China | |
      2. 6.3.2 India | |
      3. 6.3.3 Japan | |
      4. 6.3.4 South Korea | |
      5. 6.3.5 ASEAN | |
      6. 6.3.6 Rest of Asia-Pacific |
    4. 6.4 South America | |
      1. 6.4.1 Brazil | |
      2. 6.4.2 Argentina | |
      3. 6.4.3 Rest of South America |
    5. 6.5 Middle East & Africa | |
      1. 6.5.1 Saudi Arabia | |
      2. 6.5.2 UAE | |
      3. 6.5.3 South Africa | |
      4. 6.5.4 Egypt | |
      5. 6.5.5 Rest of MEA
  7. 7 Competitive Landscape |
    1. 7.1 Market Share Analysis (2025) |
    2. 7.2 Competitive Benchmarking Matrix |
    3. 7.3 Company Profiles | |
      1. 7.3.1 Equinor ASA | |
      2. 7.3.2 Principle Power Inc. | |
      3. 7.3.3 BW Ideol (BW Offshore) | |
      4. 7.3.4 Karpowership | |
      5. 7.3.5 Golar LNG | |
      6. 7.3.6 Moss Maritime (Saipem) | |
      7. 7.3.7 Seaborg Technologies | |
      8. 7.3.8 SolarDuck | |
      9. 7.3.9 Seatrium | |
      10. 7.3.10 CORE Power
  8. 8 Future Outlook & Strategic Recommendations (2026–2035) |
    1. 8.1 Autonomous Operations and AI-Driven Asset Management |
    2. 8.2 Platform Economics and Modular Standardization |
    3. 8.3 Electrification Supercycle and Offshore Grid Integration |
    4. 8.4 ESG Reporting and Green Taxonomy Compliance
  9. 9 Recent Developments & News
  10. 10 Frequently Asked Questions (FAQs)
  11. 11 Report Scope & Methodology |
    1. 11.1 Study Period & Base Year |
    2. 11.2 Data Sources & Citations |
    3. 11.3 Abbreviations
  12. 12 LIST OF TABLES |
  13. TABLE 1 Global Floating Power Plant Market Size & Forecast, by Revenue (USD Billion), 2021–2035 |
  14. TABLE 2 Global Floating Power Plant Market – Year-over-Year Growth Analysis, 2021–2035 |
  15. TABLE 3 Global Floating Power Plant Market – Driver Impact Analysis |
  16. TABLE 4 Global Floating Power Plant Market – Restraint Impact Analysis |
  17. TABLE 5 Global Floating Power Plant Market Size, by Source, 2021–2035 |
  18. TABLE 6 Global Floating Power Plant Market Size, by Region, 2021–2035 |
  19. TABLE 7 North America Floating Power Plant Market Size, by Country, 2021–2035 |
  20. TABLE 8 Europe Floating Power Plant Market Size, by Country, 2021–2035 |
  21. TABLE 9 Asia-Pacific Floating Power Plant Market Size, by Country, 2021–2035 |
  22. TABLE 10 South America Floating Power Plant Market Size, by Country, 2021–2035 |
  23. TABLE 11 Middle East & Africa Floating Power Plant Market Size, by Country, 2021–2035 |
  24. TABLE 12 Competitive Benchmarking Matrix – Global Floating Power Plant Market, 2025 |
  25. TABLE 13 Company Profiles – Key Players, Global Floating Power Plant Market |
  26. TABLE 14 Recent Developments & Strategic Announcements, 2023–2025 |
  27. TABLE 15 Report Scope & Methodology Summary |
  28. TABLE 16 Detailed Sources and Citations
  29. 13 LIST OF FIGURES |
  30. FIGURE 1 Global Floating Power Plant Market Dynamics (Drivers, Restraints, Opportunities) |
  31. FIGURE 2 Industry Value Chain Analysis – Floating Power Plant Market |
  32. FIGURE 3 Porter's Five Forces Analysis – Floating Power Plant Market |
  33. FIGURE 4 Global Floating Power Plant Market Size Trend (USD Billion), 2021–2035 |
  34. FIGURE 5 Global Floating Power Plant Market Share, by Source (%), 2025 |
  35. FIGURE 6 Global Floating Power Plant Market Share, by Region (%), 2025 |
  36. FIGURE 7 North America Floating Power Plant Market Share, by Country (%), 2025 |
  37. FIGURE 8 Europe Floating Power Plant Market Share, by Country (%), 2025 |
  38. FIGURE 9 Asia-Pacific Floating Power Plant Market Share, by Country (%), 2025 |
  39. FIGURE 10 South America Floating Power Plant Market Share, by Country (%), 2025 |
  40. FIGURE 11 Middle East & Africa Floating Power Plant Market Share, by Country (%), 2025 |
  41. FIGURE 12 Competitive Landscape – Market Share Analysis, 2025 |
  42. FIGURE 13 Competitive Benchmarking Radar Chart – Top 10 Players

Segmentation Quick Reference

DimensionSub-SegmentsDominant SegmentFastest Growing Segment
By SourceRenewable, Non-RenewableRenewable (~62% share, 2025)Renewable (floating solar PV sub-category at 11.3% CAGR)
By GeographyNorth America, Europe, Asia-Pacific, South America, Middle East & AfricaEurope (~38% share, 2025)Asia-Pacific (10.2% CAGR)


Market Segmentation Overview

By Source

Sub-SegmentKey Trend
RenewableFloating offshore wind scale-up in Europe; floating solar PV power plant expansion across Asian reservoirs; hybrid wind-solar-storage platform pilots
Non-RenewableFloating LNG power plant FSRP fleet growth in Sub-Saharan Africa; barge-mounted floating power plant diesel-to-gas conversions; transitional bridge-fuel demand in island nations


The source segmentation reflects the energy transition's core tension: governments want clean power (driving the renewable segment) while simultaneously needing rapid electrification solutions that only gas-fired or diesel-fired floating platforms can deliver in the near term. Renewable floating power is winning on policy alignment and cost trajectory, while non-renewable floating generation retains a structural role in under-electrified markets.

By Geography

Sub-SegmentKey Trend
North AmericaDOE-backed floating wind demonstrations; disaster-recovery modular floating power unit procurement
EuropeLargest installed base of floating offshore wind; regulatory certainty via EU Taxonomy and national offshore wind targets
Asia-PacificFastest growth from floating solar PV, island electrification, and industrial floating power demand
South AmericaGas-to-power monetization of offshore reserves; reservoir-based floating solar pilots
Middle East & AfricaEmergency floating power procurement; NEOM-linked clean energy mega-projects; Sub-Saharan FPSO floating power generation vessel operations


Geographic segmentation captures varying stages of floating power maturity. Europe and North America represent technology-push markets where policy and R&D lead deployment, while Asia-Pacific, South America, and MEA are demand-pull markets where electrification gaps and stranded energy resources create immediate commercial opportunities for the Floating Power Plant Market.


Download PDF ×

We do not share your information with anyone. However, we may send you emails based on your report interest from time to time. You may contact us at any time to opt-out.