Flight Inspection Market (2026 - 2035)

ID: MRFR/AD/8667-HCR 168 Pages Abbas Raut Last Updated: October 27, 2026
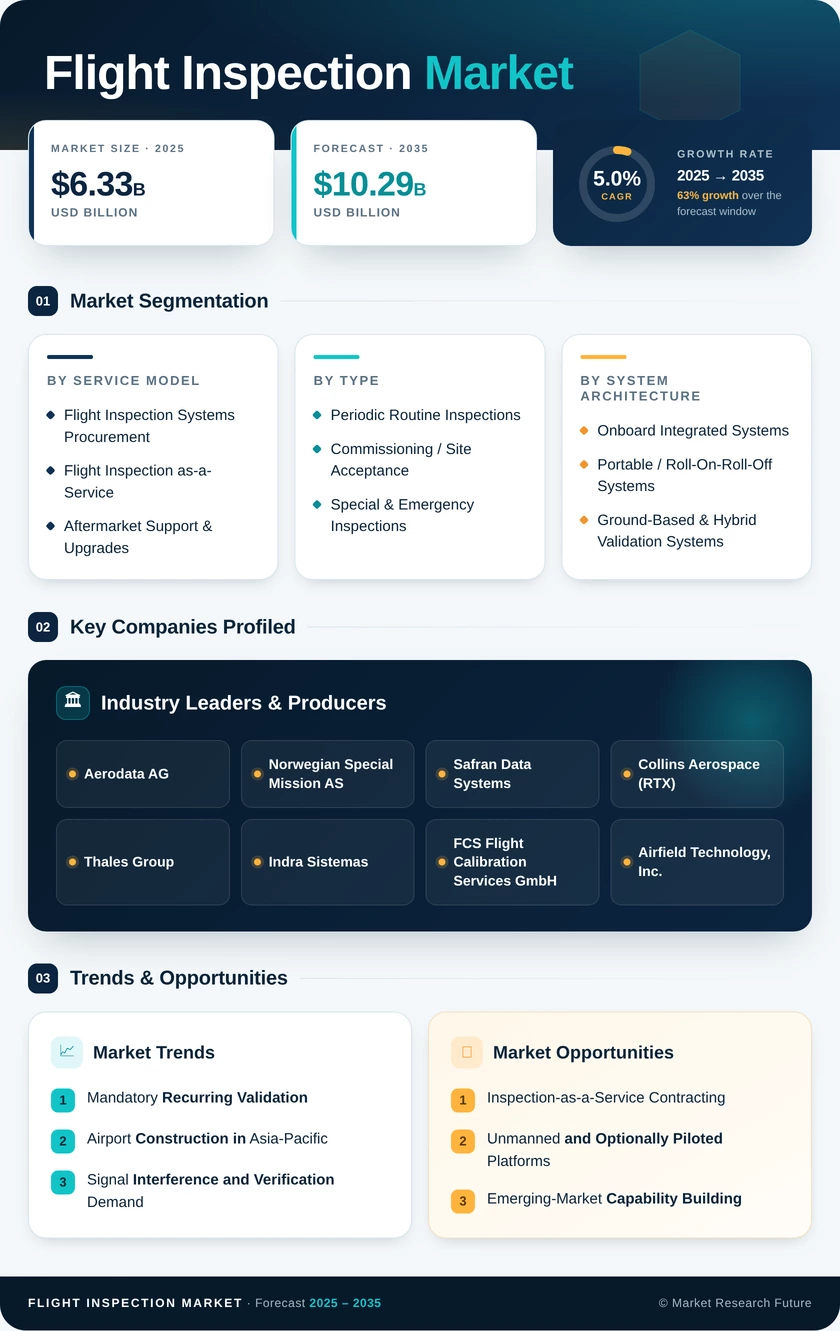
Flight Inspection Market Size, Share, Industry Trend & Analysis Research Report Information By Service Model (Flight Inspection Systems Procurement, Flight Inspection as-a-Service, Aftermarket Support & Upgrades), By Platform Type (Fixed-Wing Aircraft, Rotary-Wing Aircraft, Unmanned / Remotely Piloted Platforms), By System Architecture (Onboard Integrated Systems, Portable / Roll-On-Roll-Off Systems, Ground-Based & Hybrid Validation Systems), By Inspection Type (Periodic Routine Inspections, Commissioning / Site Acceptance, Special & Emergency Inspections), By End User (Air Navigation Service Providers, Military & Defense Aviation, Airport Operators, Private & Business Aviation), By Geography (North America, Europe, Asia-Pacific, South America, Middle East & Africa) – Forecast Till 2035
Flight Inspection Market
Market Size
Forecast Period2026-2035
CAGR (2026-2035)5.00%
2025 Market SizeUSD 6.33 Billion
2035 Market SizeUSD 10.29 Billion
Key Players
Aerodata AG
Norwegian Special Mission AS
Safran Data Systems
Collins Aerospace
Thales Group
Indra Sistemas
Opportunities
  • Inspection-as-a-Service Contracting
  • Unmanned and Optionally Piloted Platforms
  • Emerging-Market Capability Building
  1. 1 Market Overview |
    1. 1.1 Study Assumptions & Market Definition |
    2. 1.2 Scope of the Study |
    3. 1.3 Research Methodology
  2. 2 Market Summary & Key Report Takeaways |
    1. 2.1 By Technology and Platform |
    2. 2.2 By Service Model and End User |
    3. 2.3 By Geography
  3. 3 Global Market Size & Forecast (2021–2035) |
    1. 3.1 Historical Market Size (2021–2024) |
    2. 3.2 Base Year Estimate (2025) |
    3. 3.3 Forecast Market Size (2026–2035) |
    4. 3.4 Year-over-Year Growth Analysis
  4. 4 Market Drivers Analysis |
    1. 4.1 Mandatory Recurring Validation |
    2. 4.2 Airport Construction in Asia-Pacific |
    3. 4.3 Signal Interference and Verification Demand |
    4. 4.4 Fleet Recapitalisation
  5. 5 Market Restraints Analysis |
    1. 5.1 Capital Barriers to Entry |
    2. 5.2 Specialist Workforce Scarcity |
    3. 5.3 Navaid Rationalisation
  6. 6 Market Opportunity Analysis |
    1. 6.1 Inspection-as-a-Service Contracting |
    2. 6.2 Unmanned and Optionally Piloted Platforms |
    3. 6.3 Emerging-Market Capability Building |
    4. 6.4 Data Monetisation and Analytics Subscriptions |
    5. 6.5 Interference Resilience Services |
    6. 6.6 Industry Value Chain Analysis |
    7. 6.7 Porter's Five Forces Analysis
  7. 7 Regional Market Share & Country-Level Analysis |
    1. 7.1 North America | |
      1. 7.1.1 US | |
      2. 7.1.2 Canada | |
      3. 7.1.3 Mexico |
    2. 7.2 Europe | |
      1. 7.2.1 Germany | |
      2. 7.2.2 UK | |
      3. 7.2.3 France | |
      4. 7.2.4 Italy | |
      5. 7.2.5 Spain | |
      6. 7.2.6 Nordic Countries | |
      7. 7.2.7 Russia | |
      8. 7.2.8 Rest of Europe |
    3. 7.3 Asia-Pacific | |
      1. 7.3.1 China | |
      2. 7.3.2 India | |
      3. 7.3.3 Japan | |
      4. 7.3.4 South Korea | |
      5. 7.3.5 ASEAN | |
      6. 7.3.6 Rest of Asia-Pacific |
    4. 7.4 South America | |
      1. 7.4.1 Brazil | |
      2. 7.4.2 Argentina | |
      3. 7.4.3 Rest of South America |
    5. 7.5 Middle East & Africa | |
      1. 7.5.1 Saudi Arabia | |
      2. 7.5.2 UAE | |
      3. 7.5.3 South Africa | |
      4. 7.5.4 Egypt | |
      5. 7.5.5 Rest of Middle East & Africa
  8. 8 Future Outlook (2026–2035) |
    1. 8.1 Automation and Machine-Assisted Analysis |
    2. 8.2 Platform Economics and Asset Sharing |
    3. 8.3 Resilience as a Design Requirement |
    4. 8.4 Sustainability and Fleet Transition
  9. 9 Market Segmentation Analysis |
    1. 9.1 By Service Model | |
      1. 9.1.1 Flight Inspection Systems Procurement | |
      2. 9.1.2 Flight Inspection as-a-Service | |
      3. 9.1.3 Aftermarket Support & Upgrades |
    2. 9.2 By Platform Type | |
      1. 9.2.1 Fixed-Wing Aircraft | |
      2. 9.2.2 Rotary-Wing Aircraft | |
      3. 9.2.3 Unmanned / Remotely Piloted Platforms |
    3. 9.3 By System Architecture | |
      1. 9.3.1 Onboard Integrated Systems | |
      2. 9.3.2 Portable / Roll-On-Roll-Off Systems | |
      3. 9.3.3 Ground-Based & Hybrid Validation Systems |
    4. 9.4 By Inspection Type | |
      1. 9.4.1 Periodic Routine Inspections | |
      2. 9.4.2 Commissioning / Site Acceptance | |
      3. 9.4.3 Special & Emergency Inspections |
    5. 9.5 By End User | |
      1. 9.5.1 Air Navigation Service Providers | |
      2. 9.5.2 Military & Defense Aviation | |
      3. 9.5.3 Airport Operators | |
      4. 9.5.4 Private & Business Aviation
  10. 10 Competitive Landscape |
    1. 10.1 Market Concentration Analysis (2026) |
    2. 10.2 Competitive Benchmarking Matrix |
    3. 10.3 Company Profiles | |
      1. 10.3.1 Aerodata AG | |
      2. 10.3.2 Norwegian Special Mission AS | |
      3. 10.3.3 Safran Data Systems | |
      4. 10.3.4 Collins Aerospace (RTX) | |
      5. 10.3.5 Thales Group | |
      6. 10.3.6 Indra Sistemas | |
      7. 10.3.7 FCS Flight Calibration Services GmbH | |
      8. 10.3.8 Airfield Technology, Inc. | |
      9. 10.3.9 Textron Aviation | |
      10. 10.3.10 Leonardo S.p.A. | |
      11. 10.3.11 Bombardier Defense
  11. 11 Recent News & Developments (2023–2025)
  12. 12 Report Scope & Methodology |
    1. 12.1 Study Period & Base Year |
    2. 12.2 Data Sources & Estimation Approach |
    3. 12.3 Abbreviations
  13. 13 Detailed Sources & Citations
  14. 14 Frequently Asked Questions
  15. 15 LIST OF TABLES |
  16. TABLE 1 Global Flight Inspection Market Size & Forecast, by Revenue (USD Billion), 2021–2035 |
  17. TABLE 2 Global Flight Inspection Market — Year-over-Year Growth Analysis, 2021–2035 |
  18. TABLE 3 Driver Impact Analysis Matrix, 2026–2035 |
  19. TABLE 4 Restraint Impact Analysis Matrix, 2026–2035 |
  20. TABLE 5 Global Market Size, by Region (USD Billion / Share), 2021–2035 |
  21. TABLE 6 North America Market Size, by Country, 2021–2035 (USD Billion) |
  22. TABLE 7 Europe Market Size, by Country, 2021–2035 (USD Billion) |
  23. TABLE 8 Asia-Pacific Market Size, by Country, 2021–2035 (USD Billion) |
  24. TABLE 9 South America Market Size, by Country, 2021–2035 (USD Billion) |
  25. TABLE 10 Middle East & Africa Market Size, by Country, 2021–2035 (USD Billion) |
  26. TABLE 11 Global Market Size, by Service Model, 2021–2035 (USD Billion) |
  27. TABLE 12 Global Market Size, by Platform Type, 2021–2035 (USD Billion) |
  28. TABLE 13 Global Market Size, by System Architecture, 2021–2035 (USD Billion) |
  29. TABLE 14 Global Market Size, by Inspection Type, 2021–2035 (USD Billion) |
  30. TABLE 15 Global Market Size, by End User, 2021–2035 (USD Billion) |
  31. TABLE 16 North America Market Size, by Service Model and End User, 2021–2035 (USD Billion) |
  32. TABLE 17 Europe Market Size, by Service Model and End User, 2021–2035 (USD Billion) |
  33. TABLE 18 Asia-Pacific Market Size, by Service Model and End User, 2021–2035 (USD Billion) |
  34. TABLE 19 South America Market Size, by Service Model and End User, 2021–2035 (USD Billion) |
  35. TABLE 20 Middle East & Africa Market Size, by Service Model and End User, 2021–2035 (USD Billion) |
  36. TABLE 21 Competitive Benchmarking Matrix, 2026 |
  37. TABLE 22 Company Profiles — Key Players |
  38. TABLE 23 Recent Developments & Strategic Announcements, 2023–2025 |
  39. TABLE 24 Report Scope & Methodology Summary |
  40. TABLE 25 Detailed Sources & Citations Index
  41. 16 LIST OF FIGURES |
  42. FIGURE 1 Market Dynamics — Drivers, Restraints, and Opportunities |
  43. FIGURE 2 Industry Value Chain Analysis |
  44. FIGURE 3 Porter's Five Forces Assessment |
  45. FIGURE 4 Global Market Size Trend, 2021–2035 (USD Billion) |
  46. FIGURE 5 Year-over-Year Growth Curve, 2022–2035 |
  47. FIGURE 6 Segment Share by Service Model, 2025 vs 2035 |
  48. FIGURE 7 Segment Share by Platform Type, 2025 vs 2035 |
  49. FIGURE 8 Segment Share by System Architecture, 2025 |
  50. FIGURE 9 Segment Share by Inspection Type, 2025 vs 2035 |
  51. FIGURE 10 Segment Share by End User, 2025 |
  52. FIGURE 11 Regional Revenue Share, 2025 |
  53. FIGURE 12 Regional CAGR Comparison, 2026–2035 |
  54. FIGURE 13 Country-Level Revenue Heat Map, 2025 |
  55. FIGURE 14 Competitive Landscape — Revenue Share Bands, 2026 |
  56. FIGURE 15 Strategic Positioning Matrix — Capability vs Geographic Reach

Segmentation Quick Reference

DimensionSub-SegmentsDominant SegmentFastest Growing Segment
By Service ModelFlight Inspection Systems Procurement; Flight Inspection as-a-Service; Aftermarket Support & UpgradesFlight Inspection Systems ProcurementFlight Inspection as-a-Service
By Platform TypeFixed-Wing Aircraft; Rotary-Wing Aircraft; Unmanned / Remotely Piloted PlatformsFixed-Wing AircraftRotary-Wing Aircraft
By System ArchitectureOnboard Integrated Systems; Portable / Roll-On-Roll-Off Systems; Ground-Based & Hybrid Validation SystemsOnboard Integrated SystemsPortable / Roll-On-Roll-Off Systems
By Inspection TypePeriodic Routine Inspections; Commissioning / Site Acceptance; Special & Emergency InspectionsPeriodic Routine InspectionsSpecial & Emergency Inspections
By End UserAir Navigation Service Providers; Military & Defense Aviation; Airport Operators; Private & Business AviationAir Navigation Service ProvidersPrivate & Business Aviation
By GeographyNorth America; Europe; Asia-Pacific; South America; Middle East & AfricaNorth AmericaAsia-Pacific


Market Segmentation Overview

By Service Model

Sub-SegmentKey Trend
Flight Inspection Systems ProcurementStates retain sovereign capability; bundled airframe-plus-system awards dominate tender activity
Flight Inspection as-a-ServiceMulti-year guaranteed-hour contracts replace capital purchases for low-utilisation buyers
Aftermarket Support & UpgradesSoftware-defined receiver retrofits extend console life beyond original 12-year assumptions


Procurement remains the revenue anchor, but the centre of gravity is shifting. Contracted capacity converts a lumpy capital decision into predictable operating expenditure, which suits states running fewer than a few hundred annual mission hours and unlocks demand that ownership economics would otherwise strand.

By Platform Type

Sub-SegmentKey Trend
Fixed-Wing AircraftTurboprop conversions displace older jets on fuel and lifecycle cost grounds
Rotary-Wing AircraftHeliport, offshore, and mountainous approach validation drives above-average growth
Unmanned / Remotely Piloted PlatformsRegulatory pilots underway for obstacle and low-altitude survey tasks


Mission physics keeps fixed-wing platforms dominant, since stable long-baseline approach profiles are difficult to replicate otherwise. Growth, though, is concentrating in rotary and unmanned categories where cost per data point is falling fastest.

By System Architecture

Sub-SegmentKey Trend
Onboard Integrated SystemsPermanent certified installations retain preference among high-utilisation operators
Portable / Roll-On-Roll-Off SystemsRapid-fit consoles let operators surge capacity without dedicating an airframe
Ground-Based & Hybrid Validation SystemsPre-flight screening reduces unnecessary sorties and lowers total programme cost


Architecture choice increasingly follows utilisation rather than technical preference. Operators with fluctuating workloads favour roll-on consoles that convert a transport aircraft into a mission platform in hours.

By Inspection Type

Sub-SegmentKey Trend
Periodic Routine InspectionsRegulatory periodicity delivers recession-resistant recurring revenue
Commissioning / Site AcceptanceNew runway and navaid activation cycles concentrate demand geographically
Special & Emergency InspectionsInterference events and post-incident verification drive unscheduled sortie growth


Routine validation gives the segment its defensive quality. The growth story sits in special and emergency work, where improved interference reporting is turning previously exceptional flights into budgeted activity.

By End User

Sub-SegmentKey Trend
Air Navigation Service ProvidersStatutory obligations sustain baseline demand irrespective of traffic cycles
Military & Defense AviationAirfield modernisation and deployable capability requirements lift procurement
Airport OperatorsCapacity projects and runway reconfiguration generate commissioning workload
Private & Business AviationBespoke procedure design at secondary fields expands the addressable base


Air navigation service providers will remain the structural core through 2035. The most interesting incremental demand comes from business aviation operators funding all-weather access to fields that commercial carriers never serve.




Download PDF ×

We do not share your information with anyone. However, we may send you emails based on your report interest from time to time. You may contact us at any time to opt-out.