• Cat-intel
  • MedIntelliX
  • Resources
  • About Us
  • Hero Background
    English
    Chinese
    French
    Japanese
    Korean
    German
    Spanish

    Ferric Oxide Market Analysis

    ID: MRFR/CnM/6616-CR
    116 Pages
    Priya Nagrale
    July 2019

    Ferric Oxide Market Research Report Information by Application (Steel Production, Pigments, Radiation Shielding, Ballast, Jewelry and others) and Region (Europe, Asia-Pacific, North America, Latin America and Middle East & Africa) - Forecast till 2035

    Share:
    Download PDF ×

    We do not share your information with anyone. However, we may send you emails based on your report interest from time to time. You may contact us at any time to opt-out.

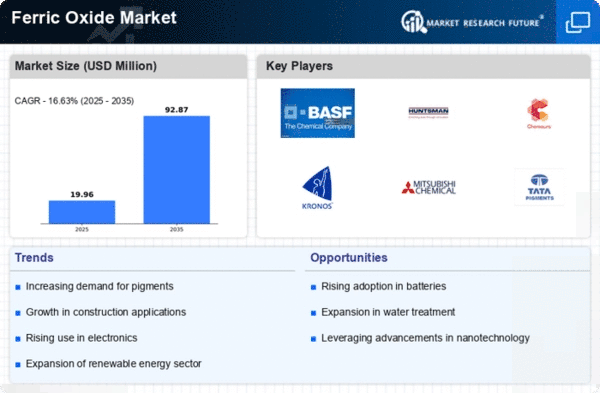
    Ferric Oxide Market Infographic
    $ 4,950.0
    $ 5,950.0
    $ 7,250.0

    Market Analysis

    In-depth Analysis of Ferric Oxide Market Industry Landscape

    Ferric oxide market, or ferrous oxide, is one of the industry segments that leads the market, expecting a dynamic market environment influenced by the changing conditions. Ferric oxide is also a key base-forming material which helps in various sectors such as construction, paint and coatings, plastics and electronics. A prominent contributing factor in this market dynamics is the building industry, where ferric oxide is used as a primary pigment for coloring Concrete, asphalt and many of the other construction must be. The worldwide development of installations, especially in developing countries, creates commensurate demand for ferric oxide that eventually affects somewhat trends of the market.

    In the paint and coatings sector, ferric oxide features as a vital pigment that offers enduring colors with strong color fastness. Together, the increased consumer preference for valuable results surfaces and the evolving auto sector support an upsurge in the demand for ferric oxide in paints and coatings. Besides, ferrous oxide also serves as a color additive in the plastic industry with products ranging from plastic containers to polypropylene used for fitting furniture and much more. While ferric oxide provides plastic color challenges, which present different tones to consumers, it opens up the market opportunity, implying a shift in consumers’ wants.

    Sectorial circulation is also affected by the recent boom in the technology, and the electronics industry. Ferric oxide has magnetic and electric properties which is helpful. Because of this feature it is used in devices and medical applications for electronic and medicine respectively. The continuous technological development and the supply for quite fast electronic components enhance the divisions of the involved ferrous oxide industry in this section. This technology change brings network of complexity among the market patterns due to the extensive research and development works pursued for freshly discovered techniques and to establish the enhanced material.

    The market dynamics are geographically to some extent depended on the extent of economic activities occurring, the development of infrastructure, and industrialization rate of the region. Tending to be the driving force of the industrial, rapid urbanization and the industrialization in the developing economies frequently seems to induce the increase in ferroxide demand. On the contrary, the current Mature markets that are commonly referred to the major construction and manufacturing sectors continue being the source of steady demand for ferric oxide. It is noteworthy that international trade is a factor that brings together the regional aspects and fosters their interaction, making a multi-faceted relation among fluctuating supply and demand powers.

    Another element appears to be environmental factors that are of significance in determining how the market of ferric oxide is or will be. The lifelong consciousness for sustainable practices is reflected by industries and implies on the procedures to use environmentally friendly materials. Iron oxide plants are adapting to this shift by implementing the environmentally friendly production processes and finding the sustainable material supply to be in harmony with global trends towards the future which is more green.

    Market Summary

    The global ferric oxide market is projected to grow from 1.86 USD billion in 2024 to 3.08 USD billion by 2035, reflecting a robust growth trajectory.

    Key Market Trends & Highlights

    Ferric Oxide Key Trends and Highlights

    • The market is expected to achieve a compound annual growth rate (CAGR) of 4.69 percent from 2025 to 2035.
    • By 2035, the market valuation is anticipated to reach 3.08 USD billion, indicating substantial growth opportunities.
    • In 2024, the market is valued at 1.86 USD billion, laying a solid foundation for future expansion.
    • Growing adoption of ferric oxide in various applications due to increasing demand for pigments is a major market driver.

    Market Size & Forecast

    2024 Market Size 1.86 (USD Million)
    2035 Market Size 3.08 (USD Million)
    CAGR (2025-2035) 4.69%
    Largest Regional Market Share in 2024 latin_america)

    Major Players

    Karara Mining Ltd (Australia), Western Australia Iron Ore (BHP) (Australia), Labrador Iron Mines (Canada), Carajás Mine (Vale) (Brazil), Cleveland-Cliffs Inc (US), SIMEC (Australia), Fortescue Metals Group Ltd (Australia), Applied Minerals Inc (US), Shree Minerals Ltd (Australia), Atlas Iron Pty Ltd (Australia)

    Market Trends

    The demand for ferric oxide is anticipated to grow steadily, driven by its diverse applications in industries such as construction, electronics, and pigments, reflecting a broader trend towards sustainable materials.

    U.S. Geological Survey

    Ferric Oxide Market Market Drivers

    Market Trends and Projections

    Growing Demand in Construction Sector

    The Global Ferric Oxide Market Industry is experiencing a notable surge in demand driven by the construction sector. Ferric oxide is extensively utilized in cement and concrete applications, where it serves as a pigment and enhances durability. In 2024, the market is projected to reach 1.86 USD Billion, reflecting the increasing investments in infrastructure development worldwide. Countries such as India and China are ramping up construction activities, which further propels the demand for ferric oxide. This trend indicates a robust growth trajectory, as the construction sector is expected to remain a primary consumer of ferric oxide, contributing significantly to the overall market expansion.

    Technological Advancements in Production

    Innovations in production technologies are poised to drive the Global Ferric Oxide Market Industry forward. Enhanced manufacturing processes, such as the development of more efficient synthesis methods, are likely to reduce costs and improve product quality. These advancements may lead to increased production capacities and a wider range of ferric oxide products tailored for specific applications. As companies adopt these technologies, the market could witness a shift towards higher purity and specialty ferric oxides, catering to niche markets. This trend may contribute to the overall growth of the industry, aligning with the projected CAGR of 4.69% from 2025 to 2035.

    Rising Applications in Paints and Coatings

    The Global Ferric Oxide Market Industry is significantly influenced by its applications in the paints and coatings sector. Ferric oxide pigments are favored for their excellent color stability and UV resistance, making them ideal for various coatings. As the global demand for high-quality paints increases, particularly in automotive and industrial applications, the market for ferric oxide is likely to expand. The anticipated growth in the paints and coatings industry suggests a favorable environment for ferric oxide, with projections indicating a market value of 3.08 USD Billion by 2035. This growth is indicative of the material's versatility and essential role in enhancing product performance.

    Market Diversification and Global Expansion

    The Global Ferric Oxide Market Industry is witnessing diversification as manufacturers explore new geographical markets and applications. Emerging economies in Asia-Pacific and Latin America are becoming focal points for expansion, driven by industrialization and urbanization. This diversification is likely to create new opportunities for ferric oxide producers, as they adapt their offerings to meet regional demands. The growth in these markets could significantly contribute to the industry's overall expansion, aligning with the projected market value of 3.08 USD Billion by 2035. As companies navigate these new landscapes, the potential for increased sales and market penetration appears promising.

    Environmental Regulations Favoring Natural Pigments

    The Global Ferric Oxide Market Industry is benefiting from stringent environmental regulations that favor the use of natural pigments over synthetic alternatives. Ferric oxide, being a naturally occurring mineral, aligns with the growing consumer preference for eco-friendly products. As industries strive to comply with environmental standards, the demand for ferric oxide is expected to rise, particularly in sectors such as cosmetics and food. This shift towards sustainable practices could enhance the market's growth prospects, as manufacturers increasingly seek to incorporate ferric oxide into their formulations, thereby expanding its applications and market reach.

    Market Segment Insights

    Regional Insights

    Industry Developments

    Here is the list of the few recent developments in the market:

      •     In April 2019, the mining capacity of the Bridge Magnetite project in Australia was announced and is now expected to produce more than 22 million tons of iron ore magnetite by the end of 2022.
      •     Various laws have been passed recently to regulate the mining of iron ores.
      •     Iron oxide nanoparticles that include magnetite (Fe3O4) and maghemite (γ-Fe2O3) have been introduced, which possess minimum toxicity and low cost.
      •     Chemically inert materials referred to as Superparamagnetic iron oxides have been introduced in the market recently.
      •     Innovations have been made where ferric oxide is being used therapeutically to create deadly diseases like cancer.

    Future Outlook

    Ferric Oxide Market Future Outlook

    The Global Ferric Oxide Market is projected to grow at a 4.69% CAGR from 2024 to 2035, driven by increasing demand in construction, automotive, and electronics sectors.

    New opportunities lie in:

    • Develop eco-friendly ferric oxide production methods to meet sustainability goals.
    • Expand applications in advanced coatings and pigments for high-performance industries.
    • Leverage emerging markets in Asia-Pacific for strategic partnerships and distribution.

    By 2035, the Ferric Oxide Market is expected to exhibit robust growth, reflecting evolving industrial needs and technological advancements.

    Market Segmentation

    Report Scope

    Report Attribute/Metric Details
      Market Size   2030: USD 2,414.382.9 Million
      CAGR 4.99% (2022-2030) 
      Base Year   2021
      Forecast Period   2022 to 2030
      Historical Data   2019 & 2020
      Forecast Units   Value (USD Million)
      Report Coverage   Revenue Forecast, Competitive Landscape, Growth Factors, and Trends
      Segments Covered   Europe, North America, South America, Asia-Pacific, The Middle East and Africa
      Geographies Covered   North America, Europe, Asia-Pacific, and Rest of the World (RoW)
      Key Vendors   Karara Mining Ltd (Australia), Western Australia Iron Ore (BHP) (Australia), Labrador Iron Mines (Canada), Carajás Mine (Vale) (Brazil), Cleveland-Cliffs Inc (US), SIMEC (Australia, Fortescue Metals Group Ltd (Australia), Applied Minerals Inc (US), Shree Minerals Ltd (Australia) and Atlas Iron Pty Ltd (Australia)
      Key Market Opportunities   The primary areas of application are in end-user industries
      Key Market Drivers   The growing demands for adopting steel in all major areas of applications.

    Market Highlights

    Author

    Priya Nagrale
    Senior Research Analyst

    She holds an experience of about 6+ years in market research and business consulting, working under the spectrum of information communication technology, telecommunications and semiconductor domains. aarti conceptualizes and implements a scalable business strategy and provides strategic leadership to the clients. her expertise lies in market estimation, competitive intelligence, pipeline analysis, customer assessment, etc.

    Leave a Comment

    Latest Comments

    John Doe
    john@example.com

    This is a great article! Really helped me understand the topic better.

    Posted on July 23, 2025, 10:15 AM
    Jane Smith
    jane@domain.com

    Thanks for sharing this. I’ve bookmarked it for later reference.

    Posted on July 22, 2025, 7:45 PM

    FAQs

    At what CAGR is the Ferric Oxide Market predicted to grow during the forecast period?

    Ferric Oxide Market is predicted to grow at 4.99% through forecast period of 2025-2035.

    What is the forecast period of Ferric Oxide Market research report?

    The forecast period for Ferric Oxide Market research report is 2025-2035.

    Who are the key players in the Ferric Oxide Market?

    Karara Mining Ltd (Australia), Western Australia Iron Ore (BHP) (Australia), Labrador Iron Mines (Canada), Carajás Mine (Vale) (Brazil), Cleveland-Cliffs Inc (US), SIMEC (Australia, Fortescue Metals Group Ltd (Australia), Applied Minerals Inc (US), Shree Minerals Ltd (Australia) and Atlas Iron Pty Ltd (Australia)

    What are the key factors driving the Ferric Oxide Market

    The growing demands for adopting steel in all major areas of applications.

    Which region will lead the global Ferric Oxide Market?

    Global Ferric Oxide Market is dominated by APAC region.

    1. Executive Summary
    2. Market Introduction
      1. Scope of the Study 16
      2. Market Structure 16
    3. Market Insights
    4. Research Methodology
      1. Research Process 20
      2. Primary Research 21
      3. Secondary Research 22
      4. Market Size Estimation 23
      5. Forecast Model 23
      6. List Of Assumptions 24
    5. Market Dynamics
      1. Introduction 25
      2. Drivers 26
        1. Increasing Demand For Ferric Oxide In Steel Production 26
        2. Growing Use Of Iron Oxide Pigments 26
      3. Restraint 28
        1. Stringent Regulations Pertaining To Mining Activities 28
      4. Opportunity 29
        1. Use Of Iron Oxide Nanoparticles In Wastewater Treatment 29
      5. Challenges 30
        1. Declining Steel Production 30
    6. Market Factor Analysis
      1. Supply/Value Chain Analysis 31
        1. Raw Materials 31
        2. Ferric Oxide Producers 32
        3. Distribution Channel 32
        4. Applications 32
      2. Porter’s Five Forces Model 33
        1. Threat Of New Entrants 33
        2. Intensity Of Rivalry 34
        3. Threat Of Substitutes 34
        4. Bargaining Power Of Suppliers 34
        5. Bargaining Power Of Buyers 34
    7. Global Ferric Oxide Market, By Application
      1. Introduction 35
      2. Steel Production 37
      3. Pigments 39
      4. Radiation Shielding 40
      5. Ballast 41
      6. Jewelry 42
      7. Others 43
    8. Global Ferric Oxide Market, By Region
      1. Introduction 45
      2. North America 49
        1. US 50
        2. Canada 52
      3. Europe 53
        1. Germany 55
        2. France 56
        3. UK 57
        4. Italy 58
        5. Russia 59
        6. Spain 60
        7. The Netherlands 61
        8. Belgium 62
        9. Poland 63
        10. Rest Of Europe 64
      4. Asia-Pacific 66
        1. China 68
        2. Japan 69
        3. India 70
        4. South Korea 71
        5. Australia And New Zealand 72
        6. Thailand 73
        7. Malaysia 74
        8. Indonesia 75
        9. Rest Of Asia-Pacific 76
      5. Latin America 78
        1. Mexico 80
        2. Brazil 81
        3. Argentina 82
        4. Rest Of Latin America 83
      6. Middle East & Africa 84
        1. Turkey 86
        2. UAE 87
        3. Saudi Arabia 88
        4. Israel 89
        5. North Africa 90
        6. Rest Of Middle East & Africa 91
    9. Competitive Landscape
      1. Introduction 92
      2. Market Strategy Analysis 92
    10. Company Profiles
      1. Western Australia Iron Ore (BHP) 94
        1. Company Overview 94
        2. Financial Overview 95
        3. Products Offering 95
        4. Key Developments 96
        5. SWOT Analysis 96
        6. Key Strategies 96
      2. Carajás Mine (Vale) 97
        1. Company Overview 97
        2. Financial Overview 97
        3. Products Offering 97
        4. Key Developments 98
        5. SWOT Analysis 98
        6. Key Strategies 98
      3. SIMEC 99
        1. Company Overview 99
        2. Financial Overview 99
        3. Products Offering 99
        4. Key Developments 99
        5. SWOT Analysis 100
        6. Key Strategies 100
      4. Fortescue Metals Group Ltd 101
        1. Company Overview 101
        2. Products Offering 101
        3. Key Developments 102
        4. SWOT Analysis 102
        5. Key Strategies 102
      5. Shree Minerals Ltd 103
        1. Company Overview 103
        2. Financial Overview 103
        3. Products Offering 103
        4. Key Developments 103
        5. SWOT Analysis 104
        6. Key Strategies 104
      6. Applied Minerals Inc 105
        1. Company Overview 105
        2. Financial Overview 105
        3. Products Offering 105
        4. Key Developments 105
        5. SWOT Analysis 106
        6. Key Strategies 106
      7. Atlas Iron Pty Ltd 107
        1. Company Overview 107
        2. Financial Overview 107
        3. Products Offering 107
        4. Key Developments 107
        5. SWOT Analysis 108
        6. Key Strategies 108
      8. Cleveland-Cliffs Inc 109
        1. Company Overview 109
        2. Financial Overview 109
        3. Products Offering 109
        4. Key Developments 109
        5. SWOT Analysis 110
        6. Key Strategies 110
      9. Labrador Iron Mines 111
        1. Company Overview 111
        2. Financial Overview 111
        3. Products Offering 111
        4. Key Developments 111
        5. SWOT Analysis 112
        6. Key Strategies 112
      10. Karara Mining Ltd 113
        1. Company Overview 113
        2. Financial Overview 113
        3. Products Offering 113
        4. Key Developments 113
        5. SWOT Analysis 114
        6. Key Strategies 114
    11. Conclusion
      1. Key Findings 115
    12. List of Tables and Figures
      1. 12 List Of Tables
      2. TABLE 1 MARKET SYNOPSIS 15
      3. TABLE 2 LIST OF ASSUMPTIONS 24
      4. TABLE 3 GLOBAL FERRIC OXIDE MARKET, BY APPLICATION, 2020‒2027 (USD MILLION) 36
      5. TABLE 4 GLOBAL FERRIC OXIDE MARKET, BY APPLICATION, 2020‒2027 (KILO TONS) 37
      6. TABLE 5 STEEL PRODUCTION: GLOBAL FERRIC OXIDE MARKET, BY REGION, 2020‒2027 (USD MILLION) 38
      7. TABLE 6 STEEL PRODUCTION: GLOBAL FERRIC OXIDE MARKET, BY REGION, 2020‒2027 (KILO TONS) 38
      8. TABLE 7 PIGMENTS: GLOBAL FERRIC OXIDE MARKET, BY REGION, 2020‒2027 (USD MILLION) 39
      9. TABLE 8 PIGMENTS: GLOBAL FERRIC OXIDE MARKET, BY REGION, 2020‒2027 (KILO TONS) 39
      10. TABLE 9 RADIATION SHIELDING: GLOBAL FERRIC OXIDE MARKET, BY REGION, 2020‒2027 (USD MILLION) 40
      11. TABLE 10 RADIATION SHIELDING: GLOBAL FERRIC OXIDE MARKET, BY REGION, 2020‒2027 (KILO TONS) 40
      12. TABLE 11 BALLAST: GLOBAL FERRIC OXIDE MARKET, BY REGION, 2020‒2027 (USD MILLION) 41
      13. TABLE 12 BALLAST: GLOBAL FERRIC OXIDE MARKET, BY REGION, 2020‒2027 (KILO TONS) 41
      14. TABLE 13 JEWELRY: GLOBAL FERRIC OXIDE MARKET, BY REGION, 2020‒2027 (USD MILLION) 42
      15. TABLE 14 JEWELRY: GLOBAL FERRIC OXIDE MARKET, BY REGION, 2020‒2027 (KILO TONS) 42
      16. TABLE 15 OTHERS: GLOBAL FERRIC OXIDE MARKET, BY REGION, 2020‒2027 (USD MILLION) 43
      17. TABLE 16 OTHERS: GLOBAL FERRIC OXIDE MARKET, BY REGION, 2020‒2027 (KILO TONS) 44
      18. TABLE 17 GLOBAL FERRIC OXIDE MARKET, BY REGION, 2020‒2027 (USD MILLION) 46
      19. TABLE 18 GLOBAL FERRIC OXIDE MARKET, BY REGION, 2020‒2027 (KILO TONS) 47
      20. TABLE 19 GLOBAL FERRIC OXIDE MARKET, BY APPLICATION, 2020‒2027 (USD MILLION) 47
      21. TABLE 20 GLOBAL FERRIC OXIDE MARKET, BY APPLICATION, 2020‒2027 (KILO TONS) 48
      22. TABLE 21 NORTH AMERICA: FERRIC OXIDE MARKET, BY COUNTRY, 2020‒2027 (USD MILLION) 49
      23. TABLE 22 NORTH AMERICA: FERRIC OXIDE MARKET, BY COUNTRY, 2020‒2027 (KILO TONS) 49
      24. TABLE 23 NORTH AMERICA: FERRIC OXIDE MARKET, BY APPLICATION, 2020‒2027 (USD MILLION) 49
      25. TABLE 24 NORTH AMERICA: FERRIC OXIDE MARKET, BY APPLICATION, 2020‒2027 (KILO TONS) 50
      26. TABLE 25 US: FERRIC OXIDE MARKET, BY APPLICATION, 2020‒2027 (USD MILLION) 50
      27. TABLE 26 US: FERRIC OXIDE MARKET, BY APPLICATION, 2020‒2027 (KILO TONS) 51
      28. TABLE 27 CANADA: FERRIC OXIDE MARKET, BY APPLICATION, 2020‒2027 (USD MILLION) 52
      29. TABLE 28 CANADA: FERRIC OXIDE MARKET, BY APPLICATION, 2020‒2027 (KILO TONS) 52
      30. TABLE 29 EUROPE: FERRIC OXIDE MARKET, BY COUNTRY, 2020‒2027 (USD MILLION) 53
      31. TABLE 30 EUROPE: FERRIC OXIDE MARKET, BY COUNTRY, 2020‒2027 (KILO TONS) 54
      32. TABLE 31 EUROPE: FERRIC OXIDE MARKET, BY APPLICATION, 2020‒2027 (USD MILLION) 54
      33. TABLE 32 EUROPE: FERRIC OXIDE MARKET, BY APPLICATION, 2020‒2027 (KILO TONS) 55
      34. TABLE 33 GERMANY: FERRIC OXIDE MARKET, BY APPLICATION, 2020‒2027 (USD MILLION) 55
      35. TABLE 34 GERMANY: FERRIC OXIDE MARKET, BY APPLICATION, 2020‒2027 (KILO TONS) 56
      36. TABLE 35 FRANCE: FERRIC OXIDE MARKET, BY APPLICATION, 2020‒2027 (USD MILLION) 56
      37. TABLE 36 FRANCE: FERRIC OXIDE MARKET, BY APPLICATION, 2020‒2027 (KILO TONS) 57
      38. TABLE 37 UK: FERRIC OXIDE MARKET, BY APPLICATION, 2020‒2027 (USD MILLION) 57
      39. TABLE 38 UK: FERRIC OXIDE MARKET, BY APPLICATION, 2020‒2027 (KILO TONS) 58
      40. TABLE 39 ITALY: FERRIC OXIDE MARKET, BY APPLICATION, 2020‒2027 (USD MILLION) 58
      41. TABLE 40 ITALY: FERRIC OXIDE MARKET, BY APPLICATION, 2020‒2027 (KILO TONS) 59
      42. TABLE 41 RUSSIA: FERRIC OXIDE MARKET, BY APPLICATION, 2020‒2027 (USD MILLION) 59
      43. TABLE 42 RUSSIA: FERRIC OXIDE MARKET, BY APPLICATION, 2020‒2027 (KILO TONS) 60
      44. TABLE 43 SPAIN: FERRIC OXIDE MARKET, BY APPLICATION, 2020‒2027 (USD MILLION) 60
      45. TABLE 44 SPAIN: FERRIC OXIDE MARKET, BY APPLICATION, 2020‒2027 (KILO TONS) 61
      46. TABLE 45 THE NETHERLANDS: FERRIC OXIDE MARKET, BY APPLICATION, 2020‒2027 (USD MILLION) 61
      47. TABLE 46 THE NETHERLANDS: FERRIC OXIDE MARKET, BY APPLICATION, 2020‒2027 (KILO TONS) 62
      48. TABLE 47 BELGIUM: FERRIC OXIDE MARKET, BY APPLICATION, 2020‒2027 (USD MILLION) 62
      49. TABLE 48 BELGIUM: FERRIC OXIDE MARKET, BY APPLICATION, 2020‒2027 (KILO TONS) 63
      50. TABLE 49 POLAND: FERRIC OXIDE MARKET, BY APPLICATION, 2020‒2027 (USD MILLION) 63
      51. TABLE 50 POLAND: FERRIC OXIDE MARKET, BY APPLICATION, 2020‒2027 (KILO TONS) 64
      52. TABLE 51 REST OF EUROPE: FERRIC OXIDE MARKET, BY APPLICATION, 2020‒2027 (USD MILLION) 64
      53. TABLE 52 REST OF EUROPE: FERRIC OXIDE MARKET, BY APPLICATION, 2020‒2027 (KILO TONS) 65
      54. TABLE 53 ASIA-PACIFIC: FERRIC OXIDE MARKET, BY COUNTRY, 2020‒2027 (USD MILLION) 66
      55. TABLE 54 ASIA-PACIFIC: FERRIC OXIDE MARKET, BY COUNTRY, 2020‒2027 (KILO TONS) 66
      56. TABLE 55 ASIA-PACIFIC: FERRIC OXIDE MARKET, BY APPLICATION, 2020‒2027 (USD MILLION) 67
      57. TABLE 56 ASIA-PACIFIC: FERRIC OXIDE MARKET, BY APPLICATION, 2020‒2027 (KILO TONS) 68
      58. TABLE 57 CHINA: FERRIC OXIDE MARKET, BY APPLICATION, 2020‒2027 (USD MILLION) 68
      59. TABLE 58 CHINA: FERRIC OXIDE MARKET, BY APPLICATION, 2020‒2027 (KILO TONS) 69
      60. TABLE 59 JAPAN: FERRIC OXIDE MARKET, BY APPLICATION, 2020‒2027 (USD MILLION) 69
      61. TABLE 60 JAPAN: FERRIC OXIDE MARKET, BY APPLICATION, 2020‒2027 (KILO TONS) 70
      62. TABLE 61 INDIA: FERRIC OXIDE MARKET, BY APPLICATION, 2020‒2027 (USD MILLION) 70
      63. TABLE 62 INDIA: FERRIC OXIDE MARKET, BY APPLICATION, 2020‒2027 (KILO TONS) 71
      64. TABLE 63 SOUTH KOREA: FERRIC OXIDE MARKET, BY APPLICATION, 2020‒2027 (USD MILLION) 71
      65. TABLE 64 SOUTH KOREA: FERRIC OXIDE MARKET, BY APPLICATION, 2020‒2027 (KILO TONS) 72
      66. TABLE 65 AUSTRALIA AND NEW ZEALAND: FERRIC OXIDE MARKET, BY APPLICATION, 2020‒2027 (USD MILLION) 72
      67. TABLE 66 AUSTRALIA AND NEW ZEALAND: FERRIC OXIDE MARKET, BY APPLICATION, 2020‒2027 (KILO TONS) 73
      68. TABLE 67 THAILAND: FERRIC OXIDE MARKET, BY APPLICATION, 2020‒2027 (USD MILLION) 73
      69. TABLE 68 THAILAND: FERRIC OXIDE MARKET, BY APPLICATION, 2020‒2027 (KILO TONS) 74
      70. TABLE 69 MALAYSIA: FERRIC OXIDE MARKET, BY APPLICATION, 2020‒2027 (USD MILLION) 74
      71. TABLE 70 MALAYSIA: FERRIC OXIDE MARKET, BY APPLICATION, 2020‒2027 (KILO TONS) 75
      72. TABLE 71 INDONESIA: FERRIC OXIDE MARKET, BY APPLICATION, 2020‒2027 (USD MILLION) 75
      73. TABLE 72 INDONESIA: FERRIC OXIDE MARKET, BY APPLICATION, 2020‒2027 (KILO TONS) 76
      74. TABLE 73 REST OF ASIA-PACIFIC: FERRIC OXIDE MARKET, BY APPLICATION, 2020‒2027 (USD MILLION) 76
      75. TABLE 74 REST OF ASIA-PACIFIC: FERRIC OXIDE MARKET, BY APPLICATION, 2020‒2027 (KILO TONS) 77
      76. TABLE 75 LATIN AMERICA: FERRIC OXIDE MARKET, BY COUNTRY, 2020‒2027 (USD MILLION) 78
      77. TABLE 76 LATIN AMERICA: FERRIC OXIDE MARKET, BY COUNTRY, 2020‒2027 (KILO TONS) 78
      78. TABLE 77 LATIN AMERICA: FERRIC OXIDE MARKET, BY APPLICATION, 2020‒2027 (USD MILLION) 79
      79. TABLE 78 LATIN AMERICA: FERRIC OXIDE MARKET, BY APPLICATION, 2020‒2027 (KILO TONS) 79
      80. TABLE 79 MEXICO: FERRIC OXIDE MARKET, BY APPLICATION, 2020‒2027 (USD MILLION) 80
      81. TABLE 80 MEXICO: FERRIC OXIDE MARKET, BY APPLICATION, 2020‒2027 (KILO TONS) 80
      82. TABLE 81 BRAZIL: FERRIC OXIDE MARKET, BY APPLICATION, 2020‒2027 (USD MILLION) 81
      83. TABLE 82 BRAZIL: FERRIC OXIDE MARKET, BY APPLICATION, 2020‒2027 (KILO TONS) 81
      84. TABLE 83 ARGENTINA: FERRIC OXIDE MARKET, BY APPLICATION, 2020‒2027 (USD MILLION) 82
      85. TABLE 84 ARGENTINA: FERRIC OXIDE MARKET, BY APPLICATION, 2020‒2027 (KILO TONS) 82
      86. TABLE 85 REST OF LATIN AMERICA: FERRIC OXIDE MARKET, BY APPLICATION, 2020‒2027 (USD MILLION) 83
      87. TABLE 86 REST OF LATIN AMERICA: FERRIC OXIDE MARKET, BY APPLICATION, 2020‒2027 (KILO TONS) 83
      88. TABLE 87 MIDDLE EAST & AFRICA: FERRIC OXIDE MARKET, BY COUNTRY, 2020‒2027 (USD MILLION) 84
      89. TABLE 88 MIDDLE EAST & AFRICA: FERRIC OXIDE MARKET, BY COUNTRY, 2020‒2027 (KILO TONS) 84
      90. TABLE 89 MIDDLE EAST & AFRICA: FERRIC OXIDE MARKET, BY APPLICATION, 2020‒2027 (USD MILLION) 85
      91. TABLE 90 MIDDLE EAST & AFRICA: FERRIC OXIDE MARKET, BY APPLICATION, 2020‒2027 (KILO TONS) 85
      92. TABLE 91 TURKEY: FERRIC OXIDE MARKET, BY APPLICATION, 2020‒2027 (USD MILLION) 86
      93. TABLE 92 TURKEY: FERRIC OXIDE MARKET, BY APPLICATION, 2020‒2027 (KILO TONS) 86
      94. TABLE 93 UAE: FERRIC OXIDE MARKET, BY APPLICATION, 2020‒2027 (USD MILLION) 87
      95. TABLE 94 UAE: FERRIC OXIDE MARKET, BY APPLICATION, 2020‒2027 (KILO TONS) 87
      96. TABLE 95 SAUDI ARABIA: FERRIC OXIDE MARKET, BY APPLICATION, 2020‒2027 (USD MILLION) 88
      97. TABLE 96 SAUDI ARABIA: FERRIC OXIDE MARKET, BY APPLICATION, 2020‒2027 (KILO TONS) 88
      98. TABLE 97 ISRAEL: FERRIC OXIDE MARKET, BY APPLICATION, 2020‒2027 (USD MILLION) 89
      99. TABLE 98 ISRAEL: FERRIC OXIDE MARKET, BY APPLICATION, 2020‒2027 (KILO TONS) 89
      100. TABLE 99 NORTH AFRICA: FERRIC OXIDE MARKET, BY APPLICATION, 2020‒2027 (USD MILLION) 90
      101. TABLE 100 NORTH AFRICA: FERRIC OXIDE MARKET, BY APPLICATION, 2020‒2027 (KILO TONS) 90
      102. TABLE 101 REST OF MIDDLE EAST & AFRICA: FERRIC OXIDE MARKET, BY APPLICATION, 2020‒2027 (USD MILLION) 91
      103. TABLE 102 REST OF MIDDLE EAST & AFRICA: FERRIC OXIDE MARKET, BY APPLICATION, 2020‒2027 (KILO TONS) 91
      104. TABLE 103 WESTERN AUSTRALIA IRON ORE: PRODUCTS OFFERING 95
      105. TABLE 104 WESTERN AUSTRALIA IRON ORE: PRODUCTS OFFERING 96
      106. TABLE 105 CARAJÁS MINE VALE: PRODUCTS OFFERING 98
      107. TABLE 106 SIMEC: PRODUCTS OFFERING 99
      108. TABLE 107 SIMEC: KEY DEVELOPMENTS 99
      109. TABLE 108 FORTESCUE METALS GROUP LTD: PRODUCTS OFFERING 102
      110. TABLE 109 FORTESCUE METALS GROUP LTD: KEY DEVELOPMENTS 102
      111. TABLE 110 SHREE MINERALS LTD: PRODUCTS OFFERING 103
      112. TABLE 111 APPLIED MINERALS INC.: PRODUCTS OFFERING 105
      113. TABLE 112 ATLAS IRON PTY LTD: PRODUCTS OFFERING 107
      114. TABLE 113 CLEVELAND-CLIFFS.: PRODUCTS OFFERING 109
      115. TABLE 114 LABRADOR IRON MINES: PRODUCTS OFFERING 111
      116. TABLE 115 KARARA MINING LTD.: KEY DEVELOPMENT 113 13 List Of Figures
      117. FIGURE 1 GLOBAL FERRIC OXIDE MARKET: MARKET STRUCTURE 16
      118. FIGURE 2 NORTH AMERICA MARKET SIZE & MARKET SHARE BY COUNTRY (2020 VS 2027) 17
      119. FIGURE 3 EUROPE MARKET SIZE & MARKET SHARE BY COUNTRY (2020 VS 2027) 18
      120. FIGURE 4 ASIA-PACIFIC & MARKET SHARE BY COUNTRY (2020 VS 2027) 18
      121. FIGURE 5 LATIN AMERICA MARKET SIZE & MARKET SHARE BY COUNTRY (2020 VS 2027) 19
      122. FIGURE 6 MIDDLE EAST & AFRICA MARKET SIZE & MARKET SHARE BY COUNTRY (2020 VS 2027) 19
      123. FIGURE 7 RESEARCH PROCESS OF MRFR 20
      124. FIGURE 8 TOP-DOWN & Bottom-up Approach 23
      125. FIGURE 9 MARKET DYNAMICS OVERVIEW 25
      126. FIGURE 10 GLOBAL TRADE DATA FOR CEMENT (2014–2020) 27
      127. FIGURE 11 DRIVERS IMPACT ANALYSIS 27
      128. FIGURE 12 RESTRAINTS IMPACT ANALYSIS 28
      129. FIGURE 13 GLOBAL CRUDE STEEL PRODUCTION 30
      130. FIGURE 14 SUPPLY / VALUE CHAIN: GLOBAL FERRIC OXIDE MARKET 31
      131. FIGURE 15 Porter's Five Forces Analysis OF THE GLOBAL FERRIC OXIDE MARKET 33
      132. FIGURE 16 GLOBAL FERRIC OXIDE MARKET, BY APPLICATION, 2020‒2027 (USD MILLION) 35
      133. FIGURE 17 GLOBAL FERRIC OXIDE MARKET, BY APPLICATION, 2020‒2027 (KILO TONS) 36
      134. FIGURE 18 GLOBAL FERRIC OXIDE MARKET, BY REGION, 2020‒2027 (USD MILLION) 45
      135. FIGURE 19 GLOBAL FERRIC OXIDE MARKET, BY REGION, 2020‒2027 (KILO TONS) 46
      136. FIGURE 20 MARKET STRATEGY SHARE (%) 92
      137. FIGURE 21 KEY DEVELOPMENTS OVERVIEW 93
      138. FIGURE 22 WESTERN AUSTRALIA IRON ORE: FINANCIAL OVERVIEW SNAPSHOT 95
      139. FIGURE 23 WESTERN AUSTRALIA IRON ORE: SWOT ANALYSIS 96
      140. FIGURE 24 CARAJÁS MINE (VALE): FINANCIAL OVERVIEW SNAPSHOT 97
      141. FIGURE 25 VALE: SWOT ANALYSIS 98
      142. FIGURE 26 SIMEC: SWOT ANALYSIS 100
      143. FIGURE 27 FORTESCUE METALS GROUP LTD: FINANCIAL OVERVIEW SNAPSHOT 101
      144. FIGURE 28 FORTESCUE METALS GROUP LTD: SWOT ANALYSIS 102
      145. FIGURE 29 SHREE MINERALS LTD: FINANCIAL OVERVIEW SNAPSHOT 103
      146. FIGURE 30 SHREE MINERALS LTD: SWOT ANALYSIS 104
      147. FIGURE 31 APPLIED MINERALS INC: FINANCIAL OVERVIEW SNAPSHOT 105
      148. FIGURE 32 APPLIED MINERALS INC: SWOT ANALYSIS 106
      149. FIGURE 33 ATLAS IRON PTY LTD: SWOT ANALYSIS 107
      150. FIGURE 34 ATLAS IRON PTY LTD: SWOT ANALYSIS 108
      151. FIGURE 35 CLEVELAND-CLIFFS.: FINANCIAL OVERVIEW SNAPSHOT 109
      152. FIGURE 36 CLEVELAND-CLIFFS.: SWOT ANALYSIS 110
      153. FIGURE 37 LABRADOR IRON MINES: FINANCIAL OVERVIEW SNAPSHOT 111
      154. FIGURE 38 LABRADOR IRON MINES: SWOT ANALYSIS 112
      155. FIGURE 39 KARARA MINING LTD: PRODUCTS OFFERING 113
      156. FIGURE 40 KARARA MINING LTD: SWOT ANALYSIS 114

    Ferric Oxide Market Segmentation

    Market Segmentation Overview

    • Detailed segmentation data will be available in the full report
    • Comprehensive analysis by multiple parameters
    • Regional and country-level breakdowns
    • Market size forecasts by segment
    Infographic

    Free Sample Request

    Kindly complete the form below to receive a free sample of this Report

    Get Free Sample

    Customer Strories

    “I am very pleased with how market segments have been defined in a relevant way for my purposes (such as "Portable Freezers & refrigerators" and "last-mile"). In general the report is well structured. Thanks very much for your efforts.”

    Victoria Milne

    Founder
    Case Study
    Chemicals and Materials