ID: MRFR/AGR/3888-HCR | February 2021 | Region: Global | 110 pages
Market Synopsis of Feed Binders Market:
Market Definition:
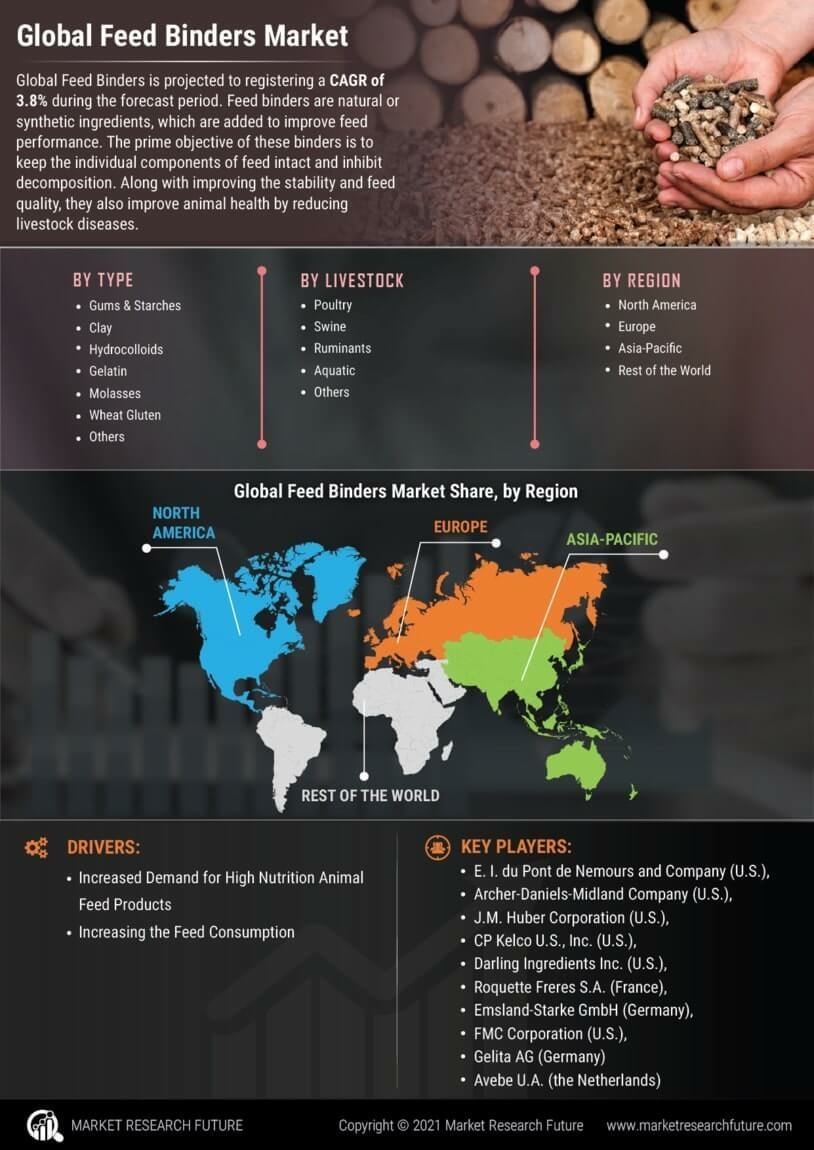
Feed binders are natural or synthetic ingredients, which are added to improve feed performance. The prime objective of these binders is to keep the individual components of feed intact and inhibit decomposition. Along with improving the stability and feed quality, they also improve animal health by reducing livestock diseases. The most common binders used in feed are gums & starches, clay, hydrocolloids, gelatin, molasses, and wheat gluten.
Market Scenario:
Feed binders have gained status globally, as they help in binding the feed components for better stability. Growing population in the developing countries has increased the demand for production of poultry, ruminants and other livestock for consumption, which has uplifted the demand for feed, which, in turn, has uplifted the feed binders market. Growing awareness regarding livestock health, along with increased demand for high nutrition animal feed products is expected to uplift the demand for feed binders. Moreover, use of feed binders has helped in increasing the feed consumption and also reducing the feed wastage. Use of clay, as a feed binder in aqua feed formulation is experiencing a high demand owing to its enhanced functionality and stability.
Additionally, the enhancement of the product coupled with technological advancements is considered to be one of the significant reasons for the increasing growth of the feed binders market during the forecast period, 2017-2023.
Key Findings:
Segments:
The global feed binders market is segmented into type and livestock.
On the basis of the type, it is segmented into gums & starches, clay, hydrocolloids, gelatin, molasses, wheat gluten, and others. Among all, the clay segment is dominating the market followed by hydrocolloids owing to its higher use in the aqua feed products for better stability and functionality.
On the basis of the livestock, it is segmented into poultry, swine, ruminants, aquatic, and others. Among all, the poultry segment is dominating the market based on increased consumption of poultry and meat products globally. However, the aquatic segment is projected to witness steady growth over the forecast period owing to growth in the poultry industry.
Regional Analysis:
The global feed binders market is segmented into North America, Europe, Asia Pacific, and rest of the world (RoW). Asia Pacific is dominating the feed binders market followed by North America. In the Asia Pacific region, China is the major consumer of feed binders, which, in turn, boosts the market growth in this region. Furthermore, increasing consumption of poultry and meat products and rapidly growing population in developing countries of Asia Pacific is giving a push to the growth of the feed binders market.
Moreover, rising demand for feed additives such as binders & enhancers in countries like the U.S., Canada, and Mexico in the North American region is projected to boost the feed binders market during the forecast period.
Key Players:
Some of the key players profiled in the global feed binders market: E. I. du Pont de Nemours and Company (U.S.), Archer-Daniels-Midland Company (U.S.), J.M. Huber Corporation (U.S.), CP Kelco U.S., Inc. (U.S.), Darling Ingredients Inc. (U.S.), Roquette Freres S.A. (France), Emsland-Starke GmbH (Germany), FMC Corporation (U.S.), Gelita AG (Germany), and Avebe U.A. (the Netherlands)
Intended Audience:
The global feed binders market is segmented into the following regions
North America
Europe
Asia Pacific
Rest of the world
Frequently Asked Questions (FAQ) :
feed binders market is projected to grow at approximately 3.8% CAGR during the assessment period (2017-2023).
On the basis of type, the clay segment and on the basis of livestock, the poultry segment, accounts for the major shares in the global feed binders market.
Augmenting demand for animal feed products with high protein content led by the growing consumer awareness about the protein content, rising meat consumption, and industrialization of livestock, are major tailwinds pushing the growth of the global feed binders market.
Asia Pacific holds the largest share in the global feed binders market, followed by North America and Europe, respectively.
E. I. du Pont de Nemours and Company (U.S.), J.M. Huber Corporation (U.S.), Archer-Daniels-Midland Company (U.S.), CP Kelco U.S., Inc. (U.S.), Roquette Freres S.A. (France), Darling Ingredients Inc. (U.S.), Emsland-Starke GmbH (Germany), Gelita AG (Germany), FMC Corporation (U.S.), and Avebe U.A. (the Netherlands), are some of the top players operating in the global feed binders market.
Table of Content
Chapter 1. Methodology and Scope
1.1. Research Methodology
1.1.1 Initial Data Exploration
1.1.2 Statistical Modelling and Forecast
1.1.3 Industry Insights and Validation
1.2. Data Sources
Chapter 2. Executive Summary
2.1. Feed Binders Market Synopsis, 2017-2023
2.1.1 Business Trends
2.1.2 Product Type Trends
2.1.3 Product Livestock Trends
Chapter 3 Feed Binders Market Insights
3.1 Industry Segmentation
3.2 Industry Size and Forecast
3.3 Industry Ecosystem Analysis
3.4 Industry Impact forces
3.4.1 Growth Drivers
3.4.1.1 Growing awareness regarding feed quality
3.4.1.2 Increasing demand of meat & meat products
3.4.1.3 Increasing demand for superior quality animal feed
3.4.2 Industry Pitfalls & Challenges
3.4.2.1 High processing cost
3.4.2.2 Increase in the prices of raw material
3.5 Growth Potential Analysis
3.6 Company Market Share Analysis, 2016
3.7 Porter’s Analysis
3.8 PESTEL Analysis
Chapter 4 Feed Binders Market by Type Insights
4.1 Global Feed Binders Market Volume Share by Type, 2017-2023
4.1.1 Gums & Starches
4.1.1.1 Market Estimates & Forecast, 2017-2023
4.1.2 Hydrocolloids
4.1.2.1 Market Estimates & Forecast, 2017-2023
4.1.3 Clay
4.1.3.1 Market Estimates & Forecast, 2017-2023
4.1.4 Gelatin
4.1.4.1 Market Estimates & Forecast, 2017-2023
4.1.5 Molasses
4.1.5.1 Market Estimates & Forecast, 2017-2023
4.1.6 Wheat Gluten
4.1.6.1 Market Estimates & Forecast, 2017-2023
4.1.7 Others
4.1.7.1 Market Estimates & Forecast, 2017-2023
Chapter 5 Feed Binders Market by Livestock Insights
5.1 Global Feed Binders Market Volume Share by Livestock, 2017 & 2023
5.1.1 Poultry
5.1.1.1 Market Estimates & Forecast, 2017-2023
5.1.2 Swine
5.1.2.1 Market Estimates & Forecast, 2017-2023
5.1.3 Ruminants
5.1.3.1 Market Estimates & Forecast, 2017-2023
5.1.4 Aquatic
5.1.4.1 Market Estimates & Forecast, 2017-2023
5.1.5 Others
5.1.5.1 Market Estimates & Forecast, 2017-2023
Chapter 6 Feed Binders Market Regional Insights
6.1 Feed Binders Market Volume Share by Region, 2017 & 2023.
6.2 North America
6.2. A Market Estimates & Forecast, 2017-2023
6.2. B Market Estimates & Forecast, by Type, 2017-2023
6.2. C Market Estimates & Forecast, by Livestock, 2017-2023
6.2.1 U.S.
6.2.1.1 Market Estimates & Forecast, 2017-2023
6.2.1.2 Market Estimates & Forecast, by Type, 2017-2023
6.2.1.3 Market Estimates & Forecast, by Livestock, 2017-2023
6.2.2 Canada
6.2.2.1 Market Estimates & Forecast, 2017-2023
6.2.2.2 Market Estimates & Forecast, by Type, 2017-2023
6.2.2.3 Market Estimates & Forecast, by Livestock, 2017-2023
6.2.3 Mexico
6.2.3.1 Market Estimates & Forecast, 2017-2023
6.2.3.2 Market Estimates & Forecast, by Type, 2017-2023
6.2.3.3 Market Estimates & Forecast, by Livestock, 2017-2023
6.3 Europe
6.3. A Market Estimates & Forecast, 2017-2023
6.3. B Market Estimates & Forecast, by Type, 2017-2023
6.3. C Market Estimates & Forecast, by Livestock, 2017-2023
6.3.1 Germany
6.3.1.1 Market Estimates & Forecast, 2017-2023
6.3.1.2 Market Estimates & Forecast, by Type, 2017-2023
6.3.1.3 Market Estimates & Forecast, by Livestock, 2017-2023
6.3.2 U.K
6.3.2.1 Market Estimates & Forecast, 2017-2023
6.3.2.2 Market Estimates & Forecast, by Type, 2017-2023
6.3.2.3 Market Estimates & Forecast, by Livestock, 2017-2023
6.3.3 France
6.3.3.1 Market Estimates & Forecast, 2017-2023
6.3.3.2 Market Estimates & Forecast, by Type, 2017-2023
6.3.3.3 Market Estimates & Forecast, by Livestock, 2017-2023
6.3.4 Italy
6.3.4.1 Market Estimates & Forecast, 2017-2023
6.3.4.2 Market Estimates & Forecast, by Type, 2017-2023
6.3.4.3 Market Estimates & Forecast, by Livestock, 2017-2023
6.4 Asia Pacific
6.4. A Market Estimates & Forecast, 2017-2023
6.4. B Market Estimates & Forecast, by Type, 2017-2023
6.4. C Market Estimates & Forecast, by Livestock, 2017-2023
6.4.1 China
6.4.1.1 Market Estimates & Forecast, 2017-2023
6.4.1.2 Market Estimates & Forecast, by Type, 2017-2023
6.4.1.3 Market Estimates & Forecast, by Livestock, 2017-2023
6.4.2 India
6.4.2.1 Market Estimates & Forecast, 2017-2023
6.4.2.2 Market Estimates & Forecast, by Type, 2017-2023
6.4.2.3 Market Estimates & Forecast, by Livestock, 2017-2023
6.4.3 Japan
6.4.3.1 Market Estimates & Forecast, 2017-2023
6.4.3.2 Market Estimates & Forecast, by Type, 2017-2023
6.4.3.3 Market Estimates & Forecast, by Livestock, 2017-2023
6.5 RoW
6.5.1 Market Estimates & Forecast, 2017-2023
6.5.2 Market Estimates & Forecast, by Type, 2017-2023
6.5.3 Market Estimates & Forecast, by Livestock, 2017-2023
Chapter 7 Competitor Profile
7.1 E. I. du Pont de Nemours and Company (U.S.)
7.1.1 Business Overview
7.1.2 Financial Data
7.1.3 Product Landscape
7.1.4 Key Developments
7.1.5 Business Strategy
7.1.6 SWOT Analysis
7.2 Archer-Daniels-Midland Company (U.S.)
7.2.1 Business Overview
7.2.2 Financial Data
7.2.3 Product Landscape
7.2.4 Key Developments
7.2.5 Business Strategy
7.2.6 SWOT Analysis
7.3 J.M. Huber Corporation (U.S.)
7.3.1 Business Overview
7.3.2 Financial Data
7.3.3 Product Landscape
7.3.4 Key Developments
7.3.5 Business Strategy
7.3.6 SWOT Analysis
7.4 CP Kelco U.S., Inc. (U.S.)
7.4.1 Business Overview
7.4.2 Financial Data
7.4.3 Product Landscape
7.4.4 Key Developments
7.4.5 Business Strategy
7.4.6 SWOT Analysis
7.5 Darling Ingredients Inc. (U.S.)
7.5.1 Business Overview
7.5.2 Financial Data
7.5.3 Product Landscape
7.5.4 Key Developments
7.5.5 Business Strategy
7.5.6 SWOT Analysis
7.6 Roquette Freres S.A. (France)
7.6.1 Business Overview
7.6.2 Financial Data
7.6.3 Product Landscape
7.6.4 Key Developments
7.6.5 Business Strategy
7.6.6 SWOT Analysis
7.7 Emsland-Starke GmbH (Germany)
7.7.1 Business Overview
7.7.2 Financial Data
7.7.3 Product Landscape
7.7.4 Key Developments
7.7.5 Business Strategy
7.7.6 SWOT Analysis
7.8 FMC Corporation (U.S.)
7.8.1 Business Overview
7.8.2 Financial Data
7.8.3 Product Landscape
7.8.4 Key Developments
7.8.5 Business Strategy
7.8.6 SWOT Analysis
7.9 Gelita AG (Germany)
7.9.1 Business Overview
7.9.2 Financial Data
7.9.3 Product Landscape
7.9.4 Key Developments
7.9.5 Business Strategy
7.9.6 SWOT Analysis
7.10 Avebe U.A. (the Netherlands)
7.10.1 Business Overview
7.10.2 Financial Data
7.10.3 Product Landscape
7.10.4 Key Developments
7.10.5 Business Strategy
7.10.6 SWOT Analysis
Data Tables
TABLE 1 PESTLE ANALYSIS – U.S.
TABLE 2 PESTLE ANALYSIS- CANADA
TABLE 3 PESTLE ANALYSIS- CHINA
TABLE 4 PESTLE ANALYSIS- FRANCE
TABLE 5 PESTLE ANALYSIS- U.K.
TABLE 6 KEY SUPPLIERS OF FEED BINDERS
TABLE 7 GLOBAL MARKET FOR FEED BINDERS, BY TYPE, (2017-2023), USD MILLION
TABLE 8 GLOBAL MARKET FOR FEED BINDERS, BY LIVESTOCK, (2017-2023), USD MILLION
TABLE 9 GLOBAL FEED BINDERS SALES AND GROWTH RATE (2017-2023) USD MILLION
TABLE 10 GLOBAL MARKET FOR FEED BINDERS TOP 5 COUNTRIES
TABLE 11 GLOBAL MARKET FOR FEED BINDERS TOP COMPANIES-USD MILLION
TABLE 12 NORTH AMERICAN MARKET FOR FEED BINDERS, BY TYPE, (2017-2023) USD MILLION
TABLE 13 NORTH AMERICAN MARKET FOR FEED BINDERS, BY LIVESTOCK, (2017-2023), USD MILLION
TABLE 14 EUROPEAN MARKET FOR FEED BINDERS, BY TYPE, (2017-2023) USD MILLION
TABLE 15 EUROPEAN MARKET FOR FEED BINDERS, BY LIVESTOCK, (2017-2023), USD MILLION
TABLE 16 APAC MARKET FOR FEED BINDERS, BY TYPE, (2017-2023) USD MILLION
TABLE 17 APAC MARKET FOR FEED BINDERS, BY LIVESTOCK, (2017-2023), USD MILLION
TABLE 18 REST OF THE WORLD MARKET FOR FEED BINDERS, BY TYPE, (2017-2023) USD MILLION
TABLE 19 REST OF THE WORLD MARKET FOR FEED BINDERS, BY LIVESTOCK, (2017-2023), USD MILLION
TABLE 20 COMPETITIVE LANDSCAPING BASED ON FINACIALS DURING THE YEAR 2016
Charts & Figures
LIST OF FIGURES
FIGURE 1 RESEARCH METHODOLOGY
FIGURE 2 PRIMARY DATA ANALYSIS APPROACH
FIGURE 3 SECONDARY DATA ANALYSIS APPROACH
FIGURE 4 TRENDS IN FEED BINDERS IMPORTS 2011-16
FIGURE 5 GROWTH RATE IN FEED BINDERS IMPORTS 2011-16
FIGURE 6 FEED BINDERS IMPORTS MARKET SHARE BY TOP 5 IMPORTERS (2011 VS 2016)
FIGURE 7 TRENDS IN FEED BINDERS EXPORTS 2011-16
FIGURE 8 GROWTH RATE FEED BINDERS EXPORTS 2011-16
FIGURE 9 FEED BINDERS EXPORTS MARKET SHARE BY TOP 5 EXPORTERS (2011 VS 2016)
FIGURE 10 VALUE CHAIN ANALYSIS
FIGURE 11 COST ANALYSIS: FEED BINDERS
FIGURE 12 PORTER’S FIVE FORCES ANALYSIS
FIGURE 13 GLOBAL MARKET FOR FEED BINDERS TRENDS BY TYPE
FIGURE 14 GLOBAL MARKET FOR FEED BINDERS TRENDS BY LIVESTOCK
FIGURE 1 FINANCIALS