• Cat-intel
  • MedIntelliX
  • Resources
  • About Us
  • English
    Chinese
    French
    Japanese
    Korean
    German
    Spanish

    Extruded Plastics Market Analysis

    ID: MRFR/CnM/1568-CR
    180 Pages
    Priya Nagrale
    June 2021

    Extruded Plastics Market Research Report Information By Type (Low-Density Polyethylene, Polypropylene, Polyvinyl Chloride, High-Density Polyethylene, Polystyrene, Others), By End-User (Packaging, Building & Construction, Automotive, Consumer Goods, Electrical & Electronics, Others) And By Region (North America, Europe, Asia-Pacific, And Rest Of The World) – Market Forecast Till 2035

    Share:
    Download PDF ×

    We do not share your information with anyone. However, we may send you emails based on your report interest from time to time. You may contact us at any time to opt-out.

    Extruded Plastics Market Infographic
    $ 4,950.0
    $ 5,950.0
    $ 7,250.0

    Market Analysis

    In-depth Analysis of Extruded Plastics Market Industry Landscape

    The extruded plastics market is currently undergoing a significant upswing, predominantly propelled by the robust expansion of the construction sector in developing regions, with a particular focus on India and China. Notably, the Indian government's substantial investments in key infrastructure projects, including the Smart Cities Mission and the Green Corridor, are pivotal contributors to the heightened demand for extruded plastics. These initiatives, designed to foster sustainable urban development and efficient transportation systems, necessitate the use of advanced materials like extruded plastics, given their versatility and adaptability. Similarly, in China, the initiation of the One Belt One Road project in late 2013 has spurred an unprecedented demand for construction materials, positioning extruded plastics as a favored choice. This colossal project, aimed at enhancing transportation infrastructure across continents, requires durable and cost-effective materials, and extruded plastics have emerged as a reliable solution for various applications in the construction sector. Moreover, the impact of rising standards of living and increased disposable incomes in these developing regions plays a pivotal role in furthering the extruded plastics market's growth. As economic conditions improve for individuals, there is a corresponding surge in housing demand, leading to heightened construction activities. Extruded plastics find extensive use in residential and commercial structures for applications such as pipes, profiles, and sheets. Despite the market's positive trajectory, challenges persist, particularly concerning environmental sustainability and plastic usage. The industry's response to these challenges will likely shape the trajectory of sustainable and eco-friendly alternatives within the extruded plastics market. Companies that strategically align with sustainability goals and innovate in developing environmentally responsible alternatives stand to gain a competitive advantage.

    Market Summary

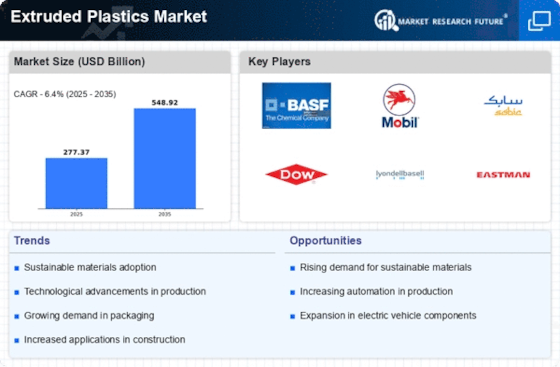
    As per Market Research Future Analysis, the Global Extruded Plastics Market was valued at USD 277.37 Billion in 2024 and is projected to reach USD 548.92 Billion by 2035, growing at a CAGR of 6.40% from 2025 to 2035. The market is driven by increasing demand from the construction industry and the Asia-Pacific region, with significant applications in packaging, automotive, and building sectors. The Low-Density Polyethylene segment is expected to hold the largest market share due to its flexible properties, while the packaging segment leads in end-user applications, primarily fueled by the food and beverage industry.

    Key Market Trends & Highlights

    Key trends influencing the Extruded Plastics Market include technological advancements and rising demand across various sectors.

    • The Asia-Pacific region is expected to grow at the highest rate during the forecast period, driven by demand from countries like China and India.
    • The packaging segment is anticipated to dominate the market share due to increased demand for food-grade materials.
    • Rising disposable income is leading to higher demand for extruded plastics in consumer goods and packaging applications.
    • Technological innovations are being prioritized by key players to enhance product offerings and market presence.

    Market Size & Forecast

    2024 Market Size USD 277.37 Billion
    2035 Market Size USD 548.92 Billion
    CAGR (2024-2035) 6.40%
    Largest Regional Market Share in 2024 Asia-Pacific

    Major Players

    Key market players include Amcor plc, Berry Global Inc., Sigma Plastics Group, Saudi Basic Industries Corporation (SABIC), and Chevron Phillips Chemical Company.

    Market Trends

    Rising Need to Remove Micronutrient Deficiency from Soil to Increase the Consumption of Extruded Plastics in the Agriculture Industry.

    Extruded plastics are used in a variety of applications, including pipes and tubing, wire insulation, windows and door profiles, films, and others, so the  Extruded Plastics Market is expected to grow rapidly in the coming years. Extruded plastics are ideal for insulation applications because of their excellent chemical stability, high strength, and corrosion resistance. Extruded plastics are also used in end-use sectors like building and construction, packaging, automotive, and industrial because they produce plastic materials in a variety of shapes and sizes.

    Customers have demanded food and other items that may not be available in their countries due to an increase in disposable income and a modern lifestyle. These items are brought in from other countries. As a result, the packaging industry has increased its demand for extruded plastics to ensure safety and proper storage during transportation and logistics. This in turn is expected to drive the growth of the extruded plastics market. Additionally, Another extruded plastics market driver is expected to be an increase in construction and building activities, as extruded plastic is frequently used for decoration and construction components.

    They are also used for

    cladding

    panels, cables, pipes, windows, insulation material, and other applications. To bring about product innovation, key players are focusing on technological advancements. These elements are expected to propel the market forward and act as growth propellers.

    The Global Extruded Plastics Market is poised for growth, driven by increasing demand across various industries, including construction and automotive, which underscores the material's versatility and adaptability.

    U.S. Department of Commerce

    Extruded Plastics Market Market Drivers

    Market Growth Projections

    The Global Extruded Plastics Market Industry is poised for substantial growth, with projections indicating a market value of 277.4 USD Billion in 2024 and an anticipated increase to 548.8 USD Billion by 2035. This growth trajectory suggests a robust compound annual growth rate (CAGR) of 6.4% from 2025 to 2035. Such figures underscore the increasing reliance on extruded plastics across various sectors, including construction, automotive, and packaging. The market's expansion reflects broader trends in material innovation, sustainability, and the evolving needs of industries worldwide.

    Growth in Automotive Industry

    The automotive industry plays a pivotal role in driving the Global Extruded Plastics Market Industry forward. With the ongoing shift towards lightweight vehicles to improve fuel efficiency and reduce emissions, extruded plastics are increasingly adopted in automotive applications. Components such as dashboards, trims, and bumpers made from extruded plastics not only reduce vehicle weight but also enhance design flexibility. This trend is expected to continue, as manufacturers seek to comply with stringent environmental regulations and consumer preferences for sustainable materials. The integration of extruded plastics in automotive design is likely to contribute to the market's growth trajectory in the coming years.

    Increasing Focus on Sustainability

    Sustainability emerges as a crucial driver for the Global Extruded Plastics Market Industry, as consumers and industries alike prioritize eco-friendly materials. The push for recycling and the development of biodegradable extruded plastics are reshaping market dynamics. Companies are increasingly adopting sustainable practices, such as using recycled materials in their production processes, which not only meets regulatory requirements but also appeals to environmentally conscious consumers. This focus on sustainability is likely to enhance the market's reputation and foster growth, as businesses strive to align with global sustainability goals and consumer expectations.

    Innovations in Product Development

    Innovative advancements in the manufacturing processes of extruded plastics significantly influence the Global Extruded Plastics Market Industry. Companies are increasingly investing in research and development to enhance the properties of extruded products, such as improving their strength, flexibility, and resistance to environmental factors. For instance, the introduction of bio-based extruded plastics is gaining traction, appealing to environmentally conscious consumers. This innovation not only meets regulatory demands but also aligns with the global shift towards sustainability. As a result, the market is expected to grow at a CAGR of 6.4% from 2025 to 2035, indicating a robust future for innovative extruded plastic solutions.

    Expanding Applications in Packaging

    The Global Extruded Plastics Market Industry is witnessing a significant expansion in packaging applications, driven by the need for lightweight and durable materials. Extruded plastics, particularly polyethylene and polypropylene, are increasingly utilized in food packaging, consumer goods, and industrial applications. The convenience and protective qualities of these materials enhance product shelf life and reduce waste. As the global packaging market continues to evolve, the demand for extruded plastics is anticipated to rise, contributing to the overall market growth. By 2035, the market value is projected to reach 548.8 USD Billion, highlighting the critical role of extruded plastics in the packaging sector.

    Rising Demand in Construction Sector

    The Global Extruded Plastics Market Industry experiences a notable surge in demand driven by the construction sector. As urbanization accelerates, the need for durable and lightweight materials for building applications increases. Extruded plastics, such as PVC and polystyrene, are favored for their versatility and cost-effectiveness. In 2024, the market value is projected to reach 277.4 USD Billion, reflecting the growing preference for these materials in construction. Furthermore, the trend towards sustainable building practices may further bolster the adoption of extruded plastics, as they can contribute to energy efficiency and waste reduction in construction projects.

    Market Segment Insights

    Extruded Plastics Type Insights

    The  Extruded Plastics Market segmentation, based on type, includes Low-Density Polyethylene, Polypropylene, Polyvinyl Chloride,

    , Polystyrene, and Others segments. The Low-Density Polyethylene segment is anticipated to account for the highest market share. This can be attributed to its flexible and long-lasting properties. Moreover, demand from the food industry has mandated the use of food-grade packaging materials, which is anticipated to drive the market further. 

    Extruded Plastics end-user Insights

    Based on End-User, the  Extruded Plastics Market segmentation includes Packaging, Building & Construction, Automotive, Consumer Goods, Electrical & Electronics, and Other segments. The Packaging segment is anticipated to account for the highest market share. This can be attributed to increased demand for extruded Plastics from food & beverage and consumer goods industries, primarily for storage purposes. 

    Get more detailed insights about Extruded Plastics Market Research Report - Forecast till 2032

    Regional Insights

    By region, the study provides market insights into North America, Europe, Asia-Pacific, and the Rest of the World. the Asia-Pacific region dominated the extruded plastics market operations in the period that ended in 2019. This market in the Asia-Pacific region is expected to expand and grow at the highest market rate during the forecast period. The main reason behind this is the increasing demand for extruded plastics from emerging and developed countries such as Japan, China, and India, alongside Indonesia amongst others.

    The market is witnessing an improvement in economies of scale followed by an increase in manufacturing & construction activities in the global region. Also, growing investment in the research and development department followed by the increased levels of plastic production is helping in the expansion of the market. The marketing is witnessing the emergence of domestic manufacturers in the APAC region which has led to a huge increase in the import activities of raw materials of extruded plastics.

    Key Players and Competitive Insights

    Major market players are spending a lot of money on R&D to increase their product lines, which will help the Extruded Plastics market grow even more. Market participants are also taking a range of strategic initiatives to grow their worldwide footprint, with key market developments such as new product launches, contractual agreements, mergers and acquisitions, increased investments, and collaboration with other organizations. Competitors in the Extruded Plastics industry must offer cost-effective items to expand and survive in an increasingly competitive and rising market environment.

    The major market players are investing a lot of money in R&D to expand their product lines, which will spur further market growth for Extruded Plastics. With significant market development like new product releases, contractual agreements, mergers and acquisitions, increased investments, and collaboration with other organizations, market participants are also undertaking various strategic activities to expand their global presence. To grow and thrive in a market climate that is becoming more competitive and growing, competitors in the Extruded Plastics industry must offer affordable products.

    Manufacturing locally to cut operating costs is one of the main business tactics manufacturers use in the global Extruded Plastics industry to benefit customers and expand the market sector. The Low-Profile Additives market has recently given medicine some of the most important advantages. Major Extruded Plastics market players, including Amcor plc, Berry Global Inc., Sigma Plastics Group., Saudi Basic Industries Corporation (SABIC), Chevron Phillips Chemical Company, and others are attempting to increase market demand by funding R&D initiatives. Berry Global Group (formerly Berry Plastics) is a company providing plastic packaging and protection solutions.

    It operates through four segments: Consumer Packaging International, Consumer Packaging North America, Engineered Materials, and Health, Hygiene, and Specialties. The Consumer Packaging International segment consists of such product groups as bottles and canisters, containers, closures, and dispensing systems, Also, Sigma Plastics Group has grown into North America’s largest privately held manufacturer of extruded polyethylene films and bags.

    Founded in 1978 with just one facility, today we offer more than forty (40) locations across the United States and Canada – each designed to serve and surpass our customer’s expectations with our commitment to quality, innovation, and expertise in flexible packaging with more than 2 billion pounds of resin.

    Key Companies in the Extruded Plastics Market market include

    Industry Developments

    • Q2 2024: TekniPlex Healthcare Expands Global Footprint with New Extrusion Facility in Belgium TekniPlex Healthcare announced the opening of a new state-of-the-art extrusion facility in Belgium to increase its capacity for extruded plastic medical tubing, supporting European and global healthcare markets.
    • Q2 2024: Berry Global Launches New Recyclable Extruded Plastic Packaging for Food Industry Berry Global introduced a new line of recyclable extruded plastic packaging solutions targeting the food sector, aiming to meet growing demand for sustainable packaging options.
    • Q3 2024: INEOS Acquires Extruded Plastics Producer RPC Bebo for $250 Million INEOS completed the acquisition of RPC Bebo, a leading European extruded plastics manufacturer, to strengthen its packaging and specialty plastics portfolio.
    • Q2 2024: Plastics Extrusion Machinery LLC Appoints New CEO to Drive Global Expansion Plastics Extrusion Machinery LLC named industry veteran Lisa Carter as CEO, tasking her with leading the company’s international growth and innovation strategy.
    • Q1 2024: Orbia’s Vestolit Division Announces $60 Million Investment in New PVC Extrusion Plant in Mexico Orbia’s Vestolit division revealed plans to build a new PVC extrusion facility in Mexico, expanding its capacity to serve construction and infrastructure markets in the Americas.
    • Q3 2024: SABIC and Plastic Omnium Form Joint Venture for Advanced Automotive Extruded Plastics SABIC and Plastic Omnium established a joint venture to develop and manufacture advanced extruded plastic components for electric vehicles, focusing on lightweight and sustainable solutions.
    • Q2 2024: Celanese Launches New High-Performance Extruded POM Tubing for Medical Devices Celanese introduced a new range of high-performance extruded polyoxymethylene (POM) tubing designed for use in minimally invasive medical devices.
    • Q1 2024: Greiner Packaging Opens New Extrusion Line in Serbia to Meet Eastern European Demand Greiner Packaging inaugurated a new extrusion line at its Serbian facility, increasing production capacity for extruded plastic packaging in Eastern Europe.
    • Q2 2025: Toray Industries Wins Major Contract to Supply Extruded Plastic Films for Solar Panel Manufacturer Toray Industries secured a multi-year contract to supply extruded plastic films to a leading global solar panel manufacturer, supporting the renewable energy sector.
    • Q1 2025: Alpla Group Acquires Extruded Plastics Producer Boxmore Packaging in South Africa Alpla Group completed the acquisition of Boxmore Packaging, a South African extruded plastics manufacturer, expanding its footprint in the African packaging market.
    • Q2 2025: Dow Announces Commercial Launch of Bio-Based Extruded Polyethylene for Flexible Packaging Dow launched a new bio-based extruded polyethylene product line for flexible packaging, targeting customers seeking lower-carbon and renewable material solutions.
    • Q3 2024: Saint-Gobain Opens New Extruded Plastics R&D Center in France Saint-Gobain inaugurated a new research and development center in France dedicated to innovation in extruded plastics for construction and industrial applications.

    Future Outlook

    Extruded Plastics Market Future Outlook

    The Global Extruded Plastics Market is projected to grow at a 6.4% CAGR from 2024 to 2035, driven by increasing demand in packaging, automotive, and construction sectors.

    New opportunities lie in:

    • Invest in sustainable materials to meet rising eco-friendly product demand.
    • Develop advanced extrusion technologies to enhance production efficiency.
    • Expand into emerging markets to capitalize on growing infrastructure projects.

    By 2035, the market is expected to exhibit robust growth, positioning itself as a leader in innovative plastic solutions.

    Market Segmentation

    Extruded Plastics Type Outlook

    • Low-Density Polyethylene
    • Polypropylene
    • Polyvinyl Chloride
    • High-Density Polyethylene
    • Polystyrene
    • Others

    Extruded Plastics Regional Outlook

    North America
    • US
    • Canada

    Extruded Plastics Application Outlook

    • Packaging
    • Building & Construction
    • Automotive
    • Consumer Goods
    • Electrical & Electronics
    • Others

    Report Scope

    Attribute/Metric Details
    Market Size 2023 USD 24022 Billion
    Market Size 2024 USD 277.37 Billion
    Market Size 2032 USD 455.62 Billion
    Compound Annual Growth Rate (CAGR) 6.40% (2024-2032)
    Base Year 2023
    Market Forecast Period 2024-2032
    Historical Data 2018 & 2020
    Market Forecast Units Value (USD Billion)
    Report Coverage Revenue Forecast, Market Competitive Landscape, Growth Factors, and Trends
    Segments Covered Process, Grade, and Region
    Geographies Covered North America, Europe, Asia Pacific, and the Rest of the World
    Countries Covered The U.S, Canada, Germany, France, the UK, Italy, Spain, China, Japan, India, Australia, South Korea, and Brazil
    Key Companies Profiled DuPont de Nemours Inc. (US), Sigma Plastics Group (US), Exxon Mobil Corporation (US), Berry Global Inc. (US), SABIC (Saudi Arabia), Chevron Phillips Chemical Company (US), Saint-Gobain Performance Plastics (France), JM EAGLE INC. (US), Formosa Plastics Corporation (US), Bemis Company Inc. (US), Atlantis Plastics Inc. (US)
    Key Market Opportunities ·         Rapid industrialization and urbanization coupled with economic growth.
    Key Market Dynamics ·         The increasing working population, high disposable income, and the changing lifestyle trend have resulted in an increased demand for packaged food.

    Market Highlights

    Author

    Priya Nagrale
    Senior Research Analyst

    She holds an experience of about 6+ years in market research and business consulting, working under the spectrum of information communication technology, telecommunications and semiconductor domains. aarti conceptualizes and implements a scalable business strategy and provides strategic leadership to the clients. her expertise lies in market estimation, competitive intelligence, pipeline analysis, customer assessment, etc.

    Leave a Comment

    Latest Comments

    John Doe

    This is a great article! Really helped me understand the topic better.

    Posted on July 23, 2025, 10:15 AM
    Jane Smith

    Thanks for sharing this. I’ve bookmarked it for later reference.

    Posted on July 22, 2025, 7:45 PM

    FAQs

    How much is the Extruded Plastics market?

    The Extruded Plastics Market size was valued at USD 240.22 Billion in 2023.

    What is the growth rate of the Extruded Plastics market?

    The extruded plastics market share is expected to increase and reach a market share value of USD 277.37 billion by the end of the forecast period in 2024.

    What is the growth rate of the Extruded Plastics market?

    The global market is projected to grow at a CAGR of 6.40% during the forecast period, 2024-2032.

    Which region held the largest market share in the Extruded Plastics market?

    Asia Pacific had the largest share of the Extruded Plastics Market.

    Who are the key players in the Extruded Plastics market?

    The key players in the market are DuPont de Nemours Inc. (US), Sigma Plastics Group (US), Exxon Mobil Corporation (US), Berry Global Inc. (US), SABIC (Saudi Arabia), Chevron Phillips Chemical Company (US), Saint-Gobain Performance Plastics (France), JM EAGLE INC. (US), Formosa Plastics Corporation (US), Bemis Company Inc. (US), Atlantis Plastics Inc. (US)

    Which Type led the Extruded Plastics market?

    The Low-Density Polyethylene categories dominated the market in 2023.

    Which Application led the Extruded Plastics market?

    The packaging had the largest share in the global market for Extruded Plastics.

    1. Table of Contents
    2. Executive Summary 15
      1. MARKET ATTRACTIVENESS ANALYSIS 17
        1. GLOBAL EXTRUDED PLASTICS MARKET, BY TYPE 17
        2. GLOBAL EXTRUDED PLASTICS MARKET, BY FORM 17
        3. GLOBAL EXTRUDED PLASTICS MARKET, BY END USE 18
        4. GLOBAL EXTRUDED PLASTICS MARKET, BY REGION 19
    3. Market Introduction 20
      1. DEFINITION 20
      2. Scope of the Study 20
      3. MARKET STRUCTURE 20
    4. Research Methodology 21
      1. RESEARCH PROCESS 21
      2. PRIMARY RESEARCH 22
      3. SECONDARY RESEARCH 23
      4. MARKET SIZE ESTIMATION 23
      5. TOP-DOWN AND Bottom-up Approach 24
      6. FORECAST MODEL 25
      7. LIST OF ASSUMPTIONS 26
    5. MARKET DYNAMICS 27
      1. INTRODUCTION 27
      2. DRIVERS 28
        1. USE OF EXTRUDED PLASTICS IN PACKAGING 28
        2. EXTENSIVE DEMAND FROM THE BUILDING & CONSTRUCTION INDUSTRY 28
        3. DRIVERS IMPACT ANALYSIS 29
      3. RESTRAINT 29
        1. VOLATILE RAW MATERIAL PRICES 29
        2. REGULATORY CONSTRAINTS 31
      4. OPPORTUNITY 31
        1. MICROBIAL DEGRADATION OF PLASTIC PRODUCTS 31
      5. TRENDS 32
        1. ADOPTION OF SUSTAINABLE FOOD PACKAGING 32
    6. MARKET FACTOR ANALYSIS 33
      1. GLOBAL EXTRUDED PLASTICS INDUSTRY OUTLOOK 33
      2. SUPPLY CHAIN ANALYSIS 34
        1. RAW MATERIALS SUPPLIERS 34
        2. EXTRUDED PLASTICS MANUFACTURERS 34
        3. DISTRIBUTION CHANNELS 35
        4. END USERS 35
      3. PORTER’S FIVE FORCES MODEL 35
        1. THREAT OF NEW ENTRANTS 36
        2. BARGAINING POWER OF SUPPLIERS 36
        3. THREAT OF SUBSTITUTES 36
        4. BARGAINING POWER OF BUYERS 36
        5. INTENSITY OF RIVALRY 36
      4. GLOBAL EXTRUDED PLASTICS MARKET, PRICING ANALYSIS (USD/KG) 37
      5. IMPACT OF THE COVID-19 OUTBREAK ON GLOBAL EXTRUDED PLASTICS MARKET 37
        1. PRODUCTION SCENARIO 37
        2. IMPACT ON SUPPLY CHAIN 37
        3. IMPACT ON SALES & DISTRIBUTION 38
        4. IMPACT ON EXTRUDED PLASTICSEND USES 38
    7. GLOBAL EXTRUDED PLASTICS MARKET, BY TYPE 39
      1. OVERVIEW 39
        1. EXTRUDED PLASTICS: MARKET ESTIMATES & FORECAST BY TYPE, 2023–2030 40
        2. EXTRUDED PLASTICS: MARKET ESTIMATES & FORECAST BY TYPE, 2023–2030 40
      2. LOW-DENSITY POLYETHYLENE (LDPE) 41
        1. LOW-DENSITY POLYETHYLENE (LDPE) MARKET ESTIMATES & FORECAST BY REGION,2023–2030 41
      3. HIGH-DENSITY POLYETHYLENE (HDPE) 42
        1. HIGH-DENSITY POLYETHYLENE (HDPE) MARKET ESTIMATES & FORECAST BY REGION, 2023–2030 42
      4. POLYPROPYLENE 43
        1. POLYPROPYLENEMARKET ESTIMATES & FORECAST BY REGION, 2023–2030 43
      5. POLYSTYRENE 44
        1. POLYSTYRENEMARKET ESTIMATES & FORECAST BY REGION, 2023–2030 44
      6. POLYVINYL CHLORIDE 45
        1. POLYVINYL CHLORIDEMARKET ESTIMATES & FORECAST BY REGION, 2023–2030 45
      7. ACRYLONITRILE BUTADIENE STYRENE 46
        1. ACRYLONITRILE BUTADIENE STYRENEMARKET ESTIMATES & FORECAST BY REGION, 2023–2030 46
      8. POLYCARBONATE 47
        1. POLYCARBONATEMARKET ESTIMATES & FORECAST BY REGION, 2023–2030 47
      9. OTHERS 48
        1. OTHER EXTRUDED PLASTICSMARKET ESTIMATES & FORECAST BY REGION, 2023–2030 48
    8. GLOBAL EXTRUDED PLASTICS MARKET, BY FORM 49
      1. OVERVIEW 49
        1. EXTRUDED PLASTICS: MARKET ESTIMATES & FORECAST BY TYPE, 2023–2030 50
        2. EXTRUDED PLASTICS: MARKET ESTIMATES & FORECAST BY TYPE, 2023–2030 50
      2. FILMS 51
        1. FILMSMARKET ESTIMATES & FORECAST BY REGION,2023–2030 51
      3. SHEETS 52
        1. SHEETSMARKET ESTIMATES & FORECAST BY REGION, 2023–2030 52
      4. PIPES & TUBES 53
        1. PIPES & TUBESMARKET ESTIMATES & FORECAST BY REGION, 2023–2030 53
      5. WIRES & CABLES 54
        1. WIRES & CABLESMARKET ESTIMATES & FORECAST BY REGION, 2023–2030 54
      6. OTHERS 55
        1. OTHER EXTRUDED PLASTICS MARKET ESTIMATES & FORECAST BY REGION, 2023–2030 55
    9. GLOBAL EXTRUDED PLASTICS MARKET, BY END USE 56
      1. OVERVIEW 56
        1. EXTRUDED PLASTICS: MARKET ESTIMATES & FORECAST BY END USE, 2023–2030 57
        2. EXTRUDED PLASTICS: MARKET ESTIMATES & FORECAST BY END USE, 2023–2030 57
      2. PACKAGING 58
        1. PACKAGING: MARKET ESTIMATES & FORECAST BY REGION, 2023–2030 58
        2. PACKAGING: MARKET ESTIMATES & FORECAST BY REGION, 2023–2030 59
      3. BUILDING & CONSTRUCTION 59
        1. BUILDING & CONSTRUCTION: MARKET ESTIMATES & FORECAST BY REGION, 2023–2030 60
        2. BUILDING & CONSTRUCTION: MARKET ESTIMATES & FORECAST BY REGION, 2023–2030 60
      4. AUTOMOTIVE 61
        1. AUTOMOTIVE: MARKET ESTIMATES & FORECAST BY REGION, 2023–2030 61
        2. AUTOMOTIVE: MARKET ESTIMATES & FORECAST BY REGION, 2023–2030 62
      5. CONSUMER GOODS 63
        1. CONSUMER GOODS: MARKET ESTIMATES & FORECAST BY REGION, 2023–2030 63
        2. CONSUMER GOODS: MARKET ESTIMATES & FORECAST BY REGION, 2023–2030 64
      6. ELECTRICAL & ELECTRONICS 64
        1. ELECTRICAL & ELECTRONICS: MARKET ESTIMATES & FORECAST BY REGION, 2023–2030 65
        2. ELECTRICAL & ELECTRONICS: MARKET ESTIMATES & FORECAST BY REGION, 2023–2030 65
      7. MEDICAL 66
        1. MEDICAL: MARKET ESTIMATES & FORECAST BY REGION, 2023–2030 66
        2. MEDICAL: MARKET ESTIMATES & FORECAST BY REGION, 2023–2030 67
      8. OTHERS 67
        1. OTHERS: MARKET ESTIMATES & FORECAST BY REGION, 2023–2030 68
        2. OTHERS: MARKET ESTIMATES & FORECAST BY REGION, 2023–2030 68
    10. GLOBAL EXTRUDED PLASTICS MARKET, BY REGION 69
      1. OVERVIEW 70
      2. NORTH AMERICA 71
        1. US 71
        2. CANADA 72
      3. EUROPE 72
        1. GERMANY 73
        2. UK 74
        3. FRANCE 74
        4. RUSSIA 75
        5. SPAIN 75
        6. REST OF EUROPE 76
      4. ASIA-PACIFIC 76
        1. CHINA 77
        2. JAPAN 77
        3. INDIA 78
        4. SOUTH KOREA 78
        5. AUSTRALIA & NEW ZEALAND 79
        6. REST OF ASIA-PACIFIC 79
      5. LATIN AMERICA 81
        1. BRAZIL 83
        2. MEXICO 84
        3. ARGENTINA 86
        4. REST OF LATIN AMERICA 87
      6. MIDDLE EAST & AFRICA 89
        1. GCC 91
        2. TURKEY 92
        3. SOUTH AFRICA 94
        4. REST OF MIDDLE EAST & AFRICA 95
    11. Competitive Landscape 97
      1. COMPETITIVEOVERVIEW 97
      2. MARKET STRATEGY ANALYSIS 97
      3. KEY DEVELOPMENTS 98
      4. COMPETITIVE BENCHMARKING 99
    12. COMPANY PROFILES 110
      1. BASF SE 110
        1. COMPANY OVERVIEW 110
        2. FINANCIAL OVERVIEW 111
        3. PRODUCTS OFFERED 111
        4. KEY DEVELOPMENTS 112
        5. SWOT ANALYSIS 112
        6. KEY STRATEGIES 112
      2. S H KELKAR AND COMPANY LIMITED 113
        1. COMPANY OVERVIEW 113
        2. FINANCIAL OVERVIEW 113
        3. PRODUCTS OFFERED 114
        4. KEY DEVELOPMENTS 114
        5. SWOT ANALYSIS 115
        6. KEY STRATEGIES 115
      3. GIVAUDAN 116
        1. COMPANY OVERVIEW 116
        2. FINANCIAL OVERVIEW 116
        3. PRODUCTS OFFERED 117
        4. KEY DEVELOPMENTS 117
        5. SWOT ANALYSIS 118
        6. KEY STRATEGIES 118
      4. KAO CORPORATION 119
        1. COMPANY OVERVIEW 119
        2. FINANCIAL OVERVIEW 119
        3. PRODUCTS OFFERED 111
        4. KEY DEVELOPMENTS 111
        5. SWOT ANALYSIS 111
        6. KEY STRATEGIES 111
      5. SYMRISE 112
        1. COMPANY OVERVIEW 112
        2. FINANCIAL OVERVIEW 112
        3. PRODUCTS OFFERED 113
        4. KEY DEVELOPMENTS 113
        5. SWOT ANALYSIS 114
        6. KEY STRATEGIES 114
      6. FINE CHEMICALS INC 115
        1. COMPANY OVERVIEW 115
        2. FINANCIAL OVERVIEW 115
        3. PRODUCTS OFFERED 115
        4. KEY DEVELOPMENTS 115
        5. SWOT ANALYSIS 116
        6. KEY STRATEGIES 116
      7. TAKASAGO INTERNATIONAL CORPORATION 117
        1. COMPANY OVERVIEW 117
        2. TAKASAGO INTERNATIONAL CORPORATION: FINANCIAL OVERVIEW 117
        3. PRODUCTS OFFERED 118
        4. KEY DEVELOPMENTS 118
        5. SWOT ANALYSIS 119
        6. KEY STRATEGIES 119
      8. INTERNATIONAL FLAVORS & FRAGRANCES 120
        1. COMPANY OVERVIEW 120
        2. INTERNATIONAL FLAVORS & FRAGRANCES: FINANCIAL OVERVIEW 120
        3. PRODUCTS OFFERED 121
        4. KEY DEVELOPMENTS 121
        5. SWOT ANALYSIS 121
        6. KEY STRATEGIES 122
      9. MERCK KGAA 123
        1. COMPANY OVERVIEW 123
        2. MERCK KGAA: FINANCIAL OVERVIEW 123
        3. PRODUCTS OFFERED 124
        4. KEY DEVELOPMENTS 124
        5. SWOT ANALYSIS 124
        6. KEY STRATEGIES 124
      10. SENSIENT TECHNOLOGIES 125
        1. COMPANY OVERVIEW 125
        2. FINANCIAL OVERVIEW 125
        3. PRODUCTS OFFERED 126
        4. KEY DEVELOPMENTS 126
        5. SWOT ANALYSIS 126
        6. KEY STRATEGIES 127
    13. List of Tables and Figures
      1. LIST OF TABLES
      2. TABLE 1 LIST OF ASSUMPTIONS 26
      3. TABLE 2 PRICING ANALYSIS (USD/KG) 37
      4. TABLE 3 EXTRUDED PLASTICS MARKET ESTIMATES & FORECAST, BY TYPE, 2023–2030 (USD MILLION) 40
      5. TABLE 4 EXTRUDED PLASTICS MARKET ESTIMATES & FORECAST, BY TYPE, 2023–2030 (KILO TONS) 40
      6. TABLE 5 LOW-DENSITY POLYETHYLENE (LDPE)EXTRUDED PLASTICS MARKET ESTIMATES & FORECAST, BY REGION, 2023–2030 (USD MILLION) 41
      7. TABLE 6 LOW-DENSITY POLYETHYLENE (LDPE)EXTRUDED PLASTICS STIMATES & FORECAST, BY REGION, 2023–2030 (KILO TONS) 41
      8. TABLE 7 HIGH-DENSITY POLYETHYLENE (HDPE)EXTRUDED PLASTICSS MARKET ESTIMATES & FORECAST, BY REGION, 2023–2030 (USD MILLION) 41
      9. TABLE 8 HIGH-DENSITY POLYETHYLENE (HDPE)EXTRUDED PLASTICSS MARKET ESTIMATES & FORECAST, BY REGION, 2023–2030 (KILO TONS) 42
      10. TABLE 9 POLYPROPYLENEEXTRUDED PLASTICSS MARKET ESTIMATES & FORECAST, BY REGION, 2023–2030 (USD MILLION) 42
      11. TABLE 10 POLYPROPYLENEEXTRUDED PLASTICSS MARKET ESTIMATES & FORECAST, BY REGION, 2023–2030 (KILO TONS) 42
      12. TABLE 11 POLYSTYRENE EXTRUDED PLASTICSS MARKET ESTIMATES & FORECAST, BY REGION, 2023–2030 (USD MILLION) 43
      13. TABLE 12 POLYSTYRENEEXTRUDED PLASTICSS MARKET ESTIMATES & FORECAST, BY REGION, 2023–2030 (KILO TONS) 43
      14. TABLE 13 POLYVINYL CHLORIDE EXTRUDED PLASTICSS MARKET ESTIMATES & FORECAST, BY REGION, 2023–2030 (USD MILLION) 43
      15. TABLE 14 POLYVINYL CHLORIDE EXTRUDED PLASTICSS MARKET ESTIMATES & FORECAST, BY REGION, 2023–2030 (KILO TONS) 44
      16. TABLE 15 ACRYLONITRILE BUTADIENE STYRENE EXTRUDED PLASTICSS MARKET ESTIMATES & FORECAST, BY REGION, 2023–2030 (USD MILLION) 44
      17. TABLE 16 ACRYLONITRILE BUTADIENE STYRENE EXTRUDED PLASTICSS MARKET ESTIMATES & FORECAST, BY REGION, 2023–2030 (KILO TONS) 44
      18. TABLE 17 POLYCARBONATE EXTRUDED PLASTICSS MARKET ESTIMATES & FORECAST, BY REGION, 2023–2030 (USD MILLION) 45
      19. TABLE 18 POLYCARBONATE EXTRUDED PLASTICSS MARKET ESTIMATES & FORECAST, BY REGION, 2023–2030 (KILO TONS) 45
      20. TABLE 19 OTHERSEXTRUDED PLASTICSS MARKET ESTIMATES & FORECAST, BY REGION, 2023–2030 (USD MILLION) 45
      21. TABLE 20 OTHERSEXTRUDED PLASTICSS MARKET ESTIMATES & FORECAST, BY REGION, 2023–2030 (KILO TONS) 46
      22. TABLE 21 EXTRUDED PLASTICS MARKET ESTIMATES & FORECAST, BY FORM, 2023–2030 (USD MILLION) 46
      23. TABLE 22 EXTRUDED PLASTICS MARKET ESTIMATES & FORECAST, BY FORM, 2023–2030 (KILO TONS) 46
      24. TABLE 23 FILMSMARKET ESTIMATES & FORECAST, BY REGION, 2023–2030 (USD MILLION) 47
      25. TABLE 24 FILMSMARKET ESTIMATES & FORECAST, BY REGION, 2023–2030 (MILLION SQUARE METER) 47
      26. TABLE 25 SHEETSMARKET ESTIMATES & FORECAST, BY REGION, 2023–2030 (USD MILLION) 47
      27. TABLE 26 SHEETSMARKET ESTIMATES & FORECAST, BY REGION, 2023–2030 (MILLION SQUARE METER) 48
      28. TABLE 27 PIPES & TUBESMARKET ESTIMATES & FORECAST, BY REGION, 2023–2030 (USD MILLION) 48
      29. TABLE 28 PIPES & TUBESMARKET ESTIMATES & FORECAST, BY REGION, 2023–2030 (MILLION SQUARE METER) 48
      30. TABLE 29 WIRES & CABLES MARKET ESTIMATES & FORECAST, BY REGION, 2023–2030 (USD MILLION) 49
      31. TABLE 30 WIRES & CABLES MARKET ESTIMATES & FORECAST, BY REGION, 2023–2030 (MILLION SQUARE METER) 49
      32. TABLE 31 OTHERS MARKET ESTIMATES & FORECAST, BY REGION, 2023–2030 (USD MILLION) 49
      33. TABLE 32 OTHERS MARKET ESTIMATES & FORECAST, BY REGION, 2023–2030 (MILLION SQUARE METER) 50
      34. TABLE 33 EXTRUDED PLASTICS MARKET ESTIMATES & FORECAST, BY END USE, 2023–2030 (USD MILLION) 50
      35. TABLE 34 EXTRUDED PLASTICS MARKET ESTIMATES & FORECAST, BY END USE, 2023–2030 (KILO TONS) 50
      36. TABLE 35 PACKAGING MARKET ESTIMATES & FORECAST, BY REGION, 2023–2030 (USD MILLION) 51
      37. TABLE 36 PACKAGING MARKET ESTIMATES & FORECAST, BY REGION, 2023–2030 (MILLION SQUARE METER) 51
      38. TABLE 37 BUILDING & CONSTRUCTION MARKET ESTIMATES & FORECAST, BY REGION, 2023–2030 (USD MILLION) 51
      39. TABLE 38 BUILDING & CONSTRUCTION MARKET ESTIMATES & FORECAST, BY REGION, 2023–2030 (MILLION SQUARE METER) 52
      40. TABLE 39 AUTOMOTIVE MARKET ESTIMATES & FORECAST, BY REGION, 2023–2030 (USD MILLION) 52
      41. TABLE 40 AUTOMOTIVE MARKET ESTIMATES & FORECAST, BY REGION, 2023–2030 (MILLION SQUARE METER) 52
      42. TABLE 41 CONSUMER GOODS MARKET ESTIMATES & FORECAST, BY REGION, 2023–2030 (USD MILLION) 53
      43. TABLE 42 CONSUMER GOODS MARKET ESTIMATES & FORECAST, BY REGION, 2023–2030 (MILLION SQUARE METER) 53
      44. TABLE 43 ELECTRICAL & ELECTRONICSMARKET ESTIMATES & FORECAST, BY REGION, 2023–2030 (USD MILLION) 53
      45. TABLE 44 ELECTRICAL & ELECTRONICS MARKET ESTIMATES & FORECAST, BY REGION, 2023–2030 (MILLION SQUARE METER) 54
      46. TABLE 45 MEDICAL MARKET ESTIMATES & FORECAST, BY REGION, 2023–2030 (USD MILLION) 54
      47. TABLE 46 MEDICAL MARKET ESTIMATES & FORECAST, BY REGION, 2023–2030 (MILLION SQUARE METER) 54
      48. TABLE 47 OTHERS MARKET ESTIMATES & FORECAST, BY REGION, 2023–2030 (USD MILLION) 55
      49. TABLE 48 OTHERS MARKET ESTIMATES & FORECAST, BY REGION, 2023–2030 (MILLION SQUARE METER) 55
      50. TABLE 49 GLOBAL EXTRUDED PLASTICS MARKET, BY REGION, 2023–2030 (USD MILLION) 55
      51. TABLE 50 GLOBAL EXTRUDED PLASTICS MARKET, BY REGION, 2023–2030 (KILO TONS) 56
      52. TABLE 51 NORTH AMERICA: EXTRUDED PLASTICS MARKET, BY COUNTRY, 2023–2030 (USD MILLION) 56
      53. TABLE 52 NORTH AMERICA: EXTRUDED PLASTICS MARKET, BY COUNTRY, 2023–2030 (KILO TONS) 56
      54. TABLE 53 NORTH AMERICA: EXTRUDED PLASTICS MARKET, BY TYPE, 2023–2030 (USD MILLION) 57
      55. TABLE 54 NORTH AMERICA: EXTRUDED PLASTICS MARKET, BY TYPE, 2023–2030 (KILO TONS) 57
      56. TABLE 55 NORTH AMERICA: EXTRUDED PLASTICS MARKET, BY FORM, 2023–2030 (USD MILLION) 57
      57. TABLE 56 NORTH AMERICA: EXTRUDED PLASTICS MARKET, BY FORM, 2023–2030 (KILO TONS) 58
      58. TABLE 57 NORTH AMERICA: EXTRUDED PLASTICS MARKET, BY END USE, 2023–2030 (USD MILLION) 58
      59. TABLE 58 NORTH AMERICA: EXTRUDED PLASTICS MARKET, BY END USE, 2023–2030 (KILO TONS) 58
      60. TABLE 59 US: EXTRUDED PLASTICS MARKET, BY TYPE, 2023–2030 (USD MILLION) 59
      61. TABLE 60 US: EXTRUDED PLASTICS MARKET, BY TYPE, 2023–2030 (KILO TONS) 59
      62. TABLE 61 US: EXTRUDED PLASTICS MARKET, BY FORM, 2023–2030 (USD MILLION) 59
      63. TABLE 62 US: EXTRUDED PLASTICS MARKET, BY FORM, 2023–2030 (KILO TONS) 60
      64. TABLE 63 US: EXTRUDED PLASTICS MARKET, BY END USE, 2023–2030 (USD MILLION) 60
      65. TABLE 64 US: EXTRUDED PLASTICS MARKET, BY END USE, 2023–2030 (KILO TONS) 60
      66. TABLE 65 CANADA: EXTRUDED PLASTICS MARKET, BY TYPE, 2023–2030 (USD MILLION) 61
      67. TABLE 66 CANADA: EXTRUDED PLASTICS MARKET, BY TYPE, 2023–2030 (KILO TONS) 61
      68. TABLE 67 CANADA: EXTRUDED PLASTICS MARKET, BY FORM, 2023–2030 (USD MILLION) 61
      69. TABLE 68 CANADA: EXTRUDED PLASTICS MARKET, BY FORM, 2023–2030 (KILO TONS) 62
      70. TABLE 69 CANADA: EXTRUDED PLASTICS MARKET, BY END USE, 2023–2030 (USD MILLION) 62
      71. TABLE 70 CANADA: EXTRUDED PLASTICS MARKET, BY END USE, 2023–2030 (KILO TONS) 62
      72. TABLE 71 EUROPE: EXTRUDED PLASTICS MARKET, BY COUNTRY, 2023–2030 (USD MILLION) 63
      73. TABLE 72 EUROPE: EXTRUDED PLASTICS MARKET, BY COUNTRY, 2023–2030 (KILO TONS) 63
      74. TABLE 73 EUROPE: EXTRUDED PLASTICS MARKET, BY TYPE, 2023–2030 (USD MILLION) 63
      75. TABLE 74 EUROPE: EXTRUDED PLASTICS MARKET, BY TYPE, 2023–2030 (KILO TONS) 64
      76. TABLE 75 EUROPE: EXTRUDED PLASTICS MARKET, BY FORM, 2023–2030 (USD MILLION) 64
      77. TABLE 76 EUROPE: EXTRUDED PLASTICS MARKET, BY FORM, 2023–2030 (KILO TONS) 64
      78. TABLE 77 EUROPE: EXTRUDED PLASTICS MARKET, BY END USE, 2023–2030 (USD MILLION) 65
      79. TABLE 78 EUROPE: EXTRUDED PLASTICS MARKET, BY END USE, 2023–2030 (KILO TONS) 65
      80. TABLE 79 GERMANY: EXTRUDED PLASTICS MARKET, BY TYPE, 2023–2030 (USD MILLION) 65
      81. TABLE 80 GERMANY: EXTRUDED PLASTICS MARKET, BY TYPE, 2023–2030 (KILO TONS) 66
      82. TABLE 81 GERMANY: EXTRUDED PLASTICS MARKET, BY FORM, 2023–2030 (USD MILLION) 66
      83. TABLE 82 GERMANY: EXTRUDED PLASTICS MARKET, BY FORM, 2023–2030 (KILO TONS) 66
      84. TABLE 83 GERMANY: EXTRUDED PLASTICS MARKET, BY END USE, 2023–2030 (USD MILLION) 67
      85. TABLE 84 GERMANY: EXTRUDED PLASTICS MARKET, BY END USE, 2023–2030 (KILO TONS) 67
      86. TABLE 85 UK: EXTRUDED PLASTICS MARKET, BY TYPE, 2023–2030 (USD MILLION) 67
      87. TABLE 86 UK: EXTRUDED PLASTICS MARKET, BY TYPE, 2023–2030 (KILO TONS) 68
      88. TABLE 87 UK: EXTRUDED PLASTICS MARKET, BY FORM, 2023–2030 (USD MILLION) 68
      89. TABLE 88 UK: EXTRUDED PLASTICS MARKET, BY FORM, 2023–2030 (KILO TONS) 68
      90. TABLE 89 UK: EXTRUDED PLASTICS MARKET, BY END USE, 2023–2030 (USD MILLION) 69
      91. TABLE 90 UK: EXTRUDED PLASTICS MARKET, BY END USE, 2023–2030 (KILO TONS) 69
      92. TABLE 91 FRANCE: EXTRUDED PLASTICS MARKET, BY TYPE, 2023–2030 (USD MILLION) 69
      93. TABLE 92 FRANCE: EXTRUDED PLASTICS MARKET, BY TYPE, 2023–2030 (KILO TONS) 70
      94. TABLE 93 FRANCE: EXTRUDED PLASTICS MARKET, BY FORM, 2023–2030 (USD MILLION) 70
      95. TABLE 94 FRANCE: EXTRUDED PLASTICS MARKET, BY FORM, 2023–2030 (KILO TONS) 70
      96. TABLE 95 FRANCE: EXTRUDED PLASTICS MARKET, BY END USE, 2023–2030 (USD MILLION) 71
      97. TABLE 96 FRANCE: EXTRUDED PLASTICS MARKET, BY END USE, 2023–2030 (KILO TONS) 71
      98. TABLE 97 RUSSIA: EXTRUDED PLASTICS MARKET, BY TYPE, 2023–2030 (USD MILLION) 71
      99. TABLE 98 RUSSIA: EXTRUDED PLASTICS MARKET, BY TYPE, 2023–2030 (KILO TONS) 72
      100. TABLE 99 RUSSIA: EXTRUDED PLASTICS MARKET, BY FORM, 2023–2030 (USD MILLION) 72
      101. TABLE 100 RUSSIA: EXTRUDED PLASTICS MARKET, BY FORM, 2023–2030 (KILO TONS) 72
      102. TABLE 101 RUSSIA: EXTRUDED PLASTICS MARKET, BY END USE, 2023–2030 (USD MILLION) 73
      103. TABLE 102 RUSSIA: EXTRUDED PLASTICS MARKET, BY END USE, 2023–2030 (KILO TONS) 73
      104. TABLE 103 SPAIN: EXTRUDED PLASTICS MARKET, BY TYPE, 2023–2030 (USD MILLION) 74
      105. TABLE 104 SPAIN: EXTRUDED PLASTICS MARKET, BY TYPE, 2023–2030 (KILO TONS) 74
      106. TABLE 105 SPAIN: EXTRUDED PLASTICS MARKET, BY FORM, 2023–2030 (USD MILLION) 74
      107. TABLE 106 SPAIN: EXTRUDED PLASTICS MARKET, BY FORM, 2023–2030 (KILO TONS) 75
      108. TABLE 107 SPAIN: EXTRUDED PLASTICS MARKET, BY END USE, 2023–2030 (USD MILLION) 75
      109. TABLE 108 SPAIN: EXTRUDED PLASTICS MARKET, BY END USE, 2023–2030 (KILO TONS) 75
      110. TABLE 109 REST OF EUROPE: EXTRUDED PLASTICS MARKET, BY TYPE, 2023–2030 (USD MILLION) 76
      111. TABLE 110 REST OF EUROPE: EXTRUDED PLASTICS MARKET, BY TYPE, 2023–2030 (KILO TONS) 76
      112. TABLE 111 REST OF EUROPE: EXTRUDED PLASTICS MARKET, BY FORM, 2023–2030 (USD MILLION) 76
      113. TABLE 112 REST OF EUROPE: EXTRUDED PLASTICS MARKET, BY FORM, 2023–2030 (KILO TONS) 77
      114. TABLE 113 REST OF EUROPE: EXTRUDED PLASTICS MARKET, BY END USE, 2023–2030 (USD MILLION) 77
      115. TABLE 114 REST OF EUROPE: EXTRUDED PLASTICS MARKET, BY END USE, 2023–2030 (KILO TONS) 77
      116. TABLE 115 ASIA-PACIFIC: EXTRUDED PLASTICS MARKET, BY COUNTRY, 2023–2030 (USD MILLION) 78
      117. TABLE 116 ASIA-PACIFIC: EXTRUDED PLASTICS MARKET, BY COUNTRY, 2023–2030 (KILO TONS) 78
      118. TABLE 117 ASIA-PACIFIC: EXTRUDED PLASTICS MARKET, BY TYPE, 2023–2030 (USD MILLION) 78
      119. TABLE 118 ASIA-PACIFIC: EXTRUDED PLASTICS MARKET, BY TYPE, 2023–2030 (KILO TONS) 79
      120. TABLE 119 ASIA-PACIFIC: EXTRUDED PLASTICS MARKET, BY FORM, 2023–2030 (USD MILLION) 79
      121. TABLE 120 ASIA-PACIFIC: EXTRUDED PLASTICS MARKET, BY FORM, 2023–2030 (KILO TONS) 79
      122. TABLE 121 ASIA-PACIFIC: EXTRUDED PLASTICS MARKET, BY END USE, 2023–2030 (USD MILLION) 80
      123. TABLE 122 ASIA-PACIFIC: EXTRUDED PLASTICS MARKET, BY END USE, 2023–2030 (KILO TONS) 80
      124. TABLE 123 CHINA: EXTRUDED PLASTICS MARKET, BY TYPE, 2023–2030 (USD MILLION) 80
      125. TABLE 124 CHINA: EXTRUDED PLASTICS MARKET, BY TYPE, 2023–2030 (KILO TONS) 81
      126. TABLE 125 CHINA: EXTRUDED PLASTICS MARKET, BY FORM, 2023–2030 (USD MILLION) 81
      127. TABLE 126 CHINA: EXTRUDED PLASTICS MARKET, BY FORM, 2023–2030 (KILO TONS) 81
      128. TABLE 127 CHINA: EXTRUDED PLASTICS MARKET, BY END USE, 2023–2030 (USD MILLION) 82
      129. TABLE 128 CHINA: EXTRUDED PLASTICS MARKET, BY END USE, 2023–2030 (KILO TONS) 82
      130. TABLE 129 JAPAN: EXTRUDED PLASTICS MARKET, BY TYPE, 2023–2030 (USD MILLION) 82
      131. TABLE 130 JAPAN: EXTRUDED PLASTICS MARKET, BY TYPE, 2023–2030 (KILO TONS) 83
      132. TABLE 131 JAPAN: EXTRUDED PLASTICS MARKET, BY FORM, 2023–2030 (USD MILLION) 83
      133. TABLE 132 JAPAN: EXTRUDED PLASTICS MARKET, BY FORM, 2023–2030 (KILO TONS) 83
      134. TABLE 133 JAPAN: EXTRUDED PLASTICS MARKET, BY END USE, 2023–2030 (USD MILLION) 84
      135. TABLE 134 JAPAN: EXTRUDED PLASTICS MARKET, BY END USE, 2023–2030 (KILO TONS) 84
      136. TABLE 135 INDIA: EXTRUDED PLASTICS MARKET, BY TYPE, 2023–2030 (USD MILLION) 84
      137. TABLE 136 INDIA: EXTRUDED PLASTICS MARKET, BY TYPE, 2023–2030 (KILO TONS) 85
      138. TABLE 137 INDIA: EXTRUDED PLASTICS MARKET, BY FORM, 2023–2030 (USD MILLION) 85
      139. TABLE 138 INDIA: EXTRUDED PLASTICS MARKET, BY FORM, 2023–2030 (KILO TONS) 85
      140. TABLE 139 INDIA: EXTRUDED PLASTICS MARKET, BY END USE, 2023–2030 (USD MILLION) 86
      141. TABLE 140 INDIA: EXTRUDED PLASTICS MARKET, BY END USE, 2023–2030 (KILO TONS) 86
      142. TABLE 141 SOUTH KOREA: EXTRUDED PLASTICS MARKET, BY TYPE, 2023–2030 (USD MILLION) 86
      143. TABLE 142 SOUTH KOREA: EXTRUDED PLASTICS MARKET, BY TYPE, 2023–2030 (KILO TONS) 87
      144. TABLE 143 SOUTH KOREA: EXTRUDED PLASTICS MARKET, BY FORM, 2023–2030 (USD MILLION) 87
      145. TABLE 144 SOUTH KOREA: EXTRUDED PLASTICS MARKET, BY FORM, 2023–2030 (KILO TONS) 87
      146. TABLE 145 SOUTH KOREA: EXTRUDED PLASTICS MARKET, BY END USE, 2023–2030 (USD MILLION) 88
      147. TABLE 146 SOUTH KOREA: EXTRUDED PLASTICS MARKET, BY END USE, 2023–2030 (KILO TONS) 88
      148. TABLE 147 AUSTRALIA & NEW ZEALAND: EXTRUDED PLASTICS MARKET, BY TYPE, 2023–2030 (USD MILLION) 88
      149. TABLE 148 AUSTRALIA & NEW ZEALAND: EXTRUDED PLASTICS MARKET, BY TYPE, 2023–2030 (KILO TONS) 89
      150. TABLE 149 AUSTRALIA & NEW ZEALAND: EXTRUDED PLASTICS MARKET, BY FORM, 2023–2030 (USD MILLION) 89
      151. TABLE 150 AUSTRALIA & NEW ZEALAND: EXTRUDED PLASTICS MARKET, BY FORM, 2023–2030 (KILO TONS) 89
      152. TABLE 151 AUSTRALIA & NEW ZEALAND: EXTRUDED PLASTICS MARKET, BY END USE, 2023–2030 (USD MILLION) 90
      153. TABLE 152 AUSTRALIA & NEW ZEALAND: EXTRUDED PLASTICS MARKET, BY END USE, 2023–2030 (KILO TONS) 90
      154. TABLE 153 REST OF ASIA-PACIFIC: EXTRUDED PLASTICS MARKET, BY TYPE, 2023–2030 (USD MILLION) 90
      155. TABLE 154 REST OF ASIA-PACIFIC: EXTRUDED PLASTICS MARKET, BY TYPE, 2023–2030 (KILO TONS) 91
      156. TABLE 155 REST OF ASIA-PACIFIC: EXTRUDED PLASTICS MARKET, BY FORM, 2023–2030 (USD MILLION) 91
      157. TABLE 156 REST OF ASIA-PACIFIC: EXTRUDED PLASTICS MARKET, BY FORM, 2023–2030 (KILO TONS) 91
      158. TABLE 157 REST OF ASIA-PACIFIC: EXTRUDED PLASTICS MARKET, BY END USE, 2023–2030 (USD MILLION) 92
      159. TABLE 158 REST OF ASIA-PACIFIC: EXTRUDED PLASTICS MARKET, BY END USE, 2023–2030 (KILO TONS) 92
      160. TABLE 159 LATIN AMERICA: EXTRUDED PLASTICS MARKET, BY COUNTRY, 2023–2030 (USD MILLION) 92
      161. TABLE 160 LATIN AMERICA: EXTRUDED PLASTICS MARKET, BY COUNTRY, 2023–2030 (KILO TONS) 93
      162. TABLE 161 LATIN AMERICA: EXTRUDED PLASTICS MARKET, BY TYPE, 2023–2030 (USD MILLION) 93
      163. TABLE 162 LATIN AMERICA: EXTRUDED PLASTICS MARKET, BY TYPE, 2023–2030 (KILO TONS) 94
      164. TABLE 163 LATIN AMERICA: EXTRUDED PLASTICS MARKET, BY FORM, 2023–2030 (USD MILLION) 94
      165. TABLE 164 LATIN AMERICA: EXTRUDED PLASTICS MARKET, BY FORM, 2023–2030 (KILO TONS) 94
      166. TABLE 165 LATIN AMERICA: EXTRUDED PLASTICS MARKET, BY END USE, 2023–2030 (USD MILLION) 95
      167. TABLE 166 LATIN AMERICA: EXTRUDED PLASTICS MARKET, BY END USE, 2023–2030 (KILO TONS) 95
      168. TABLE 167 BRAZIL: EXTRUDED PLASTICS MARKET, BY TYPE, 2023–2030 (USD MILLION) 95
      169. TABLE 168 BRAZIL: EXTRUDED PLASTICS MARKET, BY TYPE, 2023–2030 (KILO TONS) 96
      170. TABLE 169 BRAZIL: EXTRUDED PLASTICS MARKET, BY FORM, 2023–2030 (USD MILLION) 96
      171. TABLE 170 BRAZIL: EXTRUDED PLASTICS MARKET, BY FORM, 2023–2030 (KILO TONS) 96
      172. TABLE 171 BRAZIL: EXTRUDED PLASTICS MARKET, BY END USE, 2023–2030 (USD MILLION) 97
      173. TABLE 172 BRAZIL: EXTRUDED PLASTICS MARKET, BY END USE, 2023–2030 (KILO TONS) 97
      174. TABLE 173 MEXICO: EXTRUDED PLASTICS MARKET, BY TYPE, 2023–2030 (USD MILLION) 97
      175. TABLE 174 MEXICO: EXTRUDED PLASTICS MARKET, BY TYPE, 2023–2030 (KILO TONS) 98
      176. TABLE 175 MEXICO: EXTRUDED PLASTICS MARKET, BY FORM, 2023–2030 (USD MILLION) 98
      177. TABLE 176 MEXICO: EXTRUDED PLASTICS MARKET, BY FORM, 2023–2030 (KILO TONS) 98
      178. TABLE 177 MEXICO: EXTRUDED PLASTICS MARKET, BY END USE, 2023–2030 (USD MILLION) 99
      179. TABLE 178 MEXICO: EXTRUDED PLASTICS MARKET, BY END USE, 2023–2030 (KILO TONS) 99
      180. TABLE 179 ARGENTINA: EXTRUDED PLASTICS MARKET, BY TYPE, 2023–2030 (USD MILLION) 99
      181. TABLE 180 ARGENTINA: EXTRUDED PLASTICS MARKET, BY TYPE, 2023–2030 (KILO TONS) 100
      182. TABLE 181 ARGENTINA: EXTRUDED PLASTICS MARKET, BY FORM, 2023–2030 (USD MILLION) 100
      183. TABLE 182 ARGENTINA: EXTRUDED PLASTICS MARKET, BY FORM, 2023–2030 (KILO TONS) 100
      184. TABLE 183 ARGENTINA: EXTRUDED PLASTICS MARKET, BY END USE, 2023–2030 (USD MILLION) 101
      185. TABLE 184 ARGENTINA: EXTRUDED PLASTICS MARKET, BY END USE, 2023–2030 (KILO TONS) 101
      186. TABLE 185 REST OF LATIN AMERICA: EXTRUDED PLASTICS MARKET, BY TYPE, 2023–2030 (USD MILLION) 101
      187. TABLE 186 REST OF LATIN AMERICA: EXTRUDED PLASTICS MARKET, BY TYPE, 2023–2030 (KILO TONS) 102
      188. TABLE 187 REST OF LATIN AMERICA: EXTRUDED PLASTICS MARKET, BY FORM, 2023–2030 (USD MILLION) 102
      189. TABLE 188 REST OF LATIN AMERICA: EXTRUDED PLASTICS MARKET, BY FORM, 2023–2030 (KILO TONS) 102
      190. TABLE 186 REST OF LATIN AMERICA: EXTRUDED PLASTICS MARKET, BY END USE, 2023–2030 (USD MILLION) 103
      191. TABLE 187 REST OF LATIN AMERICA: EXTRUDED PLASTICS MARKET, BY END USE, 2023–2030 (KILO TONS) 103
      192. TABLE 188 MIDDLE EAST & AFRICA: EXTRUDED PLASTICS MARKET, BY COUNTRY, 2023–2030 (USD MILLION) 104
      193. TABLE 189 MIDDLE EAST & AFRICA: EXTRUDED PLASTICS MARKET, BY COUNTRY, 2023–2030 (KILO TONS) 104
      194. TABLE 190 MIDDLE EAST & AFRICA: EXTRUDED PLASTICS MARKET, BY TYPE, 2023–2030 (USD MILLION) 104
      195. TABLE 191 MIDDLE EAST & AFRICA: EXTRUDED PLASTICS MARKET, BY TYPE, 2023–2030 (KILO TONS) 105
      196. TABLE 192 MIDDLE EAST & AFRICA: EXTRUDED PLASTICS MARKET, BY FORM, 2023–2030 (USD MILLION) 105
      197. TABLE 193 MIDDLE EAST & AFRICA: EXTRUDED PLASTICS MARKET, BY FORM, 2023–2030 (KILO TONS) 105
      198. TABLE 194 MIDDLE EAST & AFRICA: EXTRUDED PLASTICS MARKET, BY END USE, 2023–2030 (USD MILLION) 106
      199. TABLE 195 MIDDLE EAST & AFRICA: EXTRUDED PLASTICS MARKET, BY END USE, 2023–2030 (KILO TONS) 106
      200. TABLE 196 GCC: EXTRUDED PLASTICS MARKET, BY TYPE, 2023–2030 (USD MILLION) 107
      201. TABLE 197 GCC: EXTRUDED PLASTICS MARKET, BY TYPE, 2023–2030 (KILO TONS) 107
      202. TABLE 198 GCC: EXTRUDED PLASTICS MARKET, BY FORM, 2023–2030 (USD MILLION) 107
      203. TABLE 199 GCC: EXTRUDED PLASTICS MARKET, BY FORM, 2023–2030 (KILO TONS) 108
      204. TABLE 200 GCC: EXTRUDED PLASTICS MARKET, BY END USE, 2023–2030 (USD MILLION) 108
      205. TABLE 201 GCC: EXTRUDED PLASTICS MARKET, BY END USE, 2023–2030 (KILO TONS) 108
      206. TABLE 202 TURKEY: EXTRUDED PLASTICS MARKET, BY TYPE, 2023–2030 (USD MILLION) 109
      207. TABLE 203 TURKEY: EXTRUDED PLASTICS MARKET, BY TYPE, 2023–2030 (KILO TONS) 109
      208. TABLE 204 TURKEY: EXTRUDED PLASTICS MARKET, BY FORM, 2023–2030 (USD MILLION) 109
      209. TABLE 205 TURKEY: EXTRUDED PLASTICS MARKET, BY FORM, 2023–2030 (KILO TONS) 110
      210. TABLE 206 TURKEY: EXTRUDED PLASTICS MARKET, BY END USE, 2023–2030 (USD MILLION) 110
      211. TABLE 207 TURKEY: EXTRUDED PLASTICS MARKET, BY END USE, 2023–2030 (KILO TONS) 110
      212. TABLE 208 SOUTH AFRICA: EXTRUDED PLASTICS MARKET, BY TYPE, 2023–2030 (USD MILLION) 111
      213. TABLE 209 SOUTH AFRICA: EXTRUDED PLASTICS MARKET, BY TYPE, 2023–2030 (KILO TONS) 111
      214. TABLE 210 SOUTH AFRICA: EXTRUDED PLASTICS MARKET, BY FORM, 2023–2030 (USD MILLION) 111
      215. TABLE 211 SOUTH AFRICA: EXTRUDED PLASTICS MARKET, BY FORM, 2023–2030 (KILO TONS) 112
      216. TABLE 212 SOUTH AFRICA: EXTRUDED PLASTICS MARKET, BY END USE, 2023–2030 (USD MILLION) 112
      217. TABLE 213 SOUTH AFRICA: EXTRUDED PLASTICS MARKET, BY END USE, 2023–2030 (KILO TONS) 112
      218. TABLE 214 REST OF MIDDLE EAST & AFRICA: EXTRUDED PLASTICS MARKET, BY TYPE, 2023–2030 (USD MILLION) 113
      219. TABLE 215 REST OF MIDDLE EAST & AFRICA: EXTRUDED PLASTICS MARKET, BY TYPE, 2023–2030 (KILO TONS) 113
      220. TABLE 216 REST OF MIDDLE EAST & AFRICA: EXTRUDED PLASTICS MARKET, BY FORM, 2023–2030 (USD MILLION) 113
      221. TABLE 217 REST OF MIDDLE EAST & AFRICA: EXTRUDED PLASTICS MARKET, BY FORM, 2023–2030 (KILO TONS) 114
      222. TABLE 218 REST OF MIDDLE EAST & AFRICA: EXTRUDED PLASTICS MARKET, BY END USE, 2023–2030 (USD MILLION) 114
      223. TABLE 219 REST OF MIDDLE EAST & AFRICA: EXTRUDED PLASTICS MARKET, BY END USE, 2023–2030 (KILO TONS) 114
      224. TABLE 220 KEY DEVELOPMENTS 115
      225. TABLE 221 AMCOR PLC: PRODUCTS OFFERED 115
      226. TABLE 222 BERRY GLOBAL INC.: PRODUCTS OFFERED 115
      227. TABLE 223 SAUDI BASIC INDUSTRIES CORPORATION (SABIC): PRODUCTS OFFERED 117
      228. TABLE 224 SAUDI BASIC INDUSTRIES CORPORATION (SABIC): KEY DEVELOPMENTS 117
      229. TABLE 225 DUPONT DE NEMOURS, INC.: PRODUCTS OFFERED 111
      230. TABLE 226 EXXON MOBIL CORPORATION PRODUCTS OFFERED 113
      231. TABLE 227 EXXON MOBIL CORPORATION: KEY DEVELOPMENTS 113
      232. TABLE 228 SAINT-GOBAIN: PRODUCTS OFFERED 115
      233. TABLE 229 FORMOSA PLASTICS CORPORATION: PRODUCTS OFFERED 118
      234. TABLE 230 CHEVRON PHILLIPS CHEMICAL COMPANY: PRODUCTS OFFERED 121
      235. TABLE 231 ATLANTIS PLASTICS, INC.: PRODUCTS OFFERED 124
      236. TABLE 232 SIGMA PLASTICS GROUP: PRODUCTS OFFERED 126
      237. TABLE 233 SIGMA PLASTICS GROUP: KEY DEVELOPMENTS 126   LIST OF FIGURES
      238. FIGURE 1 MARKET SYNOPSIS 16
      239. FIGURE 2 GLOBAL EXTRUDED PLASTICS MARKET ANALYSIS BY TYPE, 2019 17
      240. FIGURE 2 GLOBAL EXTRUDED PLASTICS MARKET ANALYSIS BY FORM, 2019 17
      241. FIGURE 3 GLOBAL EXTRUDED PLASTICS MARKET ANALYSIS BY END USE, 2019 18
      242. FIGURE 4 GLOBAL EXTRUDED PLASTICS MARKET ANALYSIS BY REGION 19
      243. FIGURE 5 GLOBAL EXTRUDED PLASTICS MARKET: MARKET STRUCTURE 20
      244. FIGURE 6 RESEARCH PROCESS OF MRFR 21
      245. FIGURE 7 MARKET DYNAMICS OF THE GLOBAL EXTRUDED PLASTICS MARKET 27
      246. FIGURE 8 GLOBAL PACKAGING INDUSTRY, 2015–2023 28
      247. FIGURE 9 DRIVERS IMPACT ANALYSIS: GLOBAL EXTRUDED PLASTICS MARKET 29
      248. FIGURE 10 CRUDE OIL PRICES USD PER BARREL (2014–2019) 30

    Extruded Plastics Market Segmentation

    Market Segmentation Overview

    • Detailed segmentation data will be available in the full report
    • Comprehensive analysis by multiple parameters
    • Regional and country-level breakdowns
    • Market size forecasts by segment
    Infographic

    Free Sample Request

    Kindly complete the form below to receive a free sample of this Report

    Get Free Sample

    Customer Strories

    “I am very pleased with how market segments have been defined in a relevant way for my purposes (such as "Portable Freezers & refrigerators" and "last-mile"). In general the report is well structured. Thanks very much for your efforts.”

    Victoria Milne

    Founder
    Case Study
    Chemicals and Materials