Request Free Sample ×

Kindly complete the form below to receive a free sample of this Report

* Please use a valid business email

Leading companies partner with us for data-driven Insights

clients tt-cursor
Hero Background

Europe Next Generation Building Energy Management Systems Market

ID: MRFR/ICT/62659-HCR
200 Pages
Aarti Dhapte
Last Updated: February 06, 2026

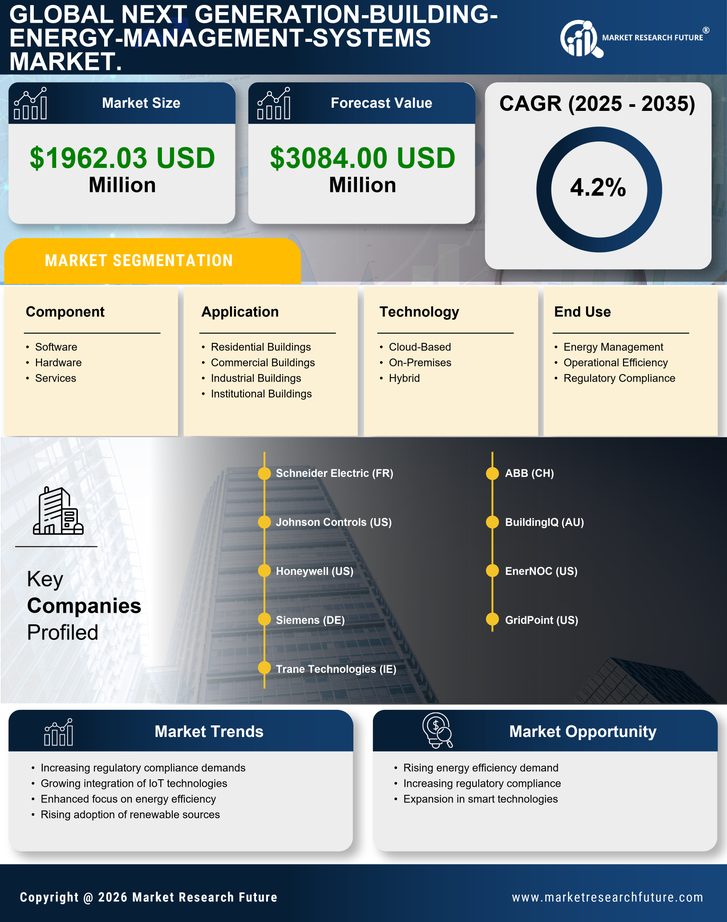
Europe Next Generation Building Energy Management Systems Market Size, Share and Trends Analysis Report By Application (Residential Buildings, Commercial Buildings, Industrial Buildings, Institutional Buildings), By Technology (Cloud-Based, On-Premises, Hybrid), By Component (Software, Hardware, Services), By End Use (Energy Management, Operational Efficiency, Regulatory Compliance) and By Regional (Germany, UK, France, Russia, Italy, Spain, Rest of Europe)- Forecast to 2035

Share:
Download PDF ×

We do not share your information with anyone. However, we may send you emails based on your report interest from time to time. You may contact us at any time to opt-out.

Europe Next Generation Building Energy Management Systems Market Infographic
Purchase Options
  1. 1 SECTION I: EXECUTIVE SUMMARY AND KEY HIGHLIGHTS
    1. 1.1 EXECUTIVE SUMMARY
      1. 1.1.1 Market Overview
      2. 1.1.2 Key Findings
      3. 1.1.3 Market Segmentation
      4. 1.1.4 Competitive Landscape
      5. 1.1.5 Challenges and Opportunities
      6. 1.1.6 Future Outlook
  2. 2 SECTION II: SCOPING, METHODOLOGY AND MARKET STRUCTURE
    1. 2.1 MARKET INTRODUCTION
      1. 2.1.1 Definition
      2. 2.1.2 Scope of the study
        1. 2.1.2.1 Research Objective
        2. 2.1.2.2 Assumption
        3. 2.1.2.3 Limitations
    2. 2.2 RESEARCH METHODOLOGY
      1. 2.2.1 Overview
      2. 2.2.2 Data Mining
      3. 2.2.3 Secondary Research
      4. 2.2.4 Primary Research
        1. 2.2.4.1 Primary Interviews and Information Gathering Process
        2. 2.2.4.2 Breakdown of Primary Respondents
      5. 2.2.5 Forecasting Model
      6. 2.2.6 Market Size Estimation
        1. 2.2.6.1 Bottom-Up Approach
        2. 2.2.6.2 Top-Down Approach
      7. 2.2.7 Data Triangulation
      8. 2.2.8 Validation
  3. 3 SECTION III: QUALITATIVE ANALYSIS
    1. 3.1 MARKET DYNAMICS
      1. 3.1.1 Overview
      2. 3.1.2 Drivers
      3. 3.1.3 Restraints
      4. 3.1.4 Opportunities
    2. 3.2 MARKET FACTOR ANALYSIS
      1. 3.2.1 Value chain Analysis
      2. 3.2.2 Porter's Five Forces Analysis
        1. 3.2.2.1 Bargaining Power of Suppliers
        2. 3.2.2.2 Bargaining Power of Buyers
        3. 3.2.2.3 Threat of New Entrants
        4. 3.2.2.4 Threat of Substitutes
        5. 3.2.2.5 Intensity of Rivalry
      3. 3.2.3 COVID-19 Impact Analysis
        1. 3.2.3.1 Market Impact Analysis
        2. 3.2.3.2 Regional Impact
        3. 3.2.3.3 Opportunity and Threat Analysis
  4. 4 SECTION IV: QUANTITATIVE ANALYSIS
    1. 4.1 Information and Communications Technology, BY Application (USD Billion)
      1. 4.1.1 Energy Monitoring
      2. 4.1.2 Energy Optimization
      3. 4.1.3 Demand Response
      4. 4.1.4 Building Automation
      5. 4.1.5 Data Analytics
    2. 4.2 Information and Communications Technology, BY End Use (USD Billion)
      1. 4.2.1 Residential
      2. 4.2.2 Commercial
      3. 4.2.3 Industrial
      4. 4.2.4 Institutional
    3. 4.3 Information and Communications Technology, BY Technology (USD Billion)
      1. 4.3.1 Cloud-Based Solutions
      2. 4.3.2 On-Premises Solutions
      3. 4.3.3 Hybrid Solutions
      4. 4.3.4 Artificial Intelligence
    4. 4.4 Information and Communications Technology, BY System Type (USD Billion)
      1. 4.4.1 Standalone Systems
      2. 4.4.2 Integrated Systems
      3. 4.4.3 Centralized Systems
      4. 4.4.4 Decentralized Systems
    5. 4.5 Information and Communications Technology, BY User Type (USD Billion)
      1. 4.5.1 Facility Managers
      2. 4.5.2 Building Owners
      3. 4.5.3 Energy Managers
      4. 4.5.4 IT Professionals
  5. 5 SECTION V: COMPETITIVE ANALYSIS
    1. 5.1 Competitive Landscape
      1. 5.1.1 Overview
      2. 5.1.2 Competitive Analysis
      3. 5.1.3 Market share Analysis
      4. 5.1.4 Major Growth Strategy in the Information and Communications Technology
      5. 5.1.5 Competitive Benchmarking
      6. 5.1.6 Leading Players in Terms of Number of Developments in the Information and Communications Technology
      7. 5.1.7 Key developments and growth strategies
        1. 5.1.7.1 New Product Launch/Service Deployment
        2. 5.1.7.2 Merger & Acquisitions
        3. 5.1.7.3 Joint Ventures
      8. 5.1.8 Major Players Financial Matrix
        1. 5.1.8.1 Sales and Operating Income
        2. 5.1.8.2 Major Players R&D Expenditure. 2023
    2. 5.2 Company Profiles
      1. 5.2.1 Siemens (DE)
        1. 5.2.1.1 Financial Overview
        2. 5.2.1.2 Products Offered
        3. 5.2.1.3 Key Developments
        4. 5.2.1.4 SWOT Analysis
        5. 5.2.1.5 Key Strategies
      2. 5.2.2 Schneider Electric (FR)
        1. 5.2.2.1 Financial Overview
        2. 5.2.2.2 Products Offered
        3. 5.2.2.3 Key Developments
        4. 5.2.2.4 SWOT Analysis
        5. 5.2.2.5 Key Strategies
      3. 5.2.3 Honeywell (US)
        1. 5.2.3.1 Financial Overview
        2. 5.2.3.2 Products Offered
        3. 5.2.3.3 Key Developments
        4. 5.2.3.4 SWOT Analysis
        5. 5.2.3.5 Key Strategies
      4. 5.2.4 Johnson Controls (IE)
        1. 5.2.4.1 Financial Overview
        2. 5.2.4.2 Products Offered
        3. 5.2.4.3 Key Developments
        4. 5.2.4.4 SWOT Analysis
        5. 5.2.4.5 Key Strategies
      5. 5.2.5 Trane Technologies (IE)
        1. 5.2.5.1 Financial Overview
        2. 5.2.5.2 Products Offered
        3. 5.2.5.3 Key Developments
        4. 5.2.5.4 SWOT Analysis
        5. 5.2.5.5 Key Strategies
      6. 5.2.6 Bosch (DE)
        1. 5.2.6.1 Financial Overview
        2. 5.2.6.2 Products Offered
        3. 5.2.6.3 Key Developments
        4. 5.2.6.4 SWOT Analysis
        5. 5.2.6.5 Key Strategies
      7. 5.2.7 ABB (CH)
        1. 5.2.7.1 Financial Overview
        2. 5.2.7.2 Products Offered
        3. 5.2.7.3 Key Developments
        4. 5.2.7.4 SWOT Analysis
        5. 5.2.7.5 Key Strategies
      8. 5.2.8 Engie (FR)
        1. 5.2.8.1 Financial Overview
        2. 5.2.8.2 Products Offered
        3. 5.2.8.3 Key Developments
        4. 5.2.8.4 SWOT Analysis
        5. 5.2.8.5 Key Strategies
      9. 5.2.9 Eaton (IE)
        1. 5.2.9.1 Financial Overview
        2. 5.2.9.2 Products Offered
        3. 5.2.9.3 Key Developments
        4. 5.2.9.4 SWOT Analysis
        5. 5.2.9.5 Key Strategies
      10. 5.2.10 Caverion (FI)
        1. 5.2.10.1 Financial Overview
        2. 5.2.10.2 Products Offered
        3. 5.2.10.3 Key Developments
        4. 5.2.10.4 SWOT Analysis
        5. 5.2.10.5 Key Strategies
    3. 5.3 Appendix
      1. 5.3.1 References
      2. 5.3.2 Related Reports
  6. 6 LIST OF FIGURES
    1. 6.1 MARKET SYNOPSIS
    2. 6.2 EUROPE MARKET ANALYSIS BY APPLICATION
    3. 6.3 EUROPE MARKET ANALYSIS BY END USE
    4. 6.4 EUROPE MARKET ANALYSIS BY TECHNOLOGY
    5. 6.5 EUROPE MARKET ANALYSIS BY SYSTEM TYPE
    6. 6.6 EUROPE MARKET ANALYSIS BY USER TYPE
    7. 6.7 KEY BUYING CRITERIA OF INFORMATION AND COMMUNICATIONS TECHNOLOGY
    8. 6.8 RESEARCH PROCESS OF MRFR
    9. 6.9 DRO ANALYSIS OF INFORMATION AND COMMUNICATIONS TECHNOLOGY
    10. 6.10 DRIVERS IMPACT ANALYSIS: INFORMATION AND COMMUNICATIONS TECHNOLOGY
    11. 6.11 RESTRAINTS IMPACT ANALYSIS: INFORMATION AND COMMUNICATIONS TECHNOLOGY
    12. 6.12 SUPPLY / VALUE CHAIN: INFORMATION AND COMMUNICATIONS TECHNOLOGY
    13. 6.13 INFORMATION AND COMMUNICATIONS TECHNOLOGY, BY APPLICATION, 2024 (% SHARE)
    14. 6.14 INFORMATION AND COMMUNICATIONS TECHNOLOGY, BY APPLICATION, 2024 TO 2035 (USD Billion)
    15. 6.15 INFORMATION AND COMMUNICATIONS TECHNOLOGY, BY END USE, 2024 (% SHARE)
    16. 6.16 INFORMATION AND COMMUNICATIONS TECHNOLOGY, BY END USE, 2024 TO 2035 (USD Billion)
    17. 6.17 INFORMATION AND COMMUNICATIONS TECHNOLOGY, BY TECHNOLOGY, 2024 (% SHARE)
    18. 6.18 INFORMATION AND COMMUNICATIONS TECHNOLOGY, BY TECHNOLOGY, 2024 TO 2035 (USD Billion)
    19. 6.19 INFORMATION AND COMMUNICATIONS TECHNOLOGY, BY SYSTEM TYPE, 2024 (% SHARE)
    20. 6.20 INFORMATION AND COMMUNICATIONS TECHNOLOGY, BY SYSTEM TYPE, 2024 TO 2035 (USD Billion)
    21. 6.21 INFORMATION AND COMMUNICATIONS TECHNOLOGY, BY USER TYPE, 2024 (% SHARE)
    22. 6.22 INFORMATION AND COMMUNICATIONS TECHNOLOGY, BY USER TYPE, 2024 TO 2035 (USD Billion)
    23. 6.23 BENCHMARKING OF MAJOR COMPETITORS
  7. 7 LIST OF TABLES
    1. 7.1 LIST OF ASSUMPTIONS
  8. 7.1.1
    1. 7.2 Europe MARKET SIZE ESTIMATES; FORECAST
      1. 7.2.1 BY APPLICATION, 2026-2035 (USD Billion)
      2. 7.2.2 BY END USE, 2026-2035 (USD Billion)
      3. 7.2.3 BY TECHNOLOGY, 2026-2035 (USD Billion)
      4. 7.2.4 BY SYSTEM TYPE, 2026-2035 (USD Billion)
      5. 7.2.5 BY USER TYPE, 2026-2035 (USD Billion)
    2. 7.3 PRODUCT LAUNCH/PRODUCT DEVELOPMENT/APPROVAL
  9. 7.3.1
    1. 7.4 ACQUISITION/PARTNERSHIP
  10. 7.4.1

Europe Information and Communications Technology Market Segmentation

Information and Communications Technology By Application (USD Billion, 2022-2035)

  • Energy Monitoring
  • Energy Optimization
  • Demand Response
  • Building Automation
  • Data Analytics

Information and Communications Technology By End Use (USD Billion, 2022-2035)

  • Residential
  • Commercial
  • Industrial
  • Institutional

Information and Communications Technology By Technology (USD Billion, 2022-2035)

  • Cloud-Based Solutions
  • On-Premises Solutions
  • Hybrid Solutions
  • Artificial Intelligence

Information and Communications Technology By System Type (USD Billion, 2022-2035)

  • Standalone Systems
  • Integrated Systems
  • Centralized Systems
  • Decentralized Systems

Information and Communications Technology By User Type (USD Billion, 2022-2035)

  • Facility Managers
  • Building Owners
  • Energy Managers
  • IT Professionals

Compare Licence

×
Features License Type
Single User Multiuser License Enterprise User
Price $4,950 $5,950 $7,250
Maximum User Access Limit 1 User Upto 10 Users Unrestricted Access Throughout the Organization
Free Customization
Direct Access to Analyst
Deliverable Format
Platform Access
Discount on Next Purchase 10% 15% 15%
Printable Versions