Europe Gas Generator Market (2026 - 2035)

ID: MRFR/EnP/53798-HCR 200 Pages Garvit Vyas Last Updated: October 16, 2026
Europe Gas Generator Market Research Report By Capacity (Less Than 75 kVA, 75 - 375 kVA, More Than 375 kVA), By End User (Residential, Commercial, Industrial) and By Regional (North America, Europe, South America, Asia Pacific, Middle East and Africa) – Industry Growth & Forecast to 2035
Europe Gas Generator Market
Market Size
Forecast Period2026-2035
CAGR (2026-2035)3.76%
2025 Market SizeUSD 2 Billion
2035 Market SizeUSD 2.89 Billion
Key Players
Caterpillar Inc.
Cummins Inc.
Rolls-Royce plc
INNIO Group
Generac Holdings
Rehlko
Opportunities
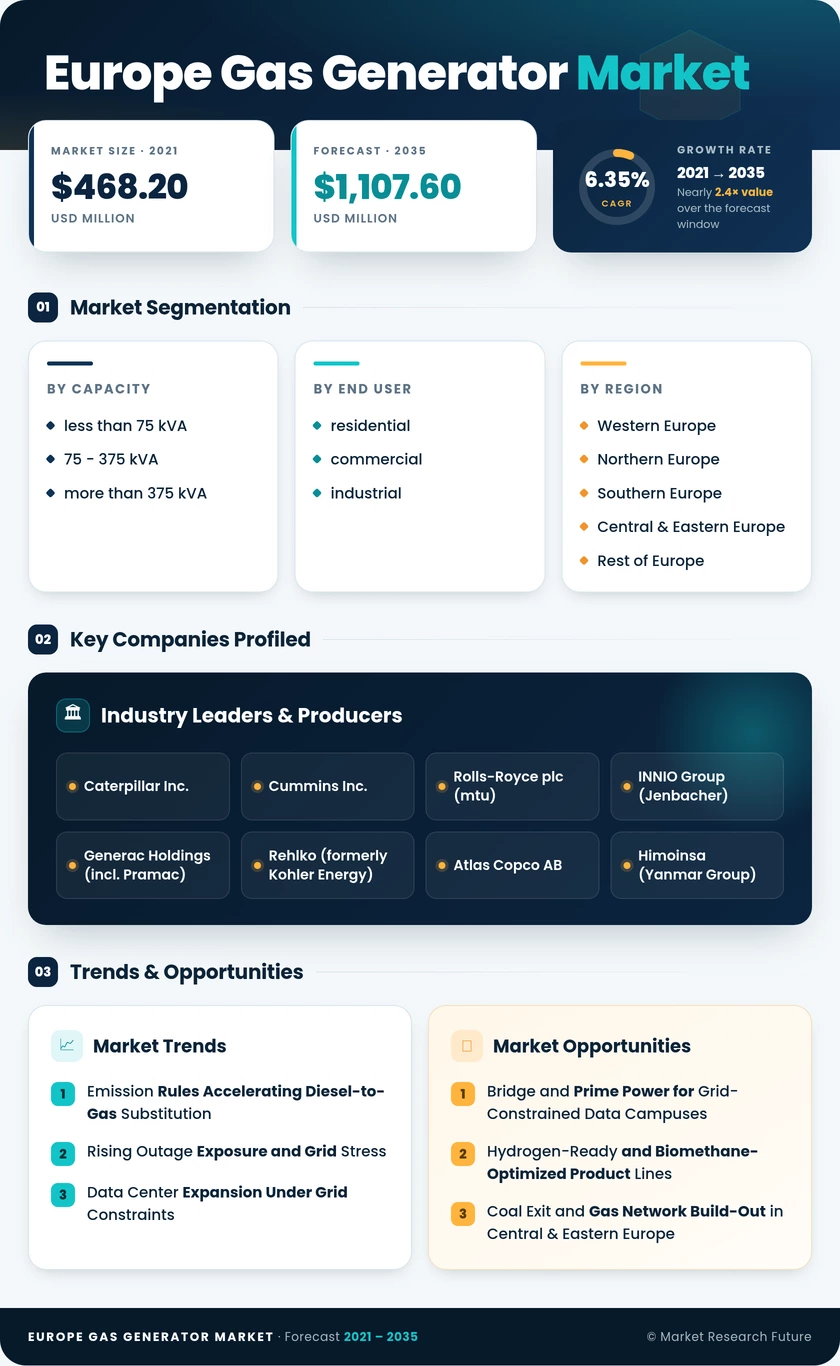
  • Bridge and Prime Power for Grid-Constrained Data Campuses
  • Hydrogen-Ready and Biomethane-Optimized Product Lines
  • Coal Exit and Gas Network Build-Out in Central & Eastern Europe
  1. 1 Market Summary | |
  2. 2 Key Report Takeaways | |
    1. 2.1 By Capacity | |
    2. 2.2 By End User | |
    3. 2.3 By Region | |
  3. 3 Europe Gas Generator Market Size and Forecast (2021–2035) | |
  4. 4 Driver Impact Analysis | |
    1. 4.1 Emission Rules Accelerating Diesel-to-Gas Substitution | |
    2. 4.2 Rising Outage Exposure and Grid Stress | |
    3. 4.3 Data Center Expansion Under Grid Constraints | |
    4. 4.4 Flexible Capacity for Renewable Balancing | |
    5. 4.5 Cogeneration Efficiency Mandates | |
    6. 4.6 Biomethane Scale-Up in Gas Grids | |
  5. 5 Restraints Impact Analysis | |
    1. 5.1 Natural Gas Price Volatility | |
    2. 5.2 Battery Storage Substitution | |
    3. 5.3 Rental Preference Over Ownership | |
    4. 5.4 Higher Upfront Cost and Slower Load Acceptance | |
    5. 5.5 Methane Slip Scrutiny and Gas Access Limits | |
  6. 6 Opportunities | |
    1. 6.1 Bridge and Prime Power for Grid-Constrained Data Campuses | |
    2. 6.2 Hydrogen-Ready and Biomethane-Optimized Product Lines | |
    3. 6.3 Coal Exit and Gas Network Build-Out in Central & Eastern Europe | |
    4. 6.4 Power-as-a-Service and Data-Driven Flexibility Revenue | |
  7. 7 Regional Market Share and Country-Level Analysis | |
    1. 7.1 Western Europe | | |
      1. 7.1.1 Germany | | |
      2. 7.1.2 United Kingdom | | |
      3. 7.1.3 France | | |
      4. 7.1.4 Netherlands | | |
      5. 7.1.5 Belgium & Luxembourg | |
    2. 7.2 Northern Europe | | |
      1. 7.2.1 Denmark | | |
      2. 7.2.2 Sweden | | |
      3. 7.2.3 Norway | | |
      4. 7.2.4 Finland | |
    3. 7.3 Southern Europe | | |
      1. 7.3.1 Italy | | |
      2. 7.3.2 Spain | | |
      3. 7.3.3 Portugal | | |
      4. 7.3.4 Greece | |
    4. 7.4 Central & Eastern Europe | | |
      1. 7.4.1 Poland | | |
      2. 7.4.2 Czech Republic | | |
      3. 7.4.3 Romania | | |
      4. 7.4.4 Rest of Central & Eastern Europe | |
    5. 7.5 Rest of Europe | | |
      1. 7.5.1 Türkiye | | |
      2. 7.5.2 Switzerland | | |
      3. 7.5.3 Austria | | |
      4. 7.5.4 Ireland | |
  8. 8 Future Outlook (2026–2035) | |
    1. 8.1 Gensets as Grid Flexibility Assets | |
    2. 8.2 Digital Operations and Predictive Maintenance | |
    3. 8.3 Fuel Transition Toward Biomethane and Hydrogen | |
    4. 8.4 Resilience Regulation and Electrification-Led Demand | |
  9. 9 Segmentation Analysis | |
    1. 9.1 By Capacity | | |
      1. 9.1.1 less than 75 kVA | | |
      2. 9.1.2 75 - 375 kVA | | |
      3. 9.1.2 more than 375 kVA | |
    2. 9.2 By End User | | |
      1. 9.2.1 residential | | |
      2. 9.2.2 commercial | | |
      3. 9.2.3 industrial | |
  10. 10 Competitive Landscape | |
    1. 10.1 Market Concentration Analysis | |
    2. 10.2 Competitive Benchmarking Matrix | |
    3. 10.3 Company Profiles | | |
      1. 10.3.1 Caterpillar Inc. | | |
      2. 10.3.2 Cummins Inc. | | |
      3. 10.3.3 Rolls-Royce plc (mtu) | | |
      4. 10.3.4 INNIO Group (Jenbacher) | | |
      5. 10.3.5 Generac Holdings (incl. Pramac) | | |
      6. 10.3.6 Rehlko (formerly Kohler Energy) | | |
      7. 10.3.7 Atlas Copco AB | | |
      8. 10.3.8 Himoinsa (Yanmar Group) | | |
      9. 10.3.9 Wärtsilä Corporation | | |
      10. 10.3.10 Everllence (formerly MAN Energy Solutions) | |
  11. 11 Recent News & Developments | |
  12. 12 Report Scope and Methodology | |
  13. 13 Detailed Sources and Citations | |
  14. 14 Frequently Asked Questions (FAQs) | | LIST OF TABLES | |
  15. TABLE 1 Report Snapshot – Key Market Indicators, 2025–2035 | |
  16. TABLE 2 Market Size and Forecast, by Revenue (USD Million), 2021–2035 | |
  17. TABLE 3 Driver Impact Analysis | |
  18. TABLE 4 Restraints Impact Analysis | |
  19. TABLE 5 Regional Summary, 2025 | |
  20. TABLE 6 Western Europe – Country-Level Analysis | |
  21. TABLE 7 Northern Europe – Country-Level Analysis | |
  22. TABLE 8 Southern Europe – Country-Level Analysis | |
  23. TABLE 9 Central & Eastern Europe – Country-Level Analysis | |
  24. TABLE 10 Rest of Europe – Country-Level Analysis | |
  25. TABLE 11 Market Size, by Capacity, 2021–2035 (USD Million) | |
  26. TABLE 12 Market Size, by End User, 2021–2035 (USD Million) | |
  27. TABLE 13 Competitive Benchmarking Matrix, 2025 | |
  28. TABLE 14 Report Scope and Methodology | |
  29. TABLE 15 Detailed Sources and Citations | |
  30. TABLE 16 Segmentation Quick Reference | |
  31. TABLE 17 Segmentation Overview – By Capacity | |
  32. TABLE 18 Segmentation Overview – By End User | | LIST OF FIGURES | |
  33. FIGURE 1 Market Dynamics Overview – Drivers, Restraints and Opportunities | |
  34. FIGURE 2 Industry Value Chain Analysis | |
  35. FIGURE 3 Porter's Five Forces Analysis | |
  36. FIGURE 4 Market Size Trend, 2021–2035 (USD Million) | |
  37. FIGURE 5 Market Share, by Capacity, 2025 (%) | |
  38. FIGURE 6 Market Share, by End User, 2025 (%) | |
  39. FIGURE 7 Regional Market Share, 2025 (%) | |
  40. FIGURE 8 Country-Level Market Share within Western Europe, 2025 (%) | |
  41. FIGURE 9 Competitive Landscape – Estimated Revenue Share of Key Players, 2025 | |
  42. FIGURE 10 Competitive Positioning Matrix

Segmentation Quick Reference

DimensionSub-SegmentsDominant SegmentFastest Growing Segment
By Capacityless than 75 kVA; 75 - 375 kVA; more than 375 kVAmore than 375 kVA (44.7% share)less than 75 kVA (7.1% CAGR)
By End Userresidential; commercial; industrialindustrial (47.6% share)residential (7.4% CAGR)
By RegionWestern Europe; Northern Europe; Southern Europe; Central & Eastern Europe; Rest of EuropeWestern Europe (46.2% share)Central & Eastern Europe (7.8% CAGR)


Market Segmentation Overview

The Europe Gas Generator Market segmentation below follows the two canonical dimensions used throughout this report.

By Capacity

Sub-SegmentKey Trend
less than 75 kVAAutomatic home and small-business standby units linked to existing gas connections
75 - 375 kVAHospital, retail and telecom resilience upgrades driven by 2030 emission compliance
more than 375 kVAMulti-megawatt modular plants for data center bridge power and cogeneration


The more than 375 kVA band leads because data centers, utilities and process plants order multi-megawatt blocks for prime and cogeneration duty, where gas engines' long runtimes justify their higher capital cost. The less than 75 kVA band grows fastest as electrified homes and small shops add automatic standby units connected to existing gas lines. Between them, the 75 - 375 kVA class captures facilities that must replace aging diesel sets before the 2030 medium combustion plant deadline.

By End User

Sub-SegmentKey Trend
residentialHeat pumps and EV chargers raising household exposure to outages
commercialHealthcare, logistics and data facilities formalizing resilience obligations
industrialHeat-recovery cogeneration supporting efficiency directive targets


Industrial users lead because cogeneration lets chemicals, food and manufacturing plants recover engine heat and cut energy bills while protecting continuous processes. Residential demand grows fastest as households that have switched to heat pumps and electric vehicles face far higher disruption during outages. Commercial buyers sit between the two, with hospitals and logistics hubs upgrading generation to satisfy stricter resilience rules and insurer requirements.


 

Download PDF ×

We do not share your information with anyone. However, we may send you emails based on your report interest from time to time. You may contact us at any time to opt-out.