Request Free Sample ×

Kindly complete the form below to receive a free sample of this Report

* Please use a valid business email

Leading companies partner with us for data-driven Insights

clients tt-cursor
Hero Background

Europe Enterprise High Productivity Application Platform Service Market

ID: MRFR/ICT/63376-HCR
200 Pages
Aarti Dhapte
Last Updated: March 28, 2026

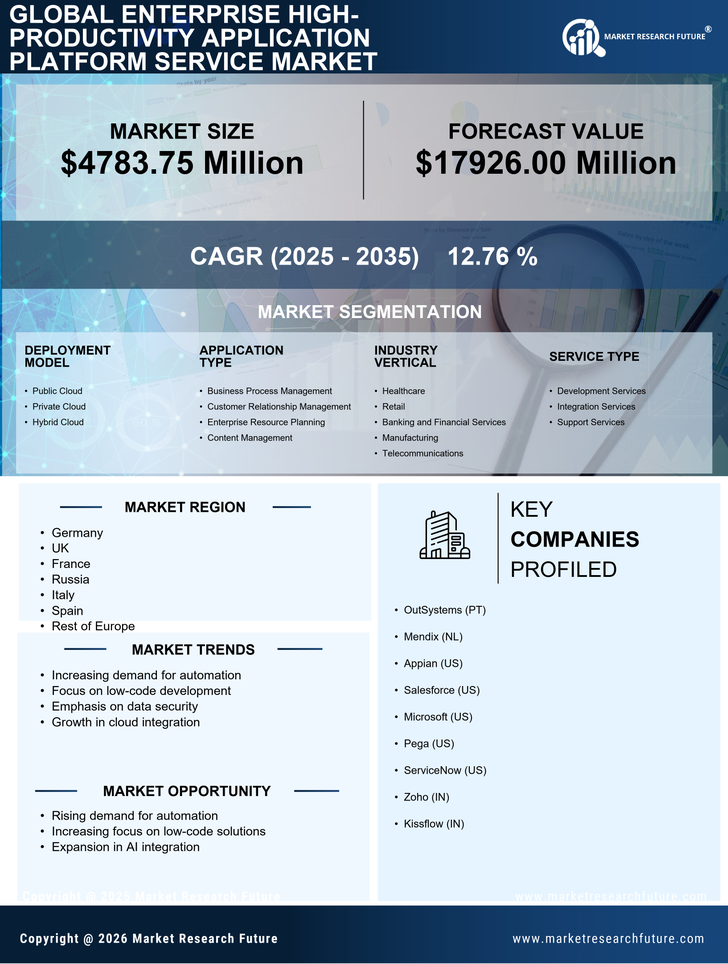
Europe Enterprise High Productivity Application Platform Service Market Research Report By Deployment Model (Public Cloud, Private Cloud, Hybrid Cloud), By Application Type (Business Process Management, Customer Relationship Management, Enterprise Resource Planning, Content Management), By Industry Vertical (Healthcare, Retail, Banking and Financial Services, Manufacturing, Telecommunications), By Service Type (Development Services, Integration Services, Support Services) and By Regional (Germany, UK, France, Russia, Italy, Spain, Rest of Europe)- Forecast to 2035

Share:
Download PDF ×

We do not share your information with anyone. However, we may send you emails based on your report interest from time to time. You may contact us at any time to opt-out.

Europe Enterprise High Productivity Application Platform Service Market Infographic
Purchase Options
  1. 1 SECTION I: EXECUTIVE SUMMARY AND KEY HIGHLIGHTS
    1. 1.1 EXECUTIVE SUMMARY
      1. 1.1.1 Market Overview
      2. 1.1.2 Key Findings
      3. 1.1.3 Market Segmentation
      4. 1.1.4 Competitive Landscape
      5. 1.1.5 Challenges and Opportunities
      6. 1.1.6 Future Outlook
  2. 2 SECTION II: SCOPING, METHODOLOGY AND MARKET STRUCTURE
    1. 2.1 MARKET INTRODUCTION
      1. 2.1.1 Definition
      2. 2.1.2 Scope of the study
        1. 2.1.2.1 Research Objective
        2. 2.1.2.2 Assumption
        3. 2.1.2.3 Limitations
    2. 2.2 RESEARCH METHODOLOGY
      1. 2.2.1 Overview
      2. 2.2.2 Data Mining
      3. 2.2.3 Secondary Research
      4. 2.2.4 Primary Research
        1. 2.2.4.1 Primary Interviews and Information Gathering Process
        2. 2.2.4.2 Breakdown of Primary Respondents
      5. 2.2.5 Forecasting Model
      6. 2.2.6 Market Size Estimation
        1. 2.2.6.1 Bottom-Up Approach
        2. 2.2.6.2 Top-Down Approach
      7. 2.2.7 Data Triangulation
      8. 2.2.8 Validation
  3. 3 SECTION III: QUALITATIVE ANALYSIS
    1. 3.1 MARKET DYNAMICS
      1. 3.1.1 Overview
      2. 3.1.2 Drivers
      3. 3.1.3 Restraints
      4. 3.1.4 Opportunities
    2. 3.2 MARKET FACTOR ANALYSIS
      1. 3.2.1 Value chain Analysis
      2. 3.2.2 Porter's Five Forces Analysis
        1. 3.2.2.1 Bargaining Power of Suppliers
        2. 3.2.2.2 Bargaining Power of Buyers
        3. 3.2.2.3 Threat of New Entrants
        4. 3.2.2.4 Threat of Substitutes
        5. 3.2.2.5 Intensity of Rivalry
      3. 3.2.3 COVID-19 Impact Analysis
        1. 3.2.3.1 Market Impact Analysis
        2. 3.2.3.2 Regional Impact
        3. 3.2.3.3 Opportunity and Threat Analysis
  4. 4 SECTION IV: QUANTITATIVE ANALYSIS
    1. 4.1 Information and Communications Technology, BY Application (USD Billion)
      1. 4.1.1 Business Process Management
      2. 4.1.2 Collaboration Tools
      3. 4.1.3 Project Management
      4. 4.1.4 Workflow Automation
    2. 4.2 Information and Communications Technology, BY Deployment Model (USD Billion)
      1. 4.2.1 Cloud-Based
      2. 4.2.2 On-Premises
      3. 4.2.3 Hybrid
    3. 4.3 Information and Communications Technology, BY End User (USD Billion)
      1. 4.3.1 Small and Medium Enterprises
      2. 4.3.2 Large Enterprises
      3. 4.3.3 Government Organizations
      4. 4.3.4 Non-Profit Organizations
    4. 4.4 Information and Communications Technology, BY Industry (USD Billion)
      1. 4.4.1 Information Technology
      2. 4.4.2 Healthcare
      3. 4.4.3 Manufacturing
      4. 4.4.4 Finance
    5. 4.5 Information and Communications Technology, BY Functionality (USD Billion)
      1. 4.5.1 Low-Code Development
      2. 4.5.2 Integration Capabilities
      3. 4.5.3 Data Analytics
      4. 4.5.4 User Experience
  5. 5 SECTION V: COMPETITIVE ANALYSIS
    1. 5.1 Competitive Landscape
      1. 5.1.1 Overview
      2. 5.1.2 Competitive Analysis
      3. 5.1.3 Market share Analysis
      4. 5.1.4 Major Growth Strategy in the Information and Communications Technology
      5. 5.1.5 Competitive Benchmarking
      6. 5.1.6 Leading Players in Terms of Number of Developments in the Information and Communications Technology
      7. 5.1.7 Key developments and growth strategies
        1. 5.1.7.1 New Product Launch/Service Deployment
        2. 5.1.7.2 Merger & Acquisitions
        3. 5.1.7.3 Joint Ventures
      8. 5.1.8 Major Players Financial Matrix
        1. 5.1.8.1 Sales and Operating Income
        2. 5.1.8.2 Major Players R&D Expenditure. 2023
    2. 5.2 Company Profiles
      1. 5.2.1 Microsoft (GB)
        1. 5.2.1.1 Financial Overview
        2. 5.2.1.2 Products Offered
        3. 5.2.1.3 Key Developments
        4. 5.2.1.4 SWOT Analysis
        5. 5.2.1.5 Key Strategies
      2. 5.2.2 SAP (DE)
        1. 5.2.2.1 Financial Overview
        2. 5.2.2.2 Products Offered
        3. 5.2.2.3 Key Developments
        4. 5.2.2.4 SWOT Analysis
        5. 5.2.2.5 Key Strategies
      3. 5.2.3 Salesforce (US)
        1. 5.2.3.1 Financial Overview
        2. 5.2.3.2 Products Offered
        3. 5.2.3.3 Key Developments
        4. 5.2.3.4 SWOT Analysis
        5. 5.2.3.5 Key Strategies
      4. 5.2.4 Oracle (US)
        1. 5.2.4.1 Financial Overview
        2. 5.2.4.2 Products Offered
        3. 5.2.4.3 Key Developments
        4. 5.2.4.4 SWOT Analysis
        5. 5.2.4.5 Key Strategies
      5. 5.2.5 ServiceNow (US)
        1. 5.2.5.1 Financial Overview
        2. 5.2.5.2 Products Offered
        3. 5.2.5.3 Key Developments
        4. 5.2.5.4 SWOT Analysis
        5. 5.2.5.5 Key Strategies
      6. 5.2.6 IBM (US)
        1. 5.2.6.1 Financial Overview
        2. 5.2.6.2 Products Offered
        3. 5.2.6.3 Key Developments
        4. 5.2.6.4 SWOT Analysis
        5. 5.2.6.5 Key Strategies
      7. 5.2.7 Atlassian (AU)
        1. 5.2.7.1 Financial Overview
        2. 5.2.7.2 Products Offered
        3. 5.2.7.3 Key Developments
        4. 5.2.7.4 SWOT Analysis
        5. 5.2.7.5 Key Strategies
      8. 5.2.8 Zoho (IN)
        1. 5.2.8.1 Financial Overview
        2. 5.2.8.2 Products Offered
        3. 5.2.8.3 Key Developments
        4. 5.2.8.4 SWOT Analysis
        5. 5.2.8.5 Key Strategies
      9. 5.2.9 Mendix (NL)
        1. 5.2.9.1 Financial Overview
        2. 5.2.9.2 Products Offered
        3. 5.2.9.3 Key Developments
        4. 5.2.9.4 SWOT Analysis
        5. 5.2.9.5 Key Strategies
    3. 5.3 Appendix
      1. 5.3.1 References
      2. 5.3.2 Related Reports
  6. 6 LIST OF FIGURES
    1. 6.1 MARKET SYNOPSIS
    2. 6.2 EUROPE MARKET ANALYSIS BY APPLICATION
    3. 6.3 EUROPE MARKET ANALYSIS BY DEPLOYMENT MODEL
    4. 6.4 EUROPE MARKET ANALYSIS BY END USER
    5. 6.5 EUROPE MARKET ANALYSIS BY INDUSTRY
    6. 6.6 EUROPE MARKET ANALYSIS BY FUNCTIONALITY
    7. 6.7 KEY BUYING CRITERIA OF INFORMATION AND COMMUNICATIONS TECHNOLOGY
    8. 6.8 RESEARCH PROCESS OF MRFR
    9. 6.9 DRO ANALYSIS OF INFORMATION AND COMMUNICATIONS TECHNOLOGY
    10. 6.10 DRIVERS IMPACT ANALYSIS: INFORMATION AND COMMUNICATIONS TECHNOLOGY
    11. 6.11 RESTRAINTS IMPACT ANALYSIS: INFORMATION AND COMMUNICATIONS TECHNOLOGY
    12. 6.12 SUPPLY / VALUE CHAIN: INFORMATION AND COMMUNICATIONS TECHNOLOGY
    13. 6.13 INFORMATION AND COMMUNICATIONS TECHNOLOGY, BY APPLICATION, 2024 (% SHARE)
    14. 6.14 INFORMATION AND COMMUNICATIONS TECHNOLOGY, BY APPLICATION, 2024 TO 2035 (USD Billion)
    15. 6.15 INFORMATION AND COMMUNICATIONS TECHNOLOGY, BY DEPLOYMENT MODEL, 2024 (% SHARE)
    16. 6.16 INFORMATION AND COMMUNICATIONS TECHNOLOGY, BY DEPLOYMENT MODEL, 2024 TO 2035 (USD Billion)
    17. 6.17 INFORMATION AND COMMUNICATIONS TECHNOLOGY, BY END USER, 2024 (% SHARE)
    18. 6.18 INFORMATION AND COMMUNICATIONS TECHNOLOGY, BY END USER, 2024 TO 2035 (USD Billion)
    19. 6.19 INFORMATION AND COMMUNICATIONS TECHNOLOGY, BY INDUSTRY, 2024 (% SHARE)
    20. 6.20 INFORMATION AND COMMUNICATIONS TECHNOLOGY, BY INDUSTRY, 2024 TO 2035 (USD Billion)
    21. 6.21 INFORMATION AND COMMUNICATIONS TECHNOLOGY, BY FUNCTIONALITY, 2024 (% SHARE)
    22. 6.22 INFORMATION AND COMMUNICATIONS TECHNOLOGY, BY FUNCTIONALITY, 2024 TO 2035 (USD Billion)
    23. 6.23 BENCHMARKING OF MAJOR COMPETITORS
  7. 7 LIST OF TABLES
    1. 7.1 LIST OF ASSUMPTIONS
  8. 7.1.1
    1. 7.2 Europe MARKET SIZE ESTIMATES; FORECAST
      1. 7.2.1 BY APPLICATION, 2026-2035 (USD Billion)
      2. 7.2.2 BY DEPLOYMENT MODEL, 2026-2035 (USD Billion)
      3. 7.2.3 BY END USER, 2026-2035 (USD Billion)
      4. 7.2.4 BY INDUSTRY, 2026-2035 (USD Billion)
      5. 7.2.5 BY FUNCTIONALITY, 2026-2035 (USD Billion)
    2. 7.3 PRODUCT LAUNCH/PRODUCT DEVELOPMENT/APPROVAL
  9. 7.3.1
    1. 7.4 ACQUISITION/PARTNERSHIP
  10. 7.4.1

Europe Information and Communications Technology Market Segmentation

Information and Communications Technology By Application (USD Billion, 2022-2035)

  • Business Process Management
  • Collaboration Tools
  • Project Management
  • Workflow Automation

Information and Communications Technology By Deployment Model (USD Billion, 2022-2035)

  • Cloud-Based
  • On-Premises
  • Hybrid

Information and Communications Technology By End User (USD Billion, 2022-2035)

  • Small and Medium Enterprises
  • Large Enterprises
  • Government Organizations
  • Non-Profit Organizations

Information and Communications Technology By Industry (USD Billion, 2022-2035)

  • Information Technology
  • Healthcare
  • Manufacturing
  • Finance

Information and Communications Technology By Functionality (USD Billion, 2022-2035)

  • Low-Code Development
  • Integration Capabilities
  • Data Analytics
  • User Experience

Compare Licence

×
Features License Type
Single User Multiuser License Enterprise User
Price $4,950 $5,950 $7,250
Maximum User Access Limit 1 User Upto 10 Users Unrestricted Access Throughout the Organization
Free Customization
Direct Access to Analyst
Deliverable Format
Platform Access
Discount on Next Purchase 10% 15% 15%
Printable Versions