Segmentation Quick Reference
| Dimension | Sub-Segments | Dominant Segment | Fastest Growing Segment |
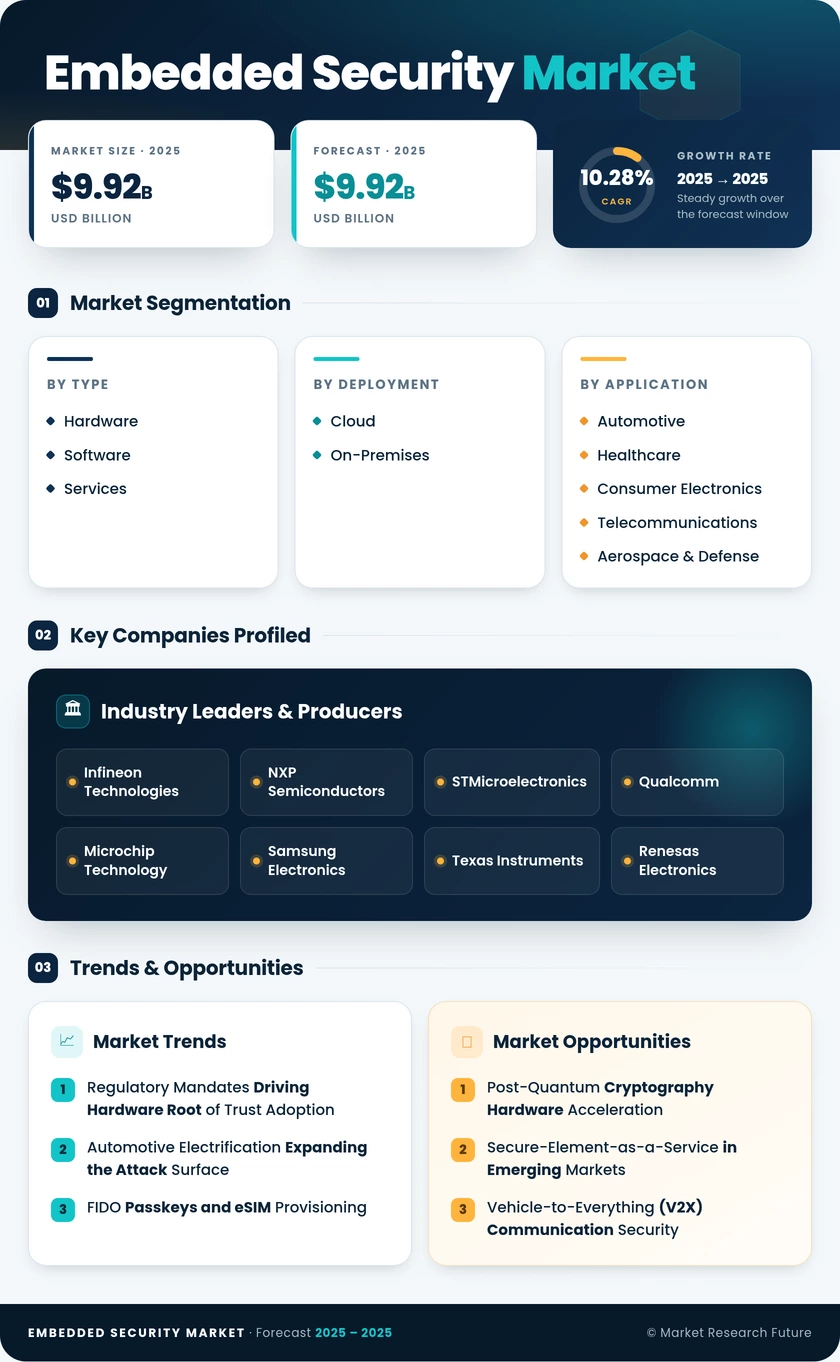
| Component Type | Hardware, Software, Services | Hardware (53.1% share, 2025) | Services (CAGR 12.34%) |
| Deployment | Cloud, On-Premises | Cloud (USD 6.24B, 2025) | Cloud (CAGR 13.62%) |
| Application | Payment, Authentication, Content Protection, Others | Payment (39.4% share, 2025) | Authentication (CAGR 11.49%) |
| End-User Industry | Automotive, Healthcare, Consumer Electronics, Telecommunications, Aerospace & Defense, Others | Automotive (34.7% share, 2025) | Healthcare (CAGR 11.02%) |
| Geography | North America, Europe, Asia-Pacific, South America, Middle East & Africa | Asia-Pacific (43.6% share, 2025) | Middle East & Africa (CAGR 12.44%) |
Market Segmentation Overview
By Component Type
| Sub-Segment | Key Trend |
| Hardware | Secure elements and TPMs mandated by EU CRA and UNECE R155; PQC-ready silicon in development |
| Software | Firmware integrity suites and key management platforms are gaining traction with SaaS delivery |
| Services | Managed provisioning, compliance auditing, and lifecycle management, driving recurring revenue |
Hardware accounts for the majority of the embedded security market revenue as regulatory mandates require physical tamper resistance. Services represent the fastest-growing component as OEMs increasingly outsource complex cryptographic lifecycle management to specialist providers.
By Deployment
| Sub-Segment | Key Trend |
| Cloud | Elastic HSM instances scaling with enterprise workloads; multi-tenant key management adoption |
| On-Premises | Data-localization laws in India, Brazil, and Russia are sustaining demand for local secure infrastructure |
Cloud deployment dominates due to lower upfront costs and operational flexibility, while on-premises retains a substantial share driven by regulatory requirements for local key residency.
By Application
| Sub-Segment | Key Trend |
| Payment | eSIM provisioning, FIDO passkeys, and contactless POS driving volume |
| Authentication | Zero-trust mandates expanding hardware-backed identity verification |
| Content Protection | DRM and conditional-access systems for streaming platforms |
| Others | Smart metering, supply-chain traceability, and industrial IoT credential management |
Payment is the largest application segment, while authentication is growing fastest as zero-trust frameworks extend hardware-backed identity from enterprise IT to operational-technology environments.
By End-User Industry
| Sub-Segment | Key Trend |
| Automotive | V2X security, OTA update integrity, UNECE R155, and ISO/SAE 21434 compliance |
| Healthcare | FDA cybersecurity guidance mandating secure elements in Class II/III devices |
| Consumer Electronics | Smartphone secure enclaves, wearable authentication, smart-home device identity |
| Telecommunications | 5G RAN security, eSIM infrastructure, network-function virtualization protection |
| Aerospace & Defense | Classified communication, ITAR-compliant supply-chain security |
| Others | Energy, industrial automation, and retail IoT applications |
Automotive holds the largest share due to regulatory intensity and high ECU counts per vehicle. Healthcare is expanding rapidly as connected medical device security transitions from voluntary guidance to enforceable mandates.