• Cat-intel
  • MedIntelliX
  • Resources
  • About Us
  • Hero Background
    English
    Chinese
    French
    Japanese
    Korean
    German
    Spanish

    Electronic Toll Collection Market Size

    ID: MRFR/SEM/3536-CR
    200 Pages
    Shubham Munde
    July 2025

    Electronic Toll Collection Market Research Report By Technology (Radio Frequency Identification, Automatic Number Plate Recognition, Smartphone Applications, Contactless Payment Systems), By Component (On-Board Units, Back Office Systems, Roadside Equipment, Payment Processing Solutions), By Application (Highway Tolling, Urban Tolling, Congestion Pricing), By End Use (Government, Private Operat...

    Share:
    Download PDF ×

    We do not share your information with anyone. However, we may send you emails based on your report interest from time to time. You may contact us at any time to opt-out.

    Electronic Toll Collection Market Infographic
    Purchase Options

    Electronic Toll Collection Size

    Electronic Toll Collection Market Growth Projections and Opportunities

    Transportation plays a pivotal role in driving economic growth, with the number of vehicles surging due to advancements in in-vehicle communication and the rise of electric vehicles, gradually replacing conventional fuel-based ones. This surge, however, necessitates a corresponding improvement in road infrastructure. Governments worldwide levy fees, in addition to taxes, for the maintenance of highways, state highways, and urban roads. Traditionally, toll facilities manually collect charges for road maintenance, particularly on highways and urban roads. The introduction of Electronic Toll Collection (ETC) systems marks a transformative shift, automating traditional tolling processes by identifying vehicles and imposing charges seamlessly. ETC not only enhances vehicle transportation but also reduces the manual efforts required at toll facilities.

    The integration of communication and pervasive computing technologies facilitates electronic toll payments for vehicle owners, employing technologies such as Radio Frequency Identification (RFID) tags, Dedicated Short Range Communications (DSRC), and Automatic Number Plate Recognition (ANPR). The demand for digital toll payments is rising rapidly, particularly in regions like Asia-Pacific and Europe. Advances in communication standards have propelled ETC to become the most swiftly adopted connected road technology. In the United States, the top 35 toll facilities have invested nearly USD 13 billion across 9,500 tolled roads. Over the past decade, consumers have witnessed remarkable advancements in downsizing computer hardware and the emergence of new technologies like wireless networks and high-performance identification tags. These developments encourage ETC system manufacturers to build sophisticated systems leveraging these technologies. In North America, RFID stands out as the most widely used technology for electronic toll collection, while Europe and Asia-Pacific rely on DSRC.

    A significant challenge faced by authorities and vehicle owners at manual toll facilities is the wait time to pay tolls, resulting in increased fuel consumption. Vehicles often spend up to 10 minutes waiting to register at toll facilities. The implementation of ETC systems addresses this challenge effectively. Equipped with tags, vehicles can pass through at highway speeds. Overhead readers scan these tags, and the toll amount is deducted from the user's prepaid or postpaid account linked to the centralized system. The demand for ETC systems and solutions has witnessed a substantial uptick in recent years due to their contribution to enhancing road safety and infrastructure for vehicles. This technological advancement is expected to bring about significant improvements in existing tolling facilities. Notably, there is a growing demand for ETC systems in India.

    Electronic Toll Collection Market Size Graph
    Author
    Shubham Munde
    Research Analyst Level II

    With a technical background in information technology & semiconductors, Shubham has 4.5+ years of experience in market research and analytics with the tasks of data mining, analysis, and project execution. He is the POC for our clients, for their consulting projects running under the ICT/Semiconductor domain. Shubham holds a Bachelor’s in Information and Technology and a Master of Business Administration (MBA). Shubham has executed over 150 research projects for our clients under the brand name Market Research Future in the last 2 years. His core skill is building the research respondent relation for gathering the primary information from industry and market estimation for niche markets. He is having expertise in conducting secondary & primary research, market estimations, market projections, competitive analysis, analysing current market trends and market dynamics, deep-dive analysis on market scenarios, consumer behaviour, technological impact analysis, consulting, analytics, etc. He has worked on fortune 500 companies' syndicate and consulting projects along with several government projects. He has worked on the projects of top tech brands such as IBM, Google, Microsoft, AWS, Meta, Oracle, Cisco Systems, Samsung, Accenture, VMware, Schneider Electric, Dell, HP, Ericsson, and so many others. He has worked on Metaverse, Web 3.0, Zero-Trust security, cyber-security, blockchain, quantum computing, robotics, 5G technology, High-Performance computing, data centers, AI, automation, IT equipment, sensors, semiconductors, consumer electronics and so many tech domain projects.

    Leave a Comment

    FAQs

    What was the expected market size of the Electronic Toll Collection Market in 2024?

    The Electronic Toll Collection Market was valued at 9.4 USD Billion in 2024.

    What is the projected market size for the Electronic Toll Collection Market by 2035?

    By 2035, the Electronic Toll Collection Market is projected to reach a value of 18.0 USD Billion.

    What is the expected compound annual growth rate (CAGR) for the Electronic Toll Collection Market from 2025 to 2035?

    The expected CAGR for the Electronic Toll Collection Market from 2025 to 2035 is 6.08%.

    Which region dominated the Electronic Toll Collection Market in 2024?

    In 2024, North America dominated the Electronic Toll Collection Market with a value of 3.0 USD Billion.

    What will the market size be for the Asia Pacific region in the Electronic Toll Collection Market by 2035?

    By 2035, the Asia Pacific region is projected to reach a market size of 4.8 USD Billion in the Electronic Toll Collection Market.

    Who are the key players in the Electronic Toll Collection Market?

    Some key players in the Electronic Toll Collection Market include Traffic Technologies, Conduent, TagMaster, and TransCore, among others.

    What was the market value for the Radio Frequency Identification technology segment in 2024?

    The Radio Frequency Identification technology segment was valued at 3.5 USD Billion in 2024.

    What is the projected market value for Automatic Number Plate Recognition technology in 2035?

    The Automatic Number Plate Recognition technology is projected to reach a market value of 4.5 USD Billion by 2035.

    What growth opportunities exist in the Electronic Toll Collection Market?

    Growth opportunities in the Electronic Toll Collection Market are driven by technological advancements and increasing demand for efficient toll collection systems.

    How will the Electronic Toll Collection Market be affected by evolving payment technologies?

    Evolving payment technologies like contactless payment systems are expected to significantly impact growth in the Electronic Toll Collection Market, enhancing user convenience.

    Market Summary

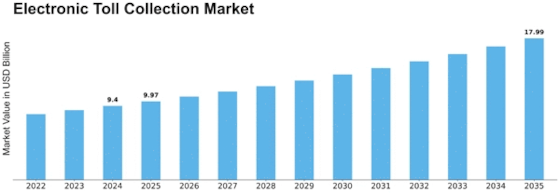
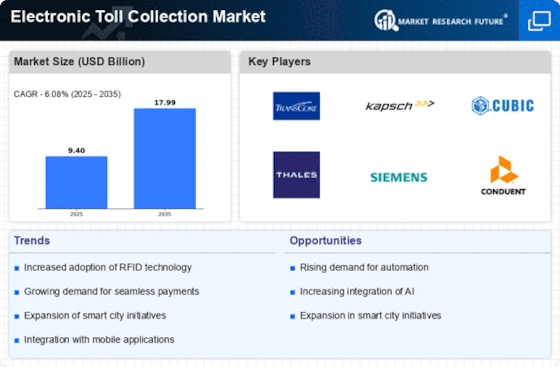
    As per MRFR analysis, the Electronic Toll Collection Market Size was estimated at 9.4 USD Billion in 2024. The Electronic Toll Collection industry is projected to grow from 9.972 USD Billion in 2025 to 17.99 USD Billion by 2035, exhibiting a compound annual growth rate (CAGR) of 6.08 during the forecast period 2025 - 2035.

    Key Market Trends & Highlights

    The Electronic Toll Collection Market is poised for substantial growth driven by technological advancements and evolving consumer preferences.

    • Technological advancements are reshaping the Electronic Toll Collection Market, enhancing efficiency and user experience.
    • The shift towards contactless payments is gaining momentum, particularly in North America, where convenience is paramount.
    • Public-private partnerships are increasingly facilitating the development of tolling infrastructure, especially in the Asia-Pacific region.
    • Key market drivers include rising urbanization and government initiatives aimed at promoting smart transportation solutions.

    Market Size & Forecast

    2024 Market Size 9.4 (USD Billion)
    2035 Market Size 17.99 (USD Billion)
    CAGR (2025 - 2035) 6.08%
    Largest Regional Market Share in 2024 North America

    Major Players

    <p>TransCore (US), Kapsch TrafficCom (AT), Cubic Corporation (US), Thales Group (FR), Siemens Mobility (DE), Conduent (US), Abertis (ES), E-ZPass (US), TollPlus (IN)</p>

    Market Trends

    The Electronic Toll Collection Market is currently experiencing a transformative phase, driven by advancements in technology and increasing demand for efficient transportation solutions. The integration of automated systems and smart technologies is reshaping how tolling is managed, enhancing user experience while streamlining operations. As urbanization accelerates and traffic congestion becomes a pressing issue, stakeholders are increasingly recognizing the necessity of adopting electronic tolling systems. This shift not only facilitates smoother traffic flow but also contributes to reduced emissions, aligning with global sustainability goals. Moreover, the market appears to be influenced by the growing emphasis on contactless payment methods and the proliferation of mobile applications. These innovations are likely to enhance user convenience, allowing for seamless transactions without the need for physical cash or cards. Additionally, the collaboration between public and private sectors seems to be fostering a more integrated approach to toll collection, potentially leading to standardized systems across regions. As the Electronic Toll Collection Market evolves, it may play a pivotal role in shaping the future of transportation infrastructure, promoting efficiency and sustainability in urban mobility.

    Technological Advancements

    The Electronic Toll Collection Market is witnessing rapid technological innovations, particularly in the areas of automated systems and smart technologies. These advancements are enhancing the efficiency of toll collection processes, reducing wait times, and improving overall user satisfaction.

    Shift Towards Contactless Payments

    There is a noticeable trend towards the adoption of contactless payment solutions within the Electronic Toll Collection Market. This shift is driven by consumer preferences for convenience and speed, allowing users to complete transactions seamlessly without physical interaction.

    Public-Private Partnerships

    The collaboration between public entities and private companies is becoming increasingly prevalent in the Electronic Toll Collection Market. Such partnerships are fostering the development of integrated tolling solutions, which may lead to standardized practices and improved infrastructure.

    <p>The ongoing evolution of smart transportation infrastructure is likely to drive the adoption of electronic toll collection systems, enhancing efficiency and reducing congestion on roadways.</p>

    U.S. Department of Transportation

    Electronic Toll Collection Market Market Drivers

    Increasing Urbanization

    The trend of increasing urbanization appears to be a significant driver for the Electronic Toll Collection Market. As more individuals migrate to urban areas, the demand for efficient transportation systems intensifies. Urban centers often experience heightened traffic congestion, necessitating the implementation of advanced toll collection systems to manage vehicle flow effectively. In many regions, urbanization has led to a rise in vehicle ownership, which correlates with increased toll revenues. For instance, studies indicate that urban areas with electronic tolling systems can reduce congestion by up to 30 percent, thereby enhancing the overall efficiency of transportation networks. This growing urban population is likely to propel the adoption of electronic toll collection solutions, as municipalities seek to modernize their infrastructure and improve traffic management.

    Government Initiatives and Regulations

    Government initiatives and regulations are pivotal in shaping the Electronic Toll Collection Market. Many governments are actively promoting the adoption of electronic tolling systems as part of broader transportation policies aimed at reducing congestion and improving road safety. For example, regulatory frameworks that mandate the use of electronic toll collection in new infrastructure projects can significantly boost market growth. In certain regions, government incentives for adopting smart transportation technologies have led to a marked increase in electronic tolling installations. Data suggests that regions with supportive government policies have witnessed a 25 percent increase in electronic toll collection usage over the past few years. Such initiatives not only facilitate smoother traffic flow but also contribute to enhanced revenue generation for public infrastructure.

    Environmental Concerns and Sustainability

    Environmental concerns and sustainability are becoming increasingly relevant in the Electronic Toll Collection Market. As awareness of climate change and pollution rises, there is a growing push for transportation solutions that minimize environmental impact. Electronic toll collection systems can contribute to sustainability efforts by promoting the use of public transportation and reducing vehicle emissions through efficient traffic management. Studies indicate that implementing electronic tolling can lead to a reduction in greenhouse gas emissions by up to 20 percent in heavily trafficked areas. This alignment with sustainability goals is likely to attract investments from both public and private sectors, as stakeholders seek to enhance their environmental credentials. The integration of eco-friendly practices within the electronic toll collection framework may also lead to the development of innovative solutions that further support sustainable transportation initiatives.

    Technological Innovations in Tolling Systems

    Technological innovations in tolling systems are a driving force behind the growth of the Electronic Toll Collection Market. Advancements in technology, such as the development of RFID tags, license plate recognition, and mobile payment solutions, have revolutionized the way tolls are collected. These innovations not only enhance the efficiency of toll collection but also improve user convenience, as drivers can pass through toll booths without stopping. The market for electronic toll collection technologies is expected to witness substantial growth, with projections indicating a potential increase of 20 percent in adoption rates over the next few years. As technology continues to evolve, the integration of artificial intelligence and data analytics into tolling systems may further optimize operations and enhance revenue collection. This ongoing technological evolution is likely to play a crucial role in shaping the future landscape of the electronic toll collection market.

    Rising Demand for Smart Transportation Solutions

    The rising demand for smart transportation solutions is a crucial driver for the Electronic Toll Collection Market. As cities evolve, there is a growing emphasis on integrating technology into transportation systems to enhance efficiency and user experience. Smart transportation solutions, including electronic toll collection, are increasingly viewed as essential components of modern infrastructure. The market for smart transportation is projected to grow at a compound annual growth rate of approximately 15 percent over the next five years, indicating a robust appetite for innovative solutions. This trend is likely to encourage investments in electronic tolling technologies, as stakeholders recognize the potential for improved traffic management and reduced operational costs. Consequently, the integration of electronic toll collection systems into smart city initiatives is expected to gain momentum, further driving market expansion.

    Market Segment Insights

    By Technology: Radio Frequency Identification (Largest) vs. Automatic Number Plate Recognition (Fastest-Growing)

    <p>The Electronic Toll Collection Market is primarily driven by technologies such as Radio Frequency Identification (RFID) and Automatic Number Plate Recognition (ANPR). RFID remains the largest segment, widely implemented due to its reliability and speed in toll processing. In comparison, ANPR has garnered significant attention and uptake, emerging as the fastest-growing segment as more regions seek to modernize their toll collection systems with advanced imaging technologies.</p>

    <p>Technology: RFID (Dominant) vs. ANPR (Emerging)</p>

    <p>Radio Frequency Identification (RFID) has established itself as the dominant technology in the Electronic Toll Collection Market, offering seamless and instantaneous toll collection with minimal user intervention. This technology depends on tag-reader communication, enabling vehicles equipped with RFID tags to pass through toll points without stopping. Emerging as a challenger, Automatic Number Plate Recognition (ANPR) technology focuses on capturing vehicle license plates using high-resolution cameras, making it particularly attractive for its adaptability in various environments, including urban tolling solutions. As smart cities evolve, both technologies will likely coexist, complementing each other by combining speed with enhanced surveillance capabilities.</p>

    By Component: On-Board Units (Largest) vs. Payment Processing Solutions (Fastest-Growing)

    <p>In the Electronic Toll Collection Market, the On-Board Units (OBUs) hold the largest market share, as they are essential for the functionality of electronic toll systems. They enable seamless toll collection, providing value to both operators and drivers. The Back Office Systems and Roadside Equipment follow closely, playing critical roles in supporting the infrastructure and operational needs of toll collection. Payment Processing Solutions, while smaller, are crucial for facilitating frictionless transactions and enhancing user experience. The growth trends within this segment are propelling On-Board Units to dominate, largely due to technological advancements and increased adoption of smart transportation systems. Payment Processing Solutions are emerging rapidly, driven by the rising demand for contactless payments and the shift towards digital solutions. As more regions adopt electronic tolling, the necessity for efficient and integrated systems will further boost growth in these component areas.</p>

    <p>On-Board Units (Dominant) vs. Payment Processing Solutions (Emerging)</p>

    <p>On-Board Units (OBUs) serve as the backbone of the Electronic Toll Collection systems, acting as the primary interface between vehicles and toll infrastructure. Their dominance is fueled by extensive installation in vehicles across various regions, ensuring reliable and efficient functionality for toll collection processes. As technology evolves, OBUs are being integrated with navigation and telematics systems to enhance user experience and operational efficiency. In contrast, Payment Processing Solutions represent an emerging segment responding to the growing need for flexible and secure payment methods in tolling systems. The rapid increase in digital payment adoption has led to innovative solutions tailored for toll collection, such as mobile payments and cloud-based processing. This segment is characterized by high adaptability, focusing on user convenience and operational efficiency.</p>

    By Application: Highway Tolling (Largest) vs. Urban Tolling (Fastest-Growing)

    <p>The Electronic Toll Collection Market showcases a diverse application landscape with Highway Tolling leading the way as the largest segment. With the increasing number of vehicles on highways, this segment enables efficient tolling solutions that streamline traffic and enhance revenue collection for government bodies. Following closely is Urban Tolling which, as cities face mounting congestion challenges, presents a critical solution to manage urban traffic flows effectively. Moreover, the growth trends indicate that Urban Tolling is rapidly gaining traction, being the fastest-growing segment in the market. Urban centers are investing heavily in smart infrastructure to reduce congestion and improve traffic management through technologies such as automatic number plate recognition and real-time traffic monitoring. As these investments continue, Urban Tolling is positioned to significantly expand its footprint in the coming years.</p>

    <p>Highway Tolling (Dominant) vs. Congestion Pricing (Emerging)</p>

    <p>Highway Tolling stands as the dominant application in the Electronic Toll Collection Market, primarily due to its maturity and widespread implementation across numerous highways. This segment effectively reduces traffic congestion and enhances travel efficiency, making it integral to national transport systems. In contrast, Congestion Pricing is an emerging application gaining momentum within urban areas aiming to alleviate traffic by incentivizing off-peak travel. This strategy involves charging drivers during peak hours to encourage alternative transport modes or carpooling. While still developing, Congestion Pricing benefits from advancements in technology and public policy shifts focused on sustainable urban mobility. As congestion in cities grows, this segment is expected to grow rapidly, especially as cities look to innovative solutions to manage urban traffic.</p>

    By End Use: Government (Largest) vs. Private Operators (Fastest-Growing)

    <p>The Electronic Toll Collection Market is primarily segmented into Government, Private Operators, and Transport Authorities. Among these segments, Government entities hold the largest share, leveraging their control over infrastructure and tolling regulations. In recent years, Private Operators have been emerging as significant players, capitalizing on advancements in technology and a growing demand for efficient toll collection systems. Transport Authorities, while crucial for operation, play a supplementary role in this dynamic market, often collaborating with government and private entities.</p>

    <p>End Use: Government (Dominant) vs. Private Operators (Emerging)</p>

    <p>Government entities dominate the Electronic Toll Collection Market due to their extensive infrastructure and regulatory authority. They implement large-scale toll systems, ensuring seamless traffic flow while generating revenue for public projects. This segment is characterized by long-term contracts and partnerships with technology providers. On the other hand, Private Operators are rapidly emerging, driven by innovation and consumer demands for more flexible and user-friendly tolling solutions. They are adopting advanced technologies, such as mobile apps and RFID, to enhance user experience and improve collection efficiency. The synergy between Government and Private Operators is expected to shape the future of this market.</p>

    Get more detailed insights about Electronic Toll Collection Market Research Report -Forecast to 2035

    Regional Insights

    North America : Leading Market for Innovation

    North America is the largest market for electronic toll collection (ETC), holding approximately 45% of the global market share. The growth is driven by increasing vehicle ownership, urbanization, and the need for efficient traffic management. Regulatory support, such as the Federal Highway Administration's initiatives, further catalyzes market expansion. The U.S. and Canada are the primary contributors, with a strong push towards smart transportation solutions. The competitive landscape is robust, featuring key players like TransCore, Cubic Corporation, and E-ZPass. These companies are at the forefront of technological advancements, offering innovative solutions that enhance user experience and operational efficiency. The presence of established firms and ongoing investments in infrastructure development solidify North America's position as a leader in the ETC market.

    Europe : Emerging Market with Regulations

    Europe is witnessing significant growth in the electronic toll collection market, accounting for approximately 30% of the global share. The demand is driven by stringent regulations aimed at reducing traffic congestion and promoting sustainable transport solutions. Countries like Germany and France are leading the charge, implementing advanced tolling systems that integrate with smart city initiatives. The European Union's directives on transport efficiency further bolster market growth. Leading countries in this region include Germany, France, and the UK, where companies like Kapsch TrafficCom and Thales Group are prominent. The competitive landscape is characterized by a mix of established players and innovative startups, all vying for market share. The focus on interoperability and user-friendly solutions is shaping the future of ETC in Europe.

    Asia-Pacific : Rapid Growth in Emerging Economies

    The Asia-Pacific region is rapidly emerging as a significant player in the electronic toll collection market, holding around 20% of the global share. The growth is fueled by increasing urbanization, rising disposable incomes, and government initiatives aimed at improving transportation infrastructure. Countries like China and India are at the forefront, implementing advanced tolling systems to manage their growing traffic demands effectively. China is the largest market in the region, with substantial investments in smart transportation technologies. Key players such as TollPlus and local firms are actively participating in this competitive landscape. The focus on integrating ETC with mobile payment solutions and enhancing user convenience is driving innovation and market penetration in Asia-Pacific, making it a dynamic region for future growth.

    Middle East and Africa : Emerging Market with Potential

    The Middle East and Africa region is gradually developing its electronic toll collection market, currently holding about 5% of the global share. The growth is primarily driven by increasing investments in infrastructure and the need for efficient traffic management solutions. Countries like South Africa and the UAE are leading the way, implementing modern tolling systems to address urban congestion and enhance revenue collection. The competitive landscape is still in its nascent stages, with a mix of local and international players entering the market. Companies are focusing on developing user-friendly solutions that cater to the unique needs of the region. The potential for growth is significant, especially as governments prioritize smart city initiatives and sustainable transport solutions, paving the way for future advancements in ETC.

    Key Players and Competitive Insights

    The Electronic Toll Collection Market is currently characterized by a dynamic competitive landscape, driven by technological advancements and increasing demand for efficient transportation solutions. Key players such as TransCore (US), Kapsch TrafficCom (AT), and Cubic Corporation (US) are at the forefront, each adopting distinct strategies to enhance their market positioning. TransCore (US) focuses on innovation through the development of advanced tolling technologies, while Kapsch TrafficCom (AT) emphasizes regional expansion, particularly in Europe and North America. Cubic Corporation (US) is leveraging partnerships to integrate smart city solutions into its tolling systems, thereby enhancing user experience and operational efficiency. Collectively, these strategies contribute to a competitive environment that is increasingly centered around technological innovation and customer-centric solutions.

    In terms of business tactics, companies are increasingly localizing manufacturing and optimizing supply chains to enhance operational efficiency. The market structure appears moderately fragmented, with several players vying for market share. However, the influence of key players is substantial, as they set industry standards and drive technological advancements that smaller companies often follow. This competitive structure fosters an environment where innovation is paramount, and companies must continuously adapt to maintain their market positions.

    In August 2025, Kapsch TrafficCom (AT) announced a strategic partnership with a leading technology firm to develop AI-driven tolling solutions. This collaboration is poised to enhance the efficiency of toll collection processes and improve traffic management systems. The integration of AI technology is likely to provide Kapsch with a competitive edge, enabling it to offer more sophisticated solutions that meet the evolving needs of transportation authorities.

    In September 2025, Cubic Corporation (US) launched a new cloud-based tolling platform designed to streamline operations for transportation agencies. This platform is expected to facilitate real-time data analytics and improve revenue collection efficiency. The strategic importance of this launch lies in Cubic's ability to position itself as a leader in digital transformation within the tolling sector, potentially attracting new clients seeking modernized solutions.

    In October 2025, TransCore (US) unveiled a new suite of mobile applications aimed at enhancing user engagement and providing real-time toll information. This initiative reflects TransCore's commitment to customer-centric innovation, which is increasingly vital in a market where user experience can significantly influence adoption rates. By prioritizing mobile technology, TransCore is likely to strengthen its market presence and appeal to a broader audience.

    As of October 2025, the Electronic Toll Collection Market is witnessing trends that emphasize digitalization, sustainability, and the integration of artificial intelligence. Strategic alliances are becoming more prevalent, as companies recognize the value of collaboration in driving innovation. Looking ahead, competitive differentiation is expected to evolve, shifting from traditional price-based competition to a focus on technological innovation, supply chain reliability, and enhanced customer experiences. This transition underscores the necessity for companies to invest in cutting-edge technologies and strategic partnerships to remain competitive in an increasingly complex market.

    Key Companies in the Electronic Toll Collection Market market include

    Industry Developments

    In recent months, the Electronic Toll Collection Market has witnessed increased activity, particularly with advancements in technology and growth in user adoption. Jabil Inc. is indeed expanding; however, the company's primary focus is on strategic growth in photonics, AI infrastructure, and sustainable operations, rather than explicit "sustainable electronics manufacturing processes." Jabil announced the establishment of a new photonics factory in Gujarat, India, in March 2025.

    The facility will support silicon photonics and co-packaged optics, and it was established in accordance with an MoU that was signed in November 2024. In March 2025, they also published a Sustainability Progress Report for FY 2024, which included a 46% decrease in GHG emissions from 2019 levels, landfill diversion milestones, the acquisition of Mikros Technologies for energy-efficient liquid refrigeration, and the membership of the Circular Electronics Partnership.Universal Scientific Industrial (USI) has experienced growth as a result of the increasing demand for high-performance computing modules, particularly in the server and networking sectors.

    However, the majority of this growth is associated with 5G and networking infrastructure, rather than HPC alone. There were no recent announcements that were specifically relevant to that context.In September 2023, Foxconn Technology Group did not acquire a controlling stake in a local semiconductor firm. In July 2023, Foxconn terminated its joint venture with Vedanta and redirected its attention to the mobile and component assembly facilities in Chennai, Bangalore, and Hyderabad in India. They have ongoing investments; however, there has been no confirmed acquisition of a local semiconductor stake.

    Future Outlook

    Electronic Toll Collection Market Future Outlook

    <p>The Electronic Toll Collection Market is projected to grow at a 6.08% CAGR from 2024 to 2035, driven by technological advancements, increased urbanization, and the need for efficient traffic management.</p>

    New opportunities lie in:

    • <p>Integration of AI-driven analytics for traffic flow optimization.</p>
    • <p>Development of mobile payment solutions for seamless toll transactions.</p>
    • <p>Expansion of cross-border tolling systems to enhance regional connectivity.</p>

    <p>By 2035, the market is expected to be robust, driven by innovation and increased adoption.</p>

    Market Segmentation

    Electronic Toll Collection Market End Use Outlook

    • Government
    • Private Operators
    • Transport Authorities

    Electronic Toll Collection Market Component Outlook

    • On-Board Units
    • Back Office Systems
    • Roadside Equipment
    • Payment Processing Solutions

    Electronic Toll Collection Market Technology Outlook

    • Radio Frequency Identification
    • Automatic Number Plate Recognition
    • Smartphone Applications
    • Contactless Payment Systems

    Electronic Toll Collection Market Application Outlook

    • Highway Tolling
    • Urban Tolling
    • Congestion Pricing

    Report Scope

    MARKET SIZE 20249.4(USD Billion)
    MARKET SIZE 20259.972(USD Billion)
    MARKET SIZE 203517.99(USD Billion)
    COMPOUND ANNUAL GROWTH RATE (CAGR)6.08% (2024 - 2035)
    REPORT COVERAGERevenue Forecast, Competitive Landscape, Growth Factors, and Trends
    BASE YEAR2024
    Market Forecast Period2025 - 2035
    Historical Data2019 - 2024
    Market Forecast UnitsUSD Billion
    Key Companies ProfiledMarket analysis in progress
    Segments CoveredMarket segmentation analysis in progress
    Key Market OpportunitiesIntegration of advanced technologies enhances efficiency in the Electronic Toll Collection Market.
    Key Market DynamicsTechnological advancements and regulatory changes drive the evolution of Electronic Toll Collection systems worldwide.
    Countries CoveredNorth America, Europe, APAC, South America, MEA

    FAQs

    What was the expected market size of the Electronic Toll Collection Market in 2024?

    The Electronic Toll Collection Market was valued at 9.4 USD Billion in 2024.

    What is the projected market size for the Electronic Toll Collection Market by 2035?

    By 2035, the Electronic Toll Collection Market is projected to reach a value of 18.0 USD Billion.

    What is the expected compound annual growth rate (CAGR) for the Electronic Toll Collection Market from 2025 to 2035?

    The expected CAGR for the Electronic Toll Collection Market from 2025 to 2035 is 6.08%.

    Which region dominated the Electronic Toll Collection Market in 2024?

    In 2024, North America dominated the Electronic Toll Collection Market with a value of 3.0 USD Billion.

    What will the market size be for the Asia Pacific region in the Electronic Toll Collection Market by 2035?

    By 2035, the Asia Pacific region is projected to reach a market size of 4.8 USD Billion in the Electronic Toll Collection Market.

    Who are the key players in the Electronic Toll Collection Market?

    Some key players in the Electronic Toll Collection Market include Traffic Technologies, Conduent, TagMaster, and TransCore, among others.

    What was the market value for the Radio Frequency Identification technology segment in 2024?

    The Radio Frequency Identification technology segment was valued at 3.5 USD Billion in 2024.

    What is the projected market value for Automatic Number Plate Recognition technology in 2035?

    The Automatic Number Plate Recognition technology is projected to reach a market value of 4.5 USD Billion by 2035.

    What growth opportunities exist in the Electronic Toll Collection Market?

    Growth opportunities in the Electronic Toll Collection Market are driven by technological advancements and increasing demand for efficient toll collection systems.

    How will the Electronic Toll Collection Market be affected by evolving payment technologies?

    Evolving payment technologies like contactless payment systems are expected to significantly impact growth in the Electronic Toll Collection Market, enhancing user convenience.

    1. \r\nElectronic Toll Collection Market, BY Technology (USD Billion)
      1. \r\n\r\nRadio Frequency Identification
      2. \r\n\r\nAutomatic Number Plate Recognition
      3. \r\n\r\nSmartphone Applications
      4. \r\n\r\nContactless Payment Systems
    2. \r\n\r\nElectronic Toll Collection Market, BY Component (USD Billion)
      1. \r\n\r\nOn-Board Units
      2. \r\n\r\nBack Office Systems
      3. \r\n\r\nRoadside Equipment
      4. \r\n\r\nPayment Processing Solutions
    3. \r\n\r\nElectronic Toll Collection Market, BY Application (USD Billion)
      1. \r\n\r\nHighway Tolling
      2. \r\n\r\nUrban Tolling
      3. \r\n\r\nCongestion Pricing
    4. \r\n\r\nElectronic Toll Collection Market, BY End Use (USD Billion)
      1. \r\n\r\nGovernment
      2. \r\n\r\nPrivate Operators
      3. \r\n\r\nTransport Authorities
    5. \r\n\r\nElectronic Toll Collection Market, BY Regional (USD Billion)
      1. \r\n\r\nNorth America
      2. \r\n\r\nUS
      3. \r\n\r\nCanada
      4. \r\n\r\nEurope
      5. \r\n\r\nGermany
      6. \r\n\r\nUK
      7. \r\n\r\nFrance
      8. \r\n\r\nRussia
      9. \r\n\r\nItaly
      10. \r\n\r\nSpain
      11. \r\n\r\nRest of Europe
      12. \r\n\r\nAPAC
      13. \r\n\r\nChina
      14. \r\n\r\nIndia
      15. \r\n\r\nJapan
      16. \r\n\r\nSouth Korea
      17. \r\n\r\nMalaysia
      18. \r\n\r\nThailand
      19. \r\n\r\nIndonesia
      20. \r\n\r\nRest of APAC
      21. \r\n\r\nSouth America
      22. \r\n\r\nBrazil
      23. \r\n\r\nMexico
      24. \r\n\r\nArgentina
      25. \r\n\r\nRest of South America
      26. \r\n\r\nMEA
      27. \r\n\r\nGCC Countries
      28. \r\n\r\nSouth Africa
      29. \r\n\r\nRest of MEA
      30. \r\n\r\n
      31. \r\n
      32. \r\n
      33. \r\nCompetitive Landscape
      34. \r\n\r\nOverview
      35. \r\n\r\nCompetitive Analysis
      36. \r\n\r\nMarket share Analysis
      37. \r\n\r\nMajor Growth Strategy in the Electronic Toll Collection Market
      38. \r\n\r\nCompetitive Benchmarking
      39. \r\n\r\nLeading Players in Terms of Number of Developments in the Electronic Toll Collection Market
      40. \r\n\r\nKey developments and growth strategies
      41. \r\n\r\nNew Product Launch/Service Deployment
      42. \r\n\r\nMerger & Acquisitions
      43. \r\n\r\nJoint Ventures
      44. \r\n\r\nMajor Players Financial Matrix
      45. \r\n\r\nSales and Operating Income
      46. \r\n\r\nMajor Players R&D Expenditure. 2023
      47. \r\n\r\nCompany Profiles
      48. \r\n\r\nEasyPark Group
      49. \r\n\r\nFinancial Overview
      50. \r\n\r\nProducts Offered
      51. \r\n\r\nKey Developments
      52. \r\n\r\nSWOT Analysis
      53. \r\n\r\nKey Strategies
      54. \r\n\r\nFujitsu
      55. \r\n\r\nFinancial Overview
      56. \r\n\r\nProducts Offered
      57. \r\n\r\nKey Developments
      58. \r\n\r\nSWOT Analysis
      59. \r\n\r\nKey Strategies
      60. \r\n\r\nConduent
      61. \r\n\r\nFinancial Overview
      62. \r\n\r\nProducts Offered
      63. \r\n\r\nKey Developments
      64. \r\n\r\nSWOT Analysis
      65. \r\n\r\nKey Strategies
      66. \r\n\r\nTransCore
      67. \r\n\r\nFinancial Overview
      68. \r\n\r\nProducts Offered
      69. \r\n\r\nKey Developments
      70. \r\n\r\nSWOT Analysis
      71. \r\n\r\nKey Strategies
      72. \r\n\r\nItron
      73. \r\n\r\nFinancial Overview
      74. \r\n\r\nProducts Offered
      75. \r\n\r\nKey Developments
      76. \r\n\r\nSWOT Analysis
      77. \r\n\r\nKey Strategies
      78. \r\n\r\nQFree ASA
      79. \r\n\r\nFinancial Overview
      80. \r\n\r\nProducts Offered
      81. \r\n\r\nKey Developments
      82. \r\n\r\nSWOT Analysis
      83. \r\n\r\nKey Strategies
      84. \r\n\r\nSensys Networks
      85. \r\n\r\nFinancial Overview
      86. \r\n\r\nProducts Offered
      87. \r\n\r\nKey Developments
      88. \r\n\r\nSWOT Analysis
      89. \r\n\r\nKey Strategies
      90. \r\n\r\nKiewit Corporation
      91. \r\n\r\nFinancial Overview
      92. \r\n\r\nProducts Offered
      93. \r\n\r\nKey Developments
      94. \r\n\r\nSWOT Analysis
      95. \r\n\r\nKey Strategies
      96. \r\n\r\nCubic Corporation
      97. \r\n\r\nFinancial Overview
      98. \r\n\r\nProducts Offered
      99. \r\n\r\nKey Developments
      100. \r\n\r\nSWOT Analysis
      101. \r\n\r\nKey Strategies
      102. \r\n\r\nKapsch TrafficCom
      103. \r\n\r\nFinancial Overview
      104. \r\n\r\nProducts Offered
      105. \r\n\r\nKey Developments
      106. \r\n\r\nSWOT Analysis
      107. \r\n\r\nKey Strategies
      108. \r\n\r\nCivix
      109. \r\n\r\nFinancial Overview
      110. \r\n\r\nProducts Offered
      111. \r\n\r\nKey Developments
      112. \r\n\r\nSWOT Analysis
      113. \r\n\r\nKey Strategies
      114. \r\n\r\nSiemens AG
      115. \r\n\r\nFinancial Overview
      116. \r\n\r\nProducts Offered
      117. \r\n\r\nKey Developments
      118. \r\n\r\nSWOT Analysis
      119. \r\n\r\nKey Strategies
      120. \r\n\r\nMcCain Inc.
      121. \r\n\r\nFinancial Overview
      122. \r\n\r\nProducts Offered
      123. \r\n\r\nKey Developments
      124. \r\n\r\nSWOT Analysis
      125. \r\n\r\nKey Strategies
      126. \r\n\r\nThales Group
      127. \r\n\r\nFinancial Overview
      128. \r\n\r\nProducts Offered
      129. \r\n\r\nKey Developments
      130. \r\n\r\nSWOT Analysis
      131. \r\n\r\nKey Strategies
      132. \r\n\r\nATS Traffic
      133. \r\n\r\nFinancial Overview
      134. \r\n\r\nProducts Offered
      135. \r\n\r\nKey Developments
      136. \r\n\r\nSWOT Analysis
      137. \r\n\r\nKey Strategies
      138. \r\n\r\nAppendix
      139. \r\n\r\nReferences
      140. \r\n\r\nRelated Reports
      141. \r\n\r\n
      142. LIST Of tables
      143. \r\n
      144. \r\n
      145. \r\nLIST OF ASSUMPTIONS
    6. \r\n\r\nNorth America Electronic Toll Collection Market SIZE ESTIMATES & FORECAST, BY TECHNOLOGY, 2019-2035 (USD Billions)
    7. \r\n\r\nNorth America Electronic Toll Collection Market SIZE ESTIMATES & FORECAST, BY COMPONENT, 2019-2035 (USD Billions)
    8. \r\n\r\nNorth America Electronic Toll Collection Market SIZE ESTIMATES & FORECAST, BY APPLICATION, 2019-2035 (USD Billions)
    9. \r\n\r\nNorth America Electronic Toll Collection Market SIZE ESTIMATES & FORECAST, BY END USE, 2019-2035 (USD Billions)
    10. \r\n\r\nNorth America Electronic Toll Collection Market SIZE ESTIMATES & FORECAST, BY REGIONAL, 2019-2035 (USD Billions)
    11. \r\n\r\nUS Electronic Toll Collection Market SIZE ESTIMATES & FORECAST, BY TECHNOLOGY, 2019-2035 (USD Billions)
    12. \r\n\r\nUS Electronic Toll Collection Market SIZE ESTIMATES & FORECAST, BY COMPONENT, 2019-2035 (USD Billions)
    13. \r\n\r\nUS Electronic Toll Collection Market SIZE ESTIMATES & FORECAST, BY APPLICATION, 2019-2035 (USD Billions)
    14. \r\n\r\nUS Electronic Toll Collection Market SIZE ESTIMATES & FORECAST, BY END USE, 2019-2035 (USD Billions)
    15. \r\n\r\nUS Electronic Toll Collection Market SIZE ESTIMATES & FORECAST, BY REGIONAL, 2019-2035 (USD Billions)
    16. \r\n\r\nCanada Electronic Toll Collection Market SIZE ESTIMATES & FORECAST, BY TECHNOLOGY, 2019-2035 (USD Billions)
    17. \r\n\r\nCanada Electronic Toll Collection Market SIZE ESTIMATES & FORECAST, BY COMPONENT, 2019-2035 (USD Billions)
    18. \r\n\r\nCanada Electronic Toll Collection Market SIZE ESTIMATES & FORECAST, BY APPLICATION, 2019-2035 (USD Billions)
    19. \r\n\r\nCanada Electronic Toll Collection Market SIZE ESTIMATES & FORECAST, BY END USE, 2019-2035 (USD Billions)
    20. \r\n\r\nCanada Electronic Toll Collection Market SIZE ESTIMATES & FORECAST, BY REGIONAL, 2019-2035 (USD Billions)
    21. \r\n\r\nEurope Electronic Toll Collection Market SIZE ESTIMATES & FORECAST, BY TECHNOLOGY, 2019-2035 (USD Billions)
    22. \r\n\r\nEurope Electronic Toll Collection Market SIZE ESTIMATES & FORECAST, BY COMPONENT, 2019-2035 (USD Billions)
    23. \r\n\r\nEurope Electronic Toll Collection Market SIZE ESTIMATES & FORECAST, BY APPLICATION, 2019-2035 (USD Billions)
    24. \r\n\r\nEurope Electronic Toll Collection Market SIZE ESTIMATES & FORECAST, BY END USE, 2019-2035 (USD Billions)
    25. \r\n\r\nEurope Electronic Toll Collection Market SIZE ESTIMATES & FORECAST, BY REGIONAL, 2019-2035 (USD Billions)
    26. \r\n\r\nGermany Electronic Toll Collection Market SIZE ESTIMATES & FORECAST, BY TECHNOLOGY, 2019-2035 (USD Billions)
    27. \r\n\r\nGermany Electronic Toll Collection Market SIZE ESTIMATES & FORECAST, BY COMPONENT, 2019-2035 (USD Billions)
    28. \r\n\r\nGermany Electronic Toll Collection Market SIZE ESTIMATES & FORECAST, BY APPLICATION, 2019-2035 (USD Billions)
    29. \r\n\r\nGermany Electronic Toll Collection Market SIZE ESTIMATES & FORECAST, BY END USE, 2019-2035 (USD Billions)
    30. \r\n\r\nGermany Electronic Toll Collection Market SIZE ESTIMATES & FORECAST, BY REGIONAL, 2019-2035 (USD Billions)
    31. \r\n\r\nUK Electronic Toll Collection Market SIZE ESTIMATES & FORECAST, BY TECHNOLOGY, 2019-2035 (USD Billions)
    32. \r\n\r\nUK Electronic Toll Collection Market SIZE ESTIMATES & FORECAST, BY COMPONENT, 2019-2035 (USD Billions)
    33. \r\n\r\nUK Electronic Toll Collection Market SIZE ESTIMATES & FORECAST, BY APPLICATION, 2019-2035 (USD Billions)
    34. \r\n\r\nUK Electronic Toll Collection Market SIZE ESTIMATES & FORECAST, BY END USE, 2019-2035 (USD Billions)
    35. \r\n\r\nUK Electronic Toll Collection Market SIZE ESTIMATES & FORECAST, BY REGIONAL, 2019-2035 (USD Billions)
    36. \r\n\r\nFrance Electronic Toll Collection Market SIZE ESTIMATES & FORECAST, BY TECHNOLOGY, 2019-2035 (USD Billions)
    37. \r\n\r\nFrance Electronic Toll Collection Market SIZE ESTIMATES & FORECAST, BY COMPONENT, 2019-2035 (USD Billions)
    38. \r\n\r\nFrance Electronic Toll Collection Market SIZE ESTIMATES & FORECAST, BY APPLICATION, 2019-2035 (USD Billions)
    39. \r\n\r\nFrance Electronic Toll Collection Market SIZE ESTIMATES & FORECAST, BY END USE, 2019-2035 (USD Billions)
    40. \r\n\r\nFrance Electronic Toll Collection Market SIZE ESTIMATES & FORECAST, BY REGIONAL, 2019-2035 (USD Billions)
    41. \r\n\r\nRussia Electronic Toll Collection Market SIZE ESTIMATES & FORECAST, BY TECHNOLOGY, 2019-2035 (USD Billions)
    42. \r\n\r\nRussia Electronic Toll Collection Market SIZE ESTIMATES & FORECAST, BY COMPONENT, 2019-2035 (USD Billions)
    43. \r\n\r\nRussia Electronic Toll Collection Market SIZE ESTIMATES & FORECAST, BY APPLICATION, 2019-2035 (USD Billions)
    44. \r\n\r\nRussia Electronic Toll Collection Market SIZE ESTIMATES & FORECAST, BY END USE, 2019-2035 (USD Billions)
    45. \r\n\r\nRussia Electronic Toll Collection Market SIZE ESTIMATES & FORECAST, BY REGIONAL, 2019-2035 (USD Billions)
    46. \r\n\r\nItaly Electronic Toll Collection Market SIZE ESTIMATES & FORECAST, BY TECHNOLOGY, 2019-2035 (USD Billions)
    47. \r\n\r\nItaly Electronic Toll Collection Market SIZE ESTIMATES & FORECAST, BY COMPONENT, 2019-2035 (USD Billions)
    48. \r\n\r\nItaly Electronic Toll Collection Market SIZE ESTIMATES & FORECAST, BY APPLICATION, 2019-2035 (USD Billions)
    49. \r\n\r\nItaly Electronic Toll Collection Market SIZE ESTIMATES & FORECAST, BY END USE, 2019-2035 (USD Billions)
    50. \r\n\r\nItaly Electronic Toll Collection Market SIZE ESTIMATES & FORECAST, BY REGIONAL, 2019-2035 (USD Billions)
    51. \r\n\r\nSpain Electronic Toll Collection Market SIZE ESTIMATES & FORECAST, BY TECHNOLOGY, 2019-2035 (USD Billions)
    52. \r\n\r\nSpain Electronic Toll Collection Market SIZE ESTIMATES & FORECAST, BY COMPONENT, 2019-2035 (USD Billions)
    53. \r\n\r\nSpain Electronic Toll Collection Market SIZE ESTIMATES & FORECAST, BY APPLICATION, 2019-2035 (USD Billions)
    54. \r\n\r\nSpain Electronic Toll Collection Market SIZE ESTIMATES & FORECAST, BY END USE, 2019-2035 (USD Billions)
    55. \r\n\r\nSpain Electronic Toll Collection Market SIZE ESTIMATES & FORECAST, BY REGIONAL, 2019-2035 (USD Billions)
    56. \r\n\r\nRest of Europe Electronic Toll Collection Market SIZE ESTIMATES & FORECAST, BY TECHNOLOGY, 2019-2035 (USD Billions)
    57. \r\n\r\nRest of Europe Electronic Toll Collection Market SIZE ESTIMATES & FORECAST, BY COMPONENT, 2019-2035 (USD Billions)
    58. \r\n\r\nRest of Europe Electronic Toll Collection Market SIZE ESTIMATES & FORECAST, BY APPLICATION, 2019-2035 (USD Billions)
    59. \r\n\r\nRest of Europe Electronic Toll Collection Market SIZE ESTIMATES & FORECAST, BY END USE, 2019-2035 (USD Billions)
    60. \r\n\r\nRest of Europe Electronic Toll Collection Market SIZE ESTIMATES & FORECAST, BY REGIONAL, 2019-2035 (USD Billions)
    61. \r\n\r\nAPAC Electronic Toll Collection Market SIZE ESTIMATES & FORECAST, BY TECHNOLOGY, 2019-2035 (USD Billions)
    62. \r\n\r\nAPAC Electronic Toll Collection Market SIZE ESTIMATES & FORECAST, BY COMPONENT, 2019-2035 (USD Billions)
    63. \r\n\r\nAPAC Electronic Toll Collection Market SIZE ESTIMATES & FORECAST, BY APPLICATION, 2019-2035 (USD Billions)
    64. \r\n\r\nAPAC Electronic Toll Collection Market SIZE ESTIMATES & FORECAST, BY END USE, 2019-2035 (USD Billions)
    65. \r\n\r\nAPAC Electronic Toll Collection Market SIZE ESTIMATES & FORECAST, BY REGIONAL, 2019-2035 (USD Billions)
    66. \r\n\r\nChina Electronic Toll Collection Market SIZE ESTIMATES & FORECAST, BY TECHNOLOGY, 2019-2035 (USD Billions)
    67. \r\n\r\nChina Electronic Toll Collection Market SIZE ESTIMATES & FORECAST, BY COMPONENT, 2019-2035 (USD Billions)
    68. \r\n\r\nChina Electronic Toll Collection Market SIZE ESTIMATES & FORECAST, BY APPLICATION, 2019-2035 (USD Billions)
    69. \r\n\r\nChina Electronic Toll Collection Market SIZE ESTIMATES & FORECAST, BY END USE, 2019-2035 (USD Billions)
    70. \r\n\r\nChina Electronic Toll Collection Market SIZE ESTIMATES & FORECAST, BY REGIONAL, 2019-2035 (USD Billions)
    71. \r\n\r\nIndia Electronic Toll Collection Market SIZE ESTIMATES & FORECAST, BY TECHNOLOGY, 2019-2035 (USD Billions)
    72. \r\n\r\nIndia Electronic Toll Collection Market SIZE ESTIMATES & FORECAST, BY COMPONENT, 2019-2035 (USD Billions)
    73. \r\n\r\nIndia Electronic Toll Collection Market SIZE ESTIMATES & FORECAST, BY APPLICATION, 2019-2035 (USD Billions)
    74. \r\n\r\nIndia Electronic Toll Collection Market SIZE ESTIMATES & FORECAST, BY END USE, 2019-2035 (USD Billions)
    75. \r\n\r\nIndia Electronic Toll Collection Market SIZE ESTIMATES & FORECAST, BY REGIONAL, 2019-2035 (USD Billions)
    76. \r\n\r\nJapan Electronic Toll Collection Market SIZE ESTIMATES & FORECAST, BY TECHNOLOGY, 2019-2035 (USD Billions)
    77. \r\n\r\nJapan Electronic Toll Collection Market SIZE ESTIMATES & FORECAST, BY COMPONENT, 2019-2035 (USD Billions)
    78. \r\n\r\nJapan Electronic Toll Collection Market SIZE ESTIMATES & FORECAST, BY APPLICATION, 2019-2035 (USD Billions)
    79. \r\n\r\nJapan Electronic Toll Collection Market SIZE ESTIMATES & FORECAST, BY END USE, 2019-2035 (USD Billions)
    80. \r\n\r\nJapan Electronic Toll Collection Market SIZE ESTIMATES & FORECAST, BY REGIONAL, 2019-2035 (USD Billions)
    81. \r\n\r\nSouth Korea Electronic Toll Collection Market SIZE ESTIMATES & FORECAST, BY TECHNOLOGY, 2019-2035 (USD Billions)
    82. \r\n\r\nSouth Korea Electronic Toll Collection Market SIZE ESTIMATES & FORECAST, BY COMPONENT, 2019-2035 (USD Billions)
    83. \r\n\r\nSouth Korea Electronic Toll Collection Market SIZE ESTIMATES & FORECAST, BY APPLICATION, 2019-2035 (USD Billions)
    84. \r\n\r\nSouth Korea Electronic Toll Collection Market SIZE ESTIMATES & FORECAST, BY END USE, 2019-2035 (USD Billions)
    85. \r\n\r\nSouth Korea Electronic Toll Collection Market SIZE ESTIMATES & FORECAST, BY REGIONAL, 2019-2035 (USD Billions)
    86. \r\n\r\nMalaysia Electronic Toll Collection Market SIZE ESTIMATES & FORECAST, BY TECHNOLOGY, 2019-2035 (USD Billions)
    87. \r\n\r\nMalaysia Electronic Toll Collection Market SIZE ESTIMATES & FORECAST, BY COMPONENT, 2019-2035 (USD Billions)
    88. \r\n\r\nMalaysia Electronic Toll Collection Market SIZE ESTIMATES & FORECAST, BY APPLICATION, 2019-2035 (USD Billions)
    89. \r\n\r\nMalaysia Electronic Toll Collection Market SIZE ESTIMATES & FORECAST, BY END USE, 2019-2035 (USD Billions)
    90. \r\n\r\nMalaysia Electronic Toll Collection Market SIZE ESTIMATES & FORECAST, BY REGIONAL, 2019-2035 (USD Billions)
    91. \r\n\r\nThailand Electronic Toll Collection Market SIZE ESTIMATES & FORECAST, BY TECHNOLOGY, 2019-2035 (USD Billions)
    92. \r\n\r\nThailand Electronic Toll Collection Market SIZE ESTIMATES & FORECAST, BY COMPONENT, 2019-2035 (USD Billions)
    93. \r\n\r\nThailand Electronic Toll Collection Market SIZE ESTIMATES & FORECAST, BY APPLICATION, 2019-2035 (USD Billions)
    94. \r\n\r\nThailand Electronic Toll Collection Market SIZE ESTIMATES & FORECAST, BY END USE, 2019-2035 (USD Billions)
    95. \r\n\r\nThailand Electronic Toll Collection Market SIZE ESTIMATES & FORECAST, BY REGIONAL, 2019-2035 (USD Billions)
    96. \r\n\r\nIndonesia Electronic Toll Collection Market SIZE ESTIMATES & FORECAST, BY TECHNOLOGY, 2019-2035 (USD Billions)
    97. \r\n\r\nIndonesia Electronic Toll Collection Market SIZE ESTIMATES & FORECAST, BY COMPONENT, 2019-2035 (USD Billions)
    98. \r\n\r\nIndonesia Electronic Toll Collection Market SIZE ESTIMATES & FORECAST, BY APPLICATION, 2019-2035 (USD Billions)
    99. \r\n\r\nIndonesia Electronic Toll Collection Market SIZE ESTIMATES & FORECAST, BY END USE, 2019-2035 (USD Billions)
    100. \r\n\r\nIndonesia Electronic Toll Collection Market SIZE ESTIMATES & FORECAST, BY REGIONAL, 2019-2035 (USD Billions)
    101. \r\n\r\nRest of APAC Electronic Toll Collection Market SIZE ESTIMATES & FORECAST, BY TECHNOLOGY, 2019-2035 (USD Billions)
    102. \r\n\r\nRest of APAC Electronic Toll Collection Market SIZE ESTIMATES & FORECAST, BY COMPONENT, 2019-2035 (USD Billions)
    103. \r\n\r\nRest of APAC Electronic Toll Collection Market SIZE ESTIMATES & FORECAST, BY APPLICATION, 2019-2035 (USD Billions)
    104. \r\n\r\nRest of APAC Electronic Toll Collection Market SIZE ESTIMATES & FORECAST, BY END USE, 2019-2035 (USD Billions)
    105. \r\n\r\nRest of APAC Electronic Toll Collection Market SIZE ESTIMATES & FORECAST, BY REGIONAL, 2019-2035 (USD Billions)
    106. \r\n\r\nSouth America Electronic Toll Collection Market SIZE ESTIMATES & FORECAST, BY TECHNOLOGY, 2019-2035 (USD Billions)
    107. \r\n\r\nSouth America Electronic Toll Collection Market SIZE ESTIMATES & FORECAST, BY COMPONENT, 2019-2035 (USD Billions)
    108. \r\n\r\nSouth America Electronic Toll Collection Market SIZE ESTIMATES & FORECAST, BY APPLICATION, 2019-2035 (USD Billions)
    109. \r\n\r\nSouth America Electronic Toll Collection Market SIZE ESTIMATES & FORECAST, BY END USE, 2019-2035 (USD Billions)
    110. \r\n\r\nSouth America Electronic Toll Collection Market SIZE ESTIMATES & FORECAST, BY REGIONAL, 2019-2035 (USD Billions)
    111. \r\n\r\nBrazil Electronic Toll Collection Market SIZE ESTIMATES & FORECAST, BY TECHNOLOGY, 2019-2035 (USD Billions)
    112. \r\n\r\nBrazil Electronic Toll Collection Market SIZE ESTIMATES & FORECAST, BY COMPONENT, 2019-2035 (USD Billions)
    113. \r\n\r\nBrazil Electronic Toll Collection Market SIZE ESTIMATES & FORECAST, BY APPLICATION, 2019-2035 (USD Billions)
    114. \r\n\r\nBrazil Electronic Toll Collection Market SIZE ESTIMATES & FORECAST, BY END USE, 2019-2035 (USD Billions)
    115. \r\n\r\nBrazil Electronic Toll Collection Market SIZE ESTIMATES & FORECAST, BY REGIONAL, 2019-2035 (USD Billions)
    116. \r\n\r\nMexico Electronic Toll Collection Market SIZE ESTIMATES & FORECAST, BY TECHNOLOGY, 2019-2035 (USD Billions)
    117. \r\n\r\nMexico Electronic Toll Collection Market SIZE ESTIMATES & FORECAST, BY COMPONENT, 2019-2035 (USD Billions)
    118. \r\n\r\nMexico Electronic Toll Collection Market SIZE ESTIMATES & FORECAST, BY APPLICATION, 2019-2035 (USD Billions)
    119. \r\n\r\nMexico Electronic Toll Collection Market SIZE ESTIMATES & FORECAST, BY END USE, 2019-2035 (USD Billions)
    120. \r\n\r\nMexico Electronic Toll Collection Market SIZE ESTIMATES & FORECAST, BY REGIONAL, 2019-2035 (USD Billions)
    121. \r\n\r\nArgentina Electronic Toll Collection Market SIZE ESTIMATES & FORECAST, BY TECHNOLOGY, 2019-2035 (USD Billions)
    122. \r\n\r\nArgentina Electronic Toll Collection Market SIZE ESTIMATES & FORECAST, BY COMPONENT, 2019-2035 (USD Billions)
    123. \r\n\r\nArgentina Electronic Toll Collection Market SIZE ESTIMATES & FORECAST, BY APPLICATION, 2019-2035 (USD Billions)
    124. \r\n\r\nArgentina Electronic Toll Collection Market SIZE ESTIMATES & FORECAST, BY END USE, 2019-2035 (USD Billions)
    125. \r\n\r\nArgentina Electronic Toll Collection Market SIZE ESTIMATES & FORECAST, BY REGIONAL, 2019-2035 (USD Billions)
    126. \r\n\r\nRest of South America Electronic Toll Collection Market SIZE ESTIMATES & FORECAST, BY TECHNOLOGY, 2019-2035 (USD Billions)
    127. \r\n\r\nRest of South America Electronic Toll Collection Market SIZE ESTIMATES & FORECAST, BY COMPONENT, 2019-2035 (USD Billions)
    128. \r\n\r\nRest of South America Electronic Toll Collection Market SIZE ESTIMATES & FORECAST, BY APPLICATION, 2019-2035 (USD Billions)
    129. \r\n\r\nRest of South America Electronic Toll Collection Market SIZE ESTIMATES & FORECAST, BY END USE, 2019-2035 (USD Billions)
    130. \r\n\r\nRest of South America Electronic Toll Collection Market SIZE ESTIMATES & FORECAST, BY REGIONAL, 2019-2035 (USD Billions)
    131. \r\n\r\nMEA Electronic Toll Collection Market SIZE ESTIMATES & FORECAST, BY TECHNOLOGY, 2019-2035 (USD Billions)
    132. \r\n\r\nMEA Electronic Toll Collection Market SIZE ESTIMATES & FORECAST, BY COMPONENT, 2019-2035 (USD Billions)
    133. \r\n\r\nMEA Electronic Toll Collection Market SIZE ESTIMATES & FORECAST, BY APPLICATION, 2019-2035 (USD Billions)
    134. \r\n\r\nMEA Electronic Toll Collection Market SIZE ESTIMATES & FORECAST, BY END USE, 2019-2035 (USD Billions)
    135. \r\n\r\nMEA Electronic Toll Collection Market SIZE ESTIMATES & FORECAST, BY REGIONAL, 2019-2035 (USD Billions)
    136. \r\n\r\nGCC Countries Electronic Toll Collection Market SIZE ESTIMATES & FORECAST, BY TECHNOLOGY, 2019-2035 (USD Billions)
    137. \r\n\r\nGCC Countries Electronic Toll Collection Market SIZE ESTIMATES & FORECAST, BY COMPONENT, 2019-2035 (USD Billions)
    138. \r\n\r\nGCC Countries Electronic Toll Collection Market SIZE ESTIMATES & FORECAST, BY APPLICATION, 2019-2035 (USD Billions)
    139. \r\n\r\nGCC Countries Electronic Toll Collection Market SIZE ESTIMATES & FORECAST, BY END USE, 2019-2035 (USD Billions)
    140. \r\n\r\nGCC Countries Electronic Toll Collection Market SIZE ESTIMATES & FORECAST, BY REGIONAL, 2019-2035 (USD Billions)
    141. \r\n\r\nSouth Africa Electronic Toll Collection Market SIZE ESTIMATES & FORECAST, BY TECHNOLOGY, 2019-2035 (USD Billions)
    142. \r\n\r\nSouth Africa Electronic Toll Collection Market SIZE ESTIMATES & FORECAST, BY COMPONENT, 2019-2035 (USD Billions)
    143. \r\n\r\nSouth Africa Electronic Toll Collection Market SIZE ESTIMATES & FORECAST, BY APPLICATION, 2019-2035 (USD Billions)
    144. \r\n\r\nSouth Africa Electronic Toll Collection Market SIZE ESTIMATES & FORECAST, BY END USE, 2019-2035 (USD Billions)
    145. \r\n\r\nSouth Africa Electronic Toll Collection Market SIZE ESTIMATES & FORECAST, BY REGIONAL, 2019-2035 (USD Billions)
    146. \r\n\r\nRest of MEA Electronic Toll Collection Market SIZE ESTIMATES & FORECAST, BY TECHNOLOGY, 2019-2035 (USD Billions)
    147. \r\n\r\nRest of MEA Electronic Toll Collection Market SIZE ESTIMATES & FORECAST, BY COMPONENT, 2019-2035 (USD Billions)
    148. \r\n\r\nRest of MEA Electronic Toll Collection Market SIZE ESTIMATES & FORECAST, BY APPLICATION, 2019-2035 (USD Billions)
    149. \r\n\r\nRest of MEA Electronic Toll Collection Market SIZE ESTIMATES & FORECAST, BY END USE, 2019-2035 (USD Billions)
    150. \r\n\r\nRest of MEA Electronic Toll Collection Market SIZE ESTIMATES & FORECAST, BY REGIONAL, 2019-2035 (USD Billions)
      1. \r\n\r\nPRODUCT LAUNCH/PRODUCT DEVELOPMENT/APPROVAL
      2. \r\n\r\nACQUISITION/PARTNERSHIP
      3. \r\n\r\n
      4. \r\n
      5. \r\n
      6. \r\n
      7. \r\n
      8. \r\n
      9. \r\n
      10. \r\n
      11. \r\n
      12. \r\n
      13. \r\n
      14. \r\n
      15. \r\n
      16. \r\n
      17. \r\n
      18. \r\n
      19. \r\n
      20. \r\n
      21. \r\n
      22. \r\n
      23. \r\n
      24. \r\n
      25. \r\n
      26. \r\n
      27. \r\n
      28. \r\n
      29. \r\n
      30. \r\n
      31. \r\n
      32. \r\n
      33. LIST Of figures
      34. \r\n
      35. \r\n
      36. \r\nMARKET SYNOPSIS
      37. \r\n\r\nNORTH AMERICA ELECTRONIC TOLL COLLECTION MARKET ANALYSIS
      38. \r\n\r\nUS ELECTRONIC TOLL COLLECTION MARKET ANALYSIS BY TECHNOLOGY
      39. \r\n\r\nUS ELECTRONIC TOLL COLLECTION MARKET ANALYSIS BY COMPONENT
      40. \r\n\r\nUS ELECTRONIC TOLL COLLECTION MARKET ANALYSIS BY APPLICATION
      41. \r\n\r\nUS ELECTRONIC TOLL COLLECTION MARKET ANALYSIS BY END USE
      42. \r\n\r\nUS ELECTRONIC TOLL COLLECTION MARKET ANALYSIS BY REGIONAL
      43. \r\n\r\nCANADA ELECTRONIC TOLL COLLECTION MARKET ANALYSIS BY TECHNOLOGY
      44. \r\n\r\nCANADA ELECTRONIC TOLL COLLECTION MARKET ANALYSIS BY COMPONENT
      45. \r\n\r\nCANADA ELECTRONIC TOLL COLLECTION MARKET ANALYSIS BY APPLICATION
      46. \r\n\r\nCANADA ELECTRONIC TOLL COLLECTION MARKET ANALYSIS BY END USE
      47. \r\n\r\nCANADA ELECTRONIC TOLL COLLECTION MARKET ANALYSIS BY REGIONAL
      48. \r\n\r\nEUROPE ELECTRONIC TOLL COLLECTION MARKET ANALYSIS
      49. \r\n\r\nGERMANY ELECTRONIC TOLL COLLECTION MARKET ANALYSIS BY TECHNOLOGY
      50. \r\n\r\nGERMANY ELECTRONIC TOLL COLLECTION MARKET ANALYSIS BY COMPONENT
      51. \r\n\r\nGERMANY ELECTRONIC TOLL COLLECTION MARKET ANALYSIS BY APPLICATION
      52. \r\n\r\nGERMANY ELECTRONIC TOLL COLLECTION MARKET ANALYSIS BY END USE
      53. \r\n\r\nGERMANY ELECTRONIC TOLL COLLECTION MARKET ANALYSIS BY REGIONAL
      54. \r\n\r\nUK ELECTRONIC TOLL COLLECTION MARKET ANALYSIS BY TECHNOLOGY
      55. \r\n\r\nUK ELECTRONIC TOLL COLLECTION MARKET ANALYSIS BY COMPONENT
      56. \r\n\r\nUK ELECTRONIC TOLL COLLECTION MARKET ANALYSIS BY APPLICATION
      57. \r\n\r\nUK ELECTRONIC TOLL COLLECTION MARKET ANALYSIS BY END USE
      58. \r\n\r\nUK ELECTRONIC TOLL COLLECTION MARKET ANALYSIS BY REGIONAL
      59. \r\n\r\nFRANCE ELECTRONIC TOLL COLLECTION MARKET ANALYSIS BY TECHNOLOGY
      60. \r\n\r\nFRANCE ELECTRONIC TOLL COLLECTION MARKET ANALYSIS BY COMPONENT
      61. \r\n\r\nFRANCE ELECTRONIC TOLL COLLECTION MARKET ANALYSIS BY APPLICATION
      62. \r\n\r\nFRANCE ELECTRONIC TOLL COLLECTION MARKET ANALYSIS BY END USE
      63. \r\n\r\nFRANCE ELECTRONIC TOLL COLLECTION MARKET ANALYSIS BY REGIONAL
      64. \r\n\r\nRUSSIA ELECTRONIC TOLL COLLECTION MARKET ANALYSIS BY TECHNOLOGY
      65. \r\n\r\nRUSSIA ELECTRONIC TOLL COLLECTION MARKET ANALYSIS BY COMPONENT
      66. \r\n\r\nRUSSIA ELECTRONIC TOLL COLLECTION MARKET ANALYSIS BY APPLICATION
      67. \r\n\r\nRUSSIA ELECTRONIC TOLL COLLECTION MARKET ANALYSIS BY END USE
      68. \r\n\r\nRUSSIA ELECTRONIC TOLL COLLECTION MARKET ANALYSIS BY REGIONAL
      69. \r\n\r\nITALY ELECTRONIC TOLL COLLECTION MARKET ANALYSIS BY TECHNOLOGY
      70. \r\n\r\nITALY ELECTRONIC TOLL COLLECTION MARKET ANALYSIS BY COMPONENT
      71. \r\n\r\nITALY ELECTRONIC TOLL COLLECTION MARKET ANALYSIS BY APPLICATION
      72. \r\n\r\nITALY ELECTRONIC TOLL COLLECTION MARKET ANALYSIS BY END USE
      73. \r\n\r\nITALY ELECTRONIC TOLL COLLECTION MARKET ANALYSIS BY REGIONAL
      74. \r\n\r\nSPAIN ELECTRONIC TOLL COLLECTION MARKET ANALYSIS BY TECHNOLOGY
      75. \r\n\r\nSPAIN ELECTRONIC TOLL COLLECTION MARKET ANALYSIS BY COMPONENT
      76. \r\n\r\nSPAIN ELECTRONIC TOLL COLLECTION MARKET ANALYSIS BY APPLICATION
      77. \r\n\r\nSPAIN ELECTRONIC TOLL COLLECTION MARKET ANALYSIS BY END USE
      78. \r\n\r\nSPAIN ELECTRONIC TOLL COLLECTION MARKET ANALYSIS BY REGIONAL
      79. \r\n\r\nREST OF EUROPE ELECTRONIC TOLL COLLECTION MARKET ANALYSIS BY TECHNOLOGY
      80. \r\n\r\nREST OF EUROPE ELECTRONIC TOLL COLLECTION MARKET ANALYSIS BY COMPONENT
      81. \r\n\r\nREST OF EUROPE ELECTRONIC TOLL COLLECTION MARKET ANALYSIS BY APPLICATION
      82. \r\n\r\nREST OF EUROPE ELECTRONIC TOLL COLLECTION MARKET ANALYSIS BY END USE
      83. \r\n\r\nREST OF EUROPE ELECTRONIC TOLL COLLECTION MARKET ANALYSIS BY REGIONAL
      84. \r\n\r\nAPAC ELECTRONIC TOLL COLLECTION MARKET ANALYSIS
      85. \r\n\r\nCHINA ELECTRONIC TOLL COLLECTION MARKET ANALYSIS BY TECHNOLOGY
      86. \r\n\r\nCHINA ELECTRONIC TOLL COLLECTION MARKET ANALYSIS BY COMPONENT
      87. \r\n\r\nCHINA ELECTRONIC TOLL COLLECTION MARKET ANALYSIS BY APPLICATION
      88. \r\n\r\nCHINA ELECTRONIC TOLL COLLECTION MARKET ANALYSIS BY END USE
      89. \r\n\r\nCHINA ELECTRONIC TOLL COLLECTION MARKET ANALYSIS BY REGIONAL
      90. \r\n\r\nINDIA ELECTRONIC TOLL COLLECTION MARKET ANALYSIS BY TECHNOLOGY
      91. \r\n\r\nINDIA ELECTRONIC TOLL COLLECTION MARKET ANALYSIS BY COMPONENT
      92. \r\n\r\nINDIA ELECTRONIC TOLL COLLECTION MARKET ANALYSIS BY APPLICATION
      93. \r\n\r\nINDIA ELECTRONIC TOLL COLLECTION MARKET ANALYSIS BY END USE
      94. \r\n\r\nINDIA ELECTRONIC TOLL COLLECTION MARKET ANALYSIS BY REGIONAL
      95. \r\n\r\nJAPAN ELECTRONIC TOLL COLLECTION MARKET ANALYSIS BY TECHNOLOGY
      96. \r\n\r\nJAPAN ELECTRONIC TOLL COLLECTION MARKET ANALYSIS BY COMPONENT
      97. \r\n\r\nJAPAN ELECTRONIC TOLL COLLECTION MARKET ANALYSIS BY APPLICATION
      98. \r\n\r\nJAPAN ELECTRONIC TOLL COLLECTION MARKET ANALYSIS BY END USE
      99. \r\n\r\nJAPAN ELECTRONIC TOLL COLLECTION MARKET ANALYSIS BY REGIONAL
      100. \r\n\r\nSOUTH KOREA ELECTRONIC TOLL COLLECTION MARKET ANALYSIS BY TECHNOLOGY
      101. \r\n\r\nSOUTH KOREA ELECTRONIC TOLL COLLECTION MARKET ANALYSIS BY COMPONENT
      102. \r\n\r\nSOUTH KOREA ELECTRONIC TOLL COLLECTION MARKET ANALYSIS BY APPLICATION
      103. \r\n\r\nSOUTH KOREA ELECTRONIC TOLL COLLECTION MARKET ANALYSIS BY END USE
      104. \r\n\r\nSOUTH KOREA ELECTRONIC TOLL COLLECTION MARKET ANALYSIS BY REGIONAL
      105. \r\n\r\nMALAYSIA ELECTRONIC TOLL COLLECTION MARKET ANALYSIS BY TECHNOLOGY
      106. \r\n\r\nMALAYSIA ELECTRONIC TOLL COLLECTION MARKET ANALYSIS BY COMPONENT
      107. \r\n\r\nMALAYSIA ELECTRONIC TOLL COLLECTION MARKET ANALYSIS BY APPLICATION
      108. \r\n\r\nMALAYSIA ELECTRONIC TOLL COLLECTION MARKET ANALYSIS BY END USE
      109. \r\n\r\nMALAYSIA ELECTRONIC TOLL COLLECTION MARKET ANALYSIS BY REGIONAL
      110. \r\n\r\nTHAILAND ELECTRONIC TOLL COLLECTION MARKET ANALYSIS BY TECHNOLOGY
      111. \r\n\r\nTHAILAND ELECTRONIC TOLL COLLECTION MARKET ANALYSIS BY COMPONENT
      112. \r\n\r\nTHAILAND ELECTRONIC TOLL COLLECTION MARKET ANALYSIS BY APPLICATION
      113. \r\n\r\nTHAILAND ELECTRONIC TOLL COLLECTION MARKET ANALYSIS BY END USE
      114. \r\n\r\nTHAILAND ELECTRONIC TOLL COLLECTION MARKET ANALYSIS BY REGIONAL
      115. \r\n\r\nINDONESIA ELECTRONIC TOLL COLLECTION MARKET ANALYSIS BY TECHNOLOGY
      116. \r\n\r\nINDONESIA ELECTRONIC TOLL COLLECTION MARKET ANALYSIS BY COMPONENT
      117. \r\n\r\nINDONESIA ELECTRONIC TOLL COLLECTION MARKET ANALYSIS BY APPLICATION
      118. \r\n\r\nINDONESIA ELECTRONIC TOLL COLLECTION MARKET ANALYSIS BY END USE
      119. \r\n\r\nINDONESIA ELECTRONIC TOLL COLLECTION MARKET ANALYSIS BY REGIONAL
      120. \r\n\r\nREST OF APAC ELECTRONIC TOLL COLLECTION MARKET ANALYSIS BY TECHNOLOGY
      121. \r\n\r\nREST OF APAC ELECTRONIC TOLL COLLECTION MARKET ANALYSIS BY COMPONENT
      122. \r\n\r\nREST OF APAC ELECTRONIC TOLL COLLECTION MARKET ANALYSIS BY APPLICATION
      123. \r\n\r\nREST OF APAC ELECTRONIC TOLL COLLECTION MARKET ANALYSIS BY END USE
      124. \r\n\r\nREST OF APAC ELECTRONIC TOLL COLLECTION MARKET ANALYSIS BY REGIONAL
      125. \r\n\r\nSOUTH AMERICA ELECTRONIC TOLL COLLECTION MARKET ANALYSIS
      126. \r\n\r\nBRAZIL ELECTRONIC TOLL COLLECTION MARKET ANALYSIS BY TECHNOLOGY
      127. \r\n\r\nBRAZIL ELECTRONIC TOLL COLLECTION MARKET ANALYSIS BY COMPONENT
      128. \r\n\r\nBRAZIL ELECTRONIC TOLL COLLECTION MARKET ANALYSIS BY APPLICATION
      129. \r\n\r\nBRAZIL ELECTRONIC TOLL COLLECTION MARKET ANALYSIS BY END USE
      130. \r\n\r\nBRAZIL ELECTRONIC TOLL COLLECTION MARKET ANALYSIS BY REGIONAL
      131. \r\n\r\nMEXICO ELECTRONIC TOLL COLLECTION MARKET ANALYSIS BY TECHNOLOGY
      132. \r\n\r\nMEXICO ELECTRONIC TOLL COLLECTION MARKET ANALYSIS BY COMPONENT
      133. \r\n\r\nMEXICO ELECTRONIC TOLL COLLECTION MARKET ANALYSIS BY APPLICATION
      134. \r\n\r\nMEXICO ELECTRONIC TOLL COLLECTION MARKET ANALYSIS BY END USE
      135. \r\n\r\nMEXICO ELECTRONIC TOLL COLLECTION MARKET ANALYSIS BY REGIONAL
      136. \r\n\r\nARGENTINA ELECTRONIC TOLL COLLECTION MARKET ANALYSIS BY TECHNOLOGY
      137. \r\n\r\nARGENTINA ELECTRONIC TOLL COLLECTION MARKET ANALYSIS BY COMPONENT
      138. \r\n\r\nARGENTINA ELECTRONIC TOLL COLLECTION MARKET ANALYSIS BY APPLICATION
      139. \r\n\r\nARGENTINA ELECTRONIC TOLL COLLECTION MARKET ANALYSIS BY END USE
      140. \r\n\r\nARGENTINA ELECTRONIC TOLL COLLECTION MARKET ANALYSIS BY REGIONAL
      141. \r\n\r\nREST OF SOUTH AMERICA ELECTRONIC TOLL COLLECTION MARKET ANALYSIS BY TECHNOLOGY
      142. \r\n\r\nREST OF SOUTH AMERICA ELECTRONIC TOLL COLLECTION MARKET ANALYSIS BY COMPONENT
      143. \r\n\r\nREST OF SOUTH AMERICA ELECTRONIC TOLL COLLECTION MARKET ANALYSIS BY APPLICATION
      144. \r\n\r\nREST OF SOUTH AMERICA ELECTRONIC TOLL COLLECTION MARKET ANALYSIS BY END USE
      145. \r\n\r\nREST OF SOUTH AMERICA ELECTRONIC TOLL COLLECTION MARKET ANALYSIS BY REGIONAL
      146. \r\n\r\nMEA ELECTRONIC TOLL COLLECTION MARKET ANALYSIS
      147. \r\n\r\nGCC COUNTRIES ELECTRONIC TOLL COLLECTION MARKET ANALYSIS BY TECHNOLOGY
      148. \r\n\r\nGCC COUNTRIES ELECTRONIC TOLL COLLECTION MARKET ANALYSIS BY COMPONENT
      149. \r\n\r\nGCC COUNTRIES ELECTRONIC TOLL COLLECTION MARKET ANALYSIS BY APPLICATION
      150. \r\n\r\nGCC COUNTRIES ELECTRONIC TOLL COLLECTION MARKET ANALYSIS BY END USE
      151. \r\n\r\nGCC COUNTRIES ELECTRONIC TOLL COLLECTION MARKET ANALYSIS BY REGIONAL
      152. \r\n\r\nSOUTH AFRICA ELECTRONIC TOLL COLLECTION MARKET ANALYSIS BY TECHNOLOGY
      153. \r\n\r\nSOUTH AFRICA ELECTRONIC TOLL COLLECTION MARKET ANALYSIS BY COMPONENT
      154. \r\n\r\nSOUTH AFRICA ELECTRONIC TOLL COLLECTION MARKET ANALYSIS BY APPLICATION
      155. \r\n\r\nSOUTH AFRICA ELECTRONIC TOLL COLLECTION MARKET ANALYSIS BY END USE
      156. \r\n\r\nSOUTH AFRICA ELECTRONIC TOLL COLLECTION MARKET ANALYSIS BY REGIONAL
      157. \r\n\r\nREST OF MEA ELECTRONIC TOLL COLLECTION MARKET ANALYSIS BY TECHNOLOGY
      158. \r\n\r\nREST OF MEA ELECTRONIC TOLL COLLECTION MARKET ANALYSIS BY COMPONENT
      159. \r\n\r\nREST OF MEA ELECTRONIC TOLL COLLECTION MARKET ANALYSIS BY APPLICATION
      160. \r\n\r\nREST OF MEA ELECTRONIC TOLL COLLECTION MARKET ANALYSIS BY END USE
      161. \r\n\r\nREST OF MEA ELECTRONIC TOLL COLLECTION MARKET ANALYSIS BY REGIONAL
      162. \r\n\r\nKEY BUYING CRITERIA OF ELECTRONIC TOLL COLLECTION MARKET
      163. \r\n\r\nRESEARCH PROCESS OF MRFR
      164. \r\n\r\nDRO ANALYSIS OF ELECTRONIC TOLL COLLECTION MARKET
      165. \r\n\r\nDRIVERS IMPACT ANALYSIS: ELECTRONIC TOLL COLLECTION MARKET
      166. \r\n\r\nRESTRAINTS IMPACT ANALYSIS: ELECTRONIC TOLL COLLECTION MARKET
      167. \r\n\r\nSUPPLY / VALUE CHAIN: ELECTRONIC TOLL COLLECTION MARKET
    151. \r\n\r\nELECTRONIC TOLL COLLECTION MARKET, BY TECHNOLOGY, 2025 (% SHARE)
    152. \r\n\r\nELECTRONIC TOLL COLLECTION MARKET, BY TECHNOLOGY, 2019 TO 2035 (USD Billions)
    153. \r\n\r\nELECTRONIC TOLL COLLECTION MARKET, BY COMPONENT, 2025 (% SHARE)
    154. \r\n\r\nELECTRONIC TOLL COLLECTION MARKET, BY COMPONENT, 2019 TO 2035 (USD Billions)
    155. \r\n\r\nELECTRONIC TOLL COLLECTION MARKET, BY APPLICATION, 2025 (% SHARE)
    156. \r\n\r\nELECTRONIC TOLL COLLECTION MARKET, BY APPLICATION, 2019 TO 2035 (USD Billions)
    157. \r\n\r\nELECTRONIC TOLL COLLECTION MARKET, BY END USE, 2025 (% SHARE)
    158. \r\n\r\nELECTRONIC TOLL COLLECTION MARKET, BY END USE, 2019 TO 2035 (USD Billions)
    159. \r\n\r\nELECTRONIC TOLL COLLECTION MARKET, BY REGIONAL, 2025 (% SHARE)
    160. \r\n\r\nELECTRONIC TOLL COLLECTION MARKET, BY REGIONAL, 2019 TO 2035 (USD Billions)
      1. \r\n\r\nBENCHMARKING OF MAJOR COMPETITORS
      2. \r\n\r\n
      3. "

    Electronic Toll Collection Market Segmentation

    Electronic Toll Collection Market By Technology (USD Billion, 2019-2035)

    Radio Frequency Identification

    Automatic Number Plate Recognition

    Smartphone Applications

    Contactless Payment Systems

    Electronic Toll Collection Market By Component (USD Billion, 2019-2035)

    On-Board Units

    Back Office Systems

    Roadside Equipment

    Payment Processing Solutions

    Electronic Toll Collection Market By Application (USD Billion, 2019-2035)

    Highway Tolling

    Urban Tolling

    Congestion Pricing

    Electronic Toll Collection Market By End Use (USD Billion, 2019-2035)

    Government

    Private Operators

    Transport Authorities

    Electronic Toll Collection Market By Regional (USD Billion, 2019-2035)

    North America

    Europe

    South America

    Asia Pacific

    Middle East and Africa

    Electronic Toll Collection Market Regional Outlook (USD Billion, 2019-2035)

    North America Outlook (USD Billion, 2019-2035)

    North America Electronic Toll Collection Market by Technology Type

    Radio Frequency Identification

    Automatic Number Plate Recognition

    Smartphone Applications

    Contactless Payment Systems

    North America Electronic Toll Collection Market by Component Type

    On-Board Units

    Back Office Systems

    Roadside Equipment

    Payment Processing Solutions

    North America Electronic Toll Collection Market by Application Type

    Highway Tolling

    Urban Tolling

    Congestion Pricing

    North America Electronic Toll Collection Market by End Use Type

    Government

    Private Operators

    Transport Authorities
    North America Electronic Toll Collection Market by Regional Type

    US

    Canada

    US Outlook (USD Billion, 2019-2035)

    US Electronic Toll Collection Market by Technology Type

    Radio Frequency Identification

    Automatic Number Plate Recognition

    Smartphone Applications

    Contactless Payment Systems

    US Electronic Toll Collection Market by Component Type

    On-Board Units

    Back Office Systems

    Roadside Equipment

    Payment Processing Solutions

    US Electronic Toll Collection Market by Application Type

    Highway Tolling

    Urban Tolling

    Congestion Pricing

    US Electronic Toll Collection Market by End Use Type

    Government

    Private Operators

    Transport Authorities

    CANADA Outlook (USD Billion, 2019-2035)

    CANADA Electronic Toll Collection Market by Technology Type

    Radio Frequency Identification

    Automatic Number Plate Recognition

    Smartphone Applications

    Contactless Payment Systems

    CANADA Electronic Toll Collection Market by Component Type

    On-Board Units

    Back Office Systems

    Roadside Equipment

    Payment Processing Solutions

    CANADA Electronic Toll Collection Market by Application Type

    Highway Tolling

    Urban Tolling

    Congestion Pricing

    CANADA Electronic Toll Collection Market by End Use Type

    Government

    Private Operators

    Transport Authorities
    Europe Outlook (USD Billion, 2019-2035)

    Europe Electronic Toll Collection Market by Technology Type

    Radio Frequency Identification

    Automatic Number Plate Recognition

    Smartphone Applications

    Contactless Payment Systems

    Europe Electronic Toll Collection Market by Component Type

    On-Board Units

    Back Office Systems

    Roadside Equipment

    Payment Processing Solutions

    Europe Electronic Toll Collection Market by Application Type

    Highway Tolling

    Urban Tolling

    Congestion Pricing

    Europe Electronic Toll Collection Market by End Use Type

    Government

    Private Operators

    Transport Authorities

    Europe Electronic Toll Collection Market by Regional Type

    Germany

    UK

    France

    Russia

    Italy

    Spain

    Rest of Europe

    GERMANY Outlook (USD Billion, 2019-2035)

    GERMANY Electronic Toll Collection Market by Technology Type

    Radio Frequency Identification

    Automatic Number Plate Recognition

    Smartphone Applications

    Contactless Payment Systems

    GERMANY Electronic Toll Collection Market by Component Type

    On-Board Units

    Back Office Systems

    Roadside Equipment

    Payment Processing Solutions

    GERMANY Electronic Toll Collection Market by Application Type

    Highway Tolling

    Urban Tolling

    Congestion Pricing

    GERMANY Electronic Toll Collection Market by End Use Type

    Government

    Private Operators

    Transport Authorities

    UK Outlook (USD Billion, 2019-2035)

    UK Electronic Toll Collection Market by Technology Type

    Radio Frequency Identification

    Automatic Number Plate Recognition

    Smartphone Applications

    Contactless Payment Systems

    UK Electronic Toll Collection Market by Component Type

    On-Board Units

    Back Office Systems

    Roadside Equipment

    Payment Processing Solutions

    UK Electronic Toll Collection Market by Application Type

    Highway Tolling

    Urban Tolling

    Congestion Pricing

    UK Electronic Toll Collection Market by End Use Type

    Government

    Private Operators

    Transport Authorities

    FRANCE Outlook (USD Billion, 2019-2035)

    FRANCE Electronic Toll Collection Market by Technology Type

    Radio Frequency Identification

    Automatic Number Plate Recognition

    Smartphone Applications

    Contactless Payment Systems

    FRANCE Electronic Toll Collection Market by Component Type

    On-Board Units

    Back Office Systems

    Roadside Equipment

    Payment Processing Solutions

    FRANCE Electronic Toll Collection Market by Application Type

    Highway Tolling

    Urban Tolling

    Congestion Pricing

    FRANCE Electronic Toll Collection Market by End Use Type

    Government

    Private Operators

    Transport Authorities

    RUSSIA Outlook (USD Billion, 2019-2035)

    RUSSIA Electronic Toll Collection Market by Technology Type

    Radio Frequency Identification

    Automatic Number Plate Recognition

    Smartphone Applications

    Contactless Payment Systems

    RUSSIA Electronic Toll Collection Market by Component Type

    On-Board Units

    Back Office Systems

    Roadside Equipment

    Payment Processing Solutions

    RUSSIA Electronic Toll Collection Market by Application Type

    Highway Tolling

    Urban Tolling

    Congestion Pricing

    RUSSIA Electronic Toll Collection Market by End Use Type

    Government

    Private Operators

    Transport Authorities

    ITALY Outlook (USD Billion, 2019-2035)

    ITALY Electronic Toll Collection Market by Technology Type

    Radio Frequency Identification

    Automatic Number Plate Recognition

    Smartphone Applications

    Contactless Payment Systems

    ITALY Electronic Toll Collection Market by Component Type

    On-Board Units

    Back Office Systems

    Roadside Equipment

    Payment Processing Solutions

    ITALY Electronic Toll Collection Market by Application Type

    Highway Tolling

    Urban Tolling

    Congestion Pricing

    ITALY Electronic Toll Collection Market by End Use Type

    Government

    Private Operators

    Transport Authorities

    SPAIN Outlook (USD Billion, 2019-2035)

    SPAIN Electronic Toll Collection Market by Technology Type

    Radio Frequency Identification

    Automatic Number Plate Recognition

    Smartphone Applications

    Contactless Payment Systems

    SPAIN Electronic Toll Collection Market by Component Type

    On-Board Units

    Back Office Systems

    Roadside Equipment

    Payment Processing Solutions

    SPAIN Electronic Toll Collection Market by Application Type

    Highway Tolling

    Urban Tolling

    Congestion Pricing

    SPAIN Electronic Toll Collection Market by End Use Type

    Government

    Private Operators

    Transport Authorities

    REST OF EUROPE Outlook (USD Billion, 2019-2035)

    REST OF EUROPE Electronic Toll Collection Market by Technology Type

    Radio Frequency Identification

    Automatic Number Plate Recognition

    Smartphone Applications

    Contactless Payment Systems

    REST OF EUROPE Electronic Toll Collection Market by Component Type

    On-Board Units

    Back Office Systems

    Roadside Equipment

    Payment Processing Solutions

    REST OF EUROPE Electronic Toll Collection Market by Application Type

    Highway Tolling

    Urban Tolling

    Congestion Pricing

    REST OF EUROPE Electronic Toll Collection Market by End Use Type

    Government

    Private Operators

    Transport Authorities

    APAC Outlook (USD Billion, 2019-2035)

    APAC Electronic Toll Collection Market by Technology Type

    Radio Frequency Identification

    Automatic Number Plate Recognition

    Smartphone Applications

    Contactless Payment Systems

    APAC Electronic Toll Collection Market by Component Type

    On-Board Units

    Back Office Systems

    Roadside Equipment

    Payment Processing Solutions

    APAC Electronic Toll Collection Market by Application Type

    Highway Tolling

    Urban Tolling

    Congestion Pricing

    APAC Electronic Toll Collection Market by End Use Type

    Government

    Private Operators

    Transport Authorities

    APAC Electronic Toll Collection Market by Regional Type

    China

    India

    Japan

    South Korea

    Malaysia

    Thailand

    Indonesia

    Rest of APAC

    CHINA Outlook (USD Billion, 2019-2035)

    CHINA Electronic Toll Collection Market by Technology Type

    Radio Frequency Identification

    Automatic Number Plate Recognition

    Smartphone Applications

    Contactless Payment Systems

    CHINA Electronic Toll Collection Market by Component Type

    On-Board Units

    Back Office Systems

    Roadside Equipment

    Payment Processing Solutions

    CHINA Electronic Toll Collection Market by Application Type

    Highway Tolling

    Urban Tolling

    Congestion Pricing

    CHINA Electronic Toll Collection Market by End Use Type

    Government

    Private Operators

    Transport Authorities

    INDIA Outlook (USD Billion, 2019-2035)

    INDIA Electronic Toll Collection Market by Technology Type

    Radio Frequency Identification

    Automatic Number Plate Recognition

    Smartphone Applications

    Contactless Payment Systems

    INDIA Electronic Toll Collection Market by Component Type

    On-Board Units

    Back Office Systems

    Roadside Equipment

    Payment Processing Solutions

    INDIA Electronic Toll Collection Market by Application Type

    Highway Tolling

    Urban Tolling

    Congestion Pricing

    INDIA Electronic Toll Collection Market by End Use Type

    Government

    Private Operators

    Transport Authorities

    JAPAN Outlook (USD Billion, 2019-2035)

    JAPAN Electronic Toll Collection Market by Technology Type

    Radio Frequency Identification

    Automatic Number Plate Recognition

    Smartphone Applications

    Contactless Payment Systems

    JAPAN Electronic Toll Collection Market by Component Type

    On-Board Units

    Back Office Systems

    Roadside Equipment

    Payment Processing Solutions

    JAPAN Electronic Toll Collection Market by Application Type

    Highway Tolling

    Urban Tolling

    Congestion Pricing

    JAPAN Electronic Toll Collection Market by End Use Type

    Government

    Private Operators

    Transport Authorities

    SOUTH KOREA Outlook (USD Billion, 2019-2035)

    SOUTH KOREA Electronic Toll Collection Market by Technology Type

    Radio Frequency Identification

    Automatic Number Plate Recognition

    Smartphone Applications

    Contactless Payment Systems

    SOUTH KOREA Electronic Toll Collection Market by Component Type

    On-Board Units

    Back Office Systems

    Roadside Equipment

    Payment Processing Solutions

    SOUTH KOREA Electronic Toll Collection Market by Application Type

    Highway Tolling

    Urban Tolling

    Congestion Pricing

    SOUTH KOREA Electronic Toll Collection Market by End Use Type

    Government

    Private Operators

    Transport Authorities

    MALAYSIA Outlook (USD Billion, 2019-2035)

    MALAYSIA Electronic Toll Collection Market by Technology Type

    Radio Frequency Identification

    Automatic Number Plate Recognition

    Smartphone Applications

    Contactless Payment Systems

    MALAYSIA Electronic Toll Collection Market by Component Type

    On-Board Units

    Back Office Systems

    Roadside Equipment

    Payment Processing Solutions

    MALAYSIA Electronic Toll Collection Market by Application Type

    Highway Tolling

    Urban Tolling

    Congestion Pricing

    MALAYSIA Electronic Toll Collection Market by End Use Type

    Government

    Private Operators

    Transport Authorities

    THAILAND Outlook (USD Billion, 2019-2035)

    THAILAND Electronic Toll Collection Market by Technology Type

    Radio Frequency Identification

    Automatic Number Plate Recognition

    Smartphone Applications

    Contactless Payment Systems

    THAILAND Electronic Toll Collection Market by Component Type

    On-Board Units

    Back Office Systems

    Roadside Equipment

    Payment Processing Solutions

    THAILAND Electronic Toll Collection Market by Application Type

    Highway Tolling

    Urban Tolling

    Congestion Pricing

    THAILAND Electronic Toll Collection Market by End Use Type

    Government

    Private Operators

    Transport Authorities

    INDONESIA Outlook (USD Billion, 2019-2035)

    INDONESIA Electronic Toll Collection Market by Technology Type

    Radio Frequency Identification

    Automatic Number Plate Recognition

    Smartphone Applications

    Contactless Payment Systems

    INDONESIA Electronic Toll Collection Market by Component Type

    On-Board Units

    Back Office Systems

    Roadside Equipment

    Payment Processing Solutions

    INDONESIA Electronic Toll Collection Market by Application Type

    Highway Tolling

    Urban Tolling

    Congestion Pricing

    INDONESIA Electronic Toll Collection Market by End Use Type

    Government

    Private Operators

    Transport Authorities

    REST OF APAC Outlook (USD Billion, 2019-2035)

    REST OF APAC Electronic Toll Collection Market by Technology Type

    Radio Frequency Identification

    Automatic Number Plate Recognition

    Smartphone Applications

    Contactless Payment Systems

    REST OF APAC Electronic Toll Collection Market by Component Type

    On-Board Units

    Back Office Systems

    Roadside Equipment

    Payment Processing Solutions

    REST OF APAC Electronic Toll Collection Market by Application Type

    Highway Tolling

    Urban Tolling

    Congestion Pricing

    REST OF APAC Electronic Toll Collection Market by End Use Type

    Government

    Private Operators

    Transport Authorities

    South America Outlook (USD Billion, 2019-2035)

    South America Electronic Toll Collection Market by Technology Type

    Radio Frequency Identification

    Automatic Number Plate Recognition

    Smartphone Applications

    Contactless Payment Systems

    South America Electronic Toll Collection Market by Component Type

    On-Board Units

    Back Office Systems

    Roadside Equipment

    Payment Processing Solutions

    South America Electronic Toll Collection Market by Application Type

    Highway Tolling

    Urban Tolling

    Congestion Pricing

    South America Electronic Toll Collection Market by End Use Type

    Government

    Private Operators

    Transport Authorities

    South America Electronic Toll Collection Market by Regional Type

    Brazil

    Mexico

    Argentina

    Rest of South America

    BRAZIL Outlook (USD Billion, 2019-2035)

    BRAZIL Electronic Toll Collection Market by Technology Type

    Radio Frequency Identification

    Automatic Number Plate Recognition

    Smartphone Applications

    Contactless Payment Systems

    BRAZIL Electronic Toll Collection Market by Component Type

    On-Board Units

    Back Office Systems

    Roadside Equipment

    Payment Processing Solutions

    BRAZIL Electronic Toll Collection Market by Application Type

    Highway Tolling

    Urban Tolling

    Congestion Pricing

    BRAZIL Electronic Toll Collection Market by End Use Type

    Government

    Private Operators

    Transport Authorities

    MEXICO Outlook (USD Billion, 2019-2035)

    MEXICO Electronic Toll Collection Market by Technology Type

    Radio Frequency Identification

    Automatic Number Plate Recognition

    Smartphone Applications

    Contactless Payment Systems

    MEXICO Electronic Toll Collection Market by Component Type

    On-Board Units

    Back Office Systems

    Roadside Equipment

    Payment Processing Solutions

    MEXICO Electronic Toll Collection Market by Application Type

    Highway Tolling

    Urban Tolling

    Congestion Pricing

    MEXICO Electronic Toll Collection Market by End Use Type

    Government

    Private Operators

    Transport Authorities

    ARGENTINA Outlook (USD Billion, 2019-2035)

    ARGENTINA Electronic Toll Collection Market by Technology Type

    Radio Frequency Identification

    Automatic Number Plate Recognition

    Smartphone Applications

    Contactless Payment Systems

    ARGENTINA Electronic Toll Collection Market by Component Type

    On-Board Units

    Back Office Systems

    Roadside Equipment

    Payment Processing Solutions

    ARGENTINA Electronic Toll Collection Market by Application Type

    Highway Tolling

    Urban Tolling

    Congestion Pricing

    ARGENTINA Electronic Toll Collection Market by End Use Type

    Government

    Private Operators

    Transport Authorities

    REST OF SOUTH AMERICA Outlook (USD Billion, 2019-2035)

    REST OF SOUTH AMERICA Electronic Toll Collection Market by Technology Type

    Radio Frequency Identification

    Automatic Number Plate Recognition

    Smartphone Applications

    Contactless Payment Systems

    REST OF SOUTH AMERICA Electronic Toll Collection Market by Component Type

    On-Board Units

    Back Office Systems

    Roadside Equipment

    Payment Processing Solutions

    REST OF SOUTH AMERICA Electronic Toll Collection Market by Application Type

    Highway Tolling

    Urban Tolling

    Congestion Pricing

    REST OF SOUTH AMERICA Electronic Toll Collection Market by End Use Type

    Government

    Private Operators

    Transport Authorities

    MEA Outlook (USD Billion, 2019-2035)

    MEA Electronic Toll Collection Market by Technology Type

    Radio Frequency Identification

    Automatic Number Plate Recognition

    Smartphone Applications

    Contactless Payment Systems

    MEA Electronic Toll Collection Market by Component Type

    On-Board Units

    Back Office Systems

    Roadside Equipment

    Payment Processing Solutions

    MEA Electronic Toll Collection Market by Application Type

    Highway Tolling

    Urban Tolling

    Congestion Pricing

    MEA Electronic Toll Collection Market by End Use Type

    Government

    Private Operators

    Transport Authorities

    MEA Electronic Toll Collection Market by Regional Type

    GCC Countries

    South Africa

    Rest of MEA

    GCC COUNTRIES Outlook (USD Billion, 2019-2035)

    GCC COUNTRIES Electronic Toll Collection Market by Technology Type

    Radio Frequency Identification

    Automatic Number Plate Recognition

    Smartphone Applications

    Contactless Payment Systems

    GCC COUNTRIES Electronic Toll Collection Market by Component Type

    On-Board Units

    Back Office Systems

    Roadside Equipment

    Payment Processing Solutions

    GCC COUNTRIES Electronic Toll Collection Market by Application Type

    Highway Tolling

    Urban Tolling

    Congestion Pricing

    GCC COUNTRIES Electronic Toll Collection Market by End Use Type

    Government

    Private Operators

    Transport Authorities

    SOUTH AFRICA Outlook (USD Billion, 2019-2035)

    SOUTH AFRICA Electronic Toll Collection Market by Technology Type

    Radio Frequency Identification

    Automatic Number Plate Recognition

    Smartphone Applications

    Contactless Payment Systems

    SOUTH AFRICA Electronic Toll Collection Market by Component Type

    On-Board Units

    Back Office Systems

    Roadside Equipment

    Payment Processing Solutions

    SOUTH AFRICA Electronic Toll Collection Market by Application Type

    Highway Tolling

    Urban Tolling

    Congestion Pricing

    SOUTH AFRICA Electronic Toll Collection Market by End Use Type

    Government

    Private Operators

    Transport Authorities

    REST OF MEA Outlook (USD Billion, 2019-2035)

    REST OF MEA Electronic Toll Collection Market by Technology Type

    Radio Frequency Identification

    Automatic Number Plate Recognition

    Smartphone Applications

    Contactless Payment Systems

    REST OF MEA Electronic Toll Collection Market by Component Type

    On-Board Units

    Back Office Systems

    Roadside Equipment

    Payment Processing Solutions

    REST OF MEA Electronic Toll Collection Market by Application Type

    Highway Tolling

    Urban Tolling

    Congestion Pricing

    REST OF MEA Electronic Toll Collection Market by End Use Type

    Government

    Private Operators

    Transport Authorities

    Infographic

    Free Sample Request

    Kindly complete the form below to receive a free sample of this Report

    Get Free Sample

    Customer Strories

    “I am very pleased with how market segments have been defined in a relevant way for my purposes (such as "Portable Freezers & refrigerators" and "last-mile"). In general the report is well structured. Thanks very much for your efforts.”

    Victoria Milne

    Founder
    Case Study
    Chemicals and Materials

    Compare Licence

    ×
    Features License Type
    Single User Multiuser License Enterprise User
    Price $4,950 $5,950 $7,250
    Maximum User Access Limit 1 User Upto 10 Users Unrestricted Access Throughout the Organization
    Free Customization
    Direct Access to Analyst
    Deliverable Format
    Platform Access
    Discount on Next Purchase 10% 15% 15%
    Printable Versions