ID: MRFR/HC/6598-HCR | February 2021 | Region: Global | 90 pages
Market Scenario
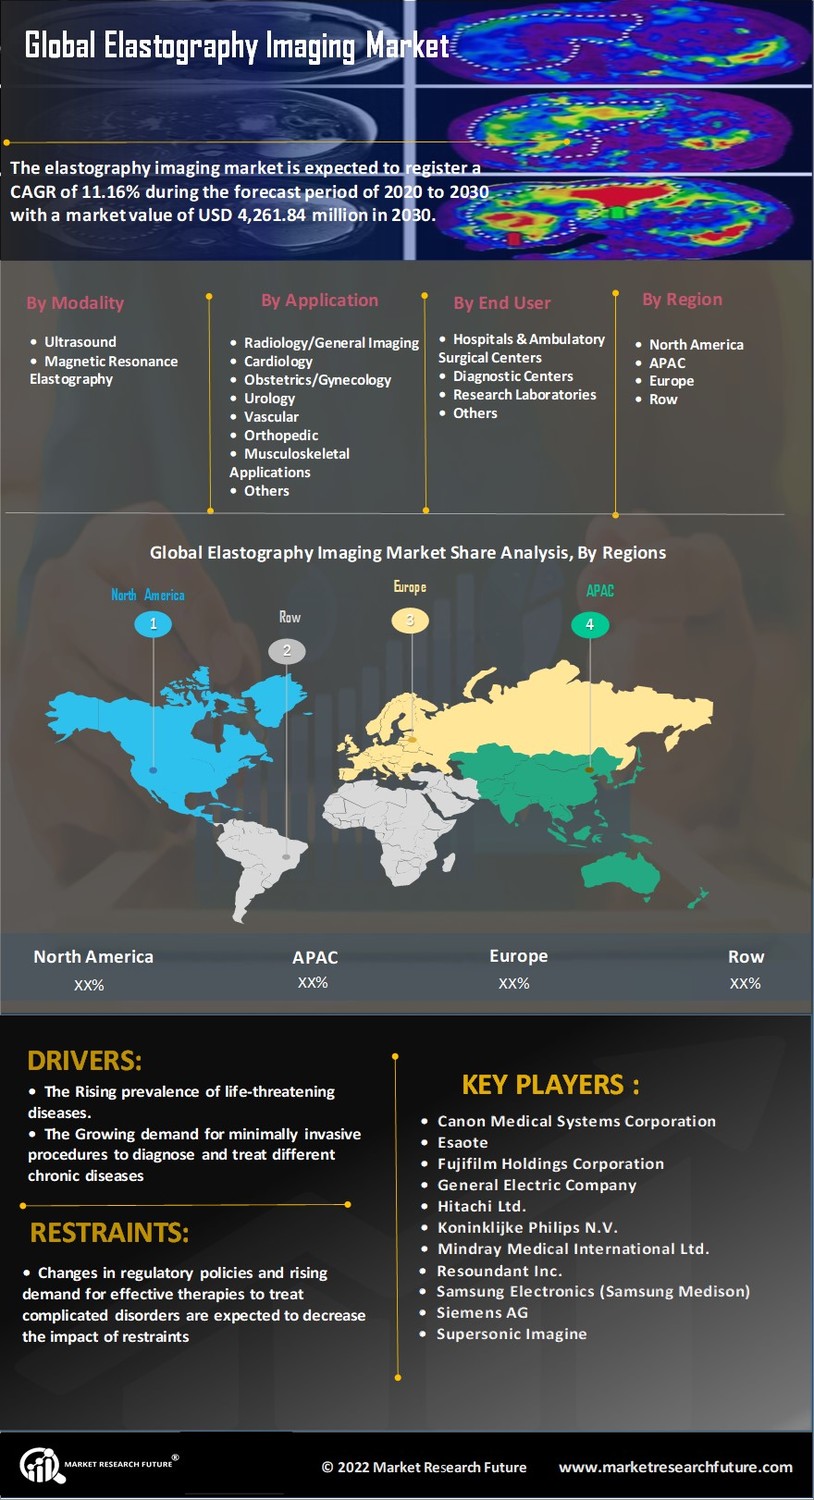
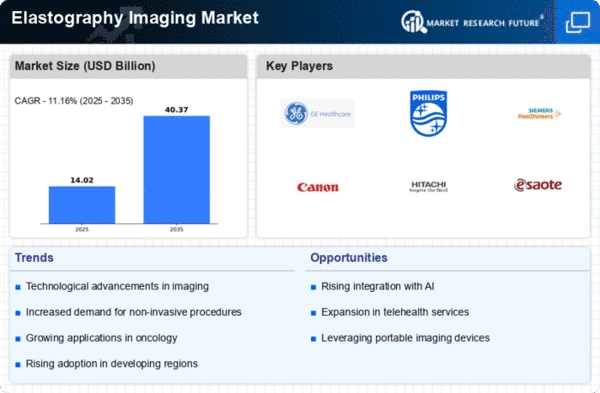
The global elastography imaging market is expected to register a CAGR of 11.1% during the forecast period of 2019 to 2025 with a market value of USD 2,538.2 million in 2018.
Elastography is a medical imaging method that plots the elastic properties of soft tissue to stipulate the diagnostic data during surgery. The global elastography imaging market is driven by factors such as the rising prevalence of life-threatening diseases and the growing demand for minimally invasive procedures to diagnose and treat different chronic diseases. Additionally, this technique needs less dependence on operator skill, thus reducing the impact of unskilled medical professionals to an extent in the emerging economies. On the other hand, the high cost of the apparatus is projected to hamper the growth of the market during the assessment period. Changes in regulatory policies and rising demand for effective therapies to treat complicated disorders are expected to decrease the impact of restraints during the forecast period.
Moreover, major companies in the market are involved in strategic acquisitions and collaborations to sustain their position in the market. For instance, in November 2018, Canon Medical Systems Corporation introduced Contrast Vector Imaging (CVI) to provide additional information on liver hemodynamics and expand the use of contrast-enhanced ultrasound on its premium ultrasound system. Also, in February 2019, Esaote launched the MyLabX8, an ultrasound platform to support hospitals and clinics.
Segmentation
The global elastography imaging market has been segmented based on modality, application, and end user.
The market, based on modality, has been bifurcated into ultrasound, and magnetic resonance elastography. The ultrasound market is expected to hold a major share in the market, owing to the high advantages of this type of modality. The magnetic resonance elastography segment is anticipated to be the fastest growing due to the wider availability and rising adoption rate.
The market, by application, has been divided into radiology/general imaging, cardiology, obstetrics/gynecology, urology, vascular, orthopedic & musculoskeletal applications, and others. The radiology/general imaging segment is expected to hold a major share owing to the increasing occurrences of chronic diseases throughout the globe. The cardiology segment is expected to be the fastest growing one due to the increased patient population in recent years.
The market, by end user, has been classified as hospitals & ambulatory surgical centers, diagnostic centers, research laboratories, and others. The hospitals & ambulatory surgical centers segment is anticipated to hold a major share in the market. This is due to the increasing number of hospitals as well as the increased number of hospitalizations. The diagnostic centers segment is expected to boom and becomes the fastest growing market due to the increased patient preference and inclination towards the diagnostic centers.
The market has been divided, by region, into the Americas, Europe, Asia-Pacific, and the Middle East & Africa. The elastography imaging market in the Americas has further been branched into North America and Latin America, with the North American market divided into the US and Canada. The European elastography imaging market has been sub-divided Western Europe and Eastern Europe. Western Europe has further been classified as Germany, France, UK, Italy, Spain, and the rest of Western Europe. The elastography imaging market in Asia-Pacific has been segmented into Japan, China, India, South Korea, Australia, and the rest of Asia-Pacific. The elastography imaging market in the Middle East & Africa has been divided into the Middle East and Africa.
Key Players
Regional Market Summary
Global Elastography Imaging Market Share (%), by Region, 2018
Source: World Health Organization (WHO), Institute of Medicine (IOM)
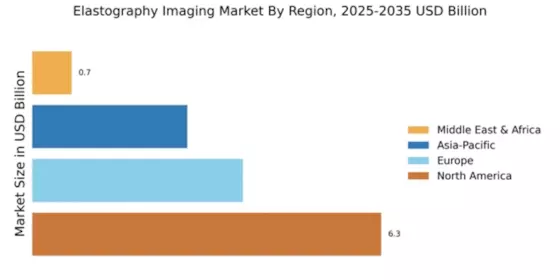
The market in the Americas is expected to dominate the global elastography imaging market due to the increasing per capita healthcare expenditure and the high adoption of new technology in the region. Furthermore, increasing expenses in research by healthcare bodies is expected to fuel the growth of the market in this region. Additionally, the increase in the insurance coverage and improving reimbursement scenario in the US and Canada are also projected to drive the growth of the market.
The market in Europe showed a substantial amount of growth. The market growth in this region can be attributed to the presence of a well-established healthcare system, an increase in chronic diseases, and the involvement of key companies. For instance, in May 2017, Esaote appointed a new distributor for its ultrasound and MRI products throughout Ireland. Therefore, the market is expected to grow during the forecast period.
The market in Asia-Pacific is projected to have a steady growth rate during the forecast period owing to the increasing number of patients with chronic diseases and government initiatives for healthcare reforms. However, a decrease in capital investment is restricting the market growth of this region.
The market in the Middle East & Africa is anticipated to account for the least share of the global market due to low disposable income in the region. Moreover, the limited access to treatment facilities is projected to curb the growth of the market in the future.
Global Elastography Imaging Market, by Modality
Global Elastography Imaging Market, by Application
Global Elastography Imaging Market, by End User
Global Elastography Imaging Market, by Region
Intended Audience
Report Attribute/Metric | Details |
---|---|
Market Size | USD 2,538.2 Million (2025) |
CAGR | 11.1% (2019-2025) |
Base Year | 2019 |
Forecast Period | 2027 |
Historical Data | 2018 |
Forecast Units | Value (USD Million) |
Report Coverage | Revenue Forecast, Competitive Landscape, Growth Factors, and Trends |
Segments Covered | Modality, Application, End User |
Geographies Covered | North America, Europe, Asia-Pacific, and Rest of the World (RoW) |
Key Vendors | Canon Medical Systems Corporation, Siemens AG, Fujifilm Holdings Corporation, Esaote, Resoundant Inc., Hitachi Ltd., Mindray Medical International Ltd., Koninklijke Philips N.V., Samsung Electronics (Samsung Medison), Supersonic Imagine, and General Electric Company. |
Key Market Opportunities | New product launches and R&D Amongst major key Players |
Key Market Drivers |
|
Frequently Asked Questions (FAQ) :
The elastography imaging market is predicted to grow with 11.1% CAGr during the forecast period of 2019 to 2025.
In 2018, the elastography imaging market valuation was USD 2538.2 million.
The ultrasound segment would lead to the elastography imaging market.
The radiology/ general imaging segment would lead to the elastography imaging market.
The hospitals and ambulatory surgical centers segment would be in charge of the elastography imaging market.
Table of Contents
Chapter 1. Report Prologue
Chapter 2. Market Introduction
2.1 Definition
2.2 Scope of the Study
2.2.1 Research Objective
2.2.2 Assumptions
2.2.3 Limitations
Chapter 3. Research Methodology
3.1 Introduction
3.2 Primary Research
3.3 Secondary Research
3.4 Market Size Estimation
Chapter 4. Market Dynamics
4.1 Drivers
4.2 Restraints
4.3 Opportunities
4.4 Challenges
Chapter 5. Market Factor Analysis
5.1 Porter’s Five Forces Analysis
5.1.1 Bargaining Power of Suppliers
5.1.2 Bargaining Power of Buyers
5.1.3 Threat of New Entrants
5.1.4 Threat of Substitutes
5.1.5 Intensity of Rivalry
5.2 Value Chain Analysis
Chapter 6. Global Elastography Imaging Market, by Modality
6.1 Overview
6.2 Ultrasound
Market Estimates & Forecast, by Region, 2020-2027
Market Estimates & Forecast, by Country, 2020-2027
6.3 Magnetic Resonance Elastography
Market Estimates & Forecast, by Region, 2020-2027
Market Estimates & Forecast, by Country, 2020-2027
Chapter 7. Global Elastography Imaging Market, by Application
7.1 Overview
7.2 Radiology/General Imaging
Market Estimates & Forecast, by Region, 2020-2027
Market Estimates & Forecast, by Country, 2020-2027
7.3 Cardiology
Market Estimates & Forecast, by Region, 2020-2027
Market Estimates & Forecast, by Country, 2020-2027
7.4 Obstetrics/Gynecology
Market Estimates & Forecast, by Region, 2020-2027
Market Estimates & Forecast, by Country, 2020-2027
7.5 Urology
Market Estimates & Forecast, by Region, 2020-2027
Market Estimates & Forecast, by Country, 2020-2027
7.6 Vascular
Market Estimates & Forecast, by Region, 2020-2027
Market Estimates & Forecast, by Country, 2020-2027
7.7 Orthopedic & Musculoskeletal Applications
Market Estimates & Forecast, by Region, 2020-2027
Market Estimates & Forecast, by Country, 2020-2027
7.8 Others
Chapter 8. Global Elastography Imaging Market, by End User
8.1 Overview
8.2 Hospitals & Ambulatory Surgical Centers
Market Estimates & Forecast, by Region, 2020-2027
Market Estimates & Forecast, by Country, 2020-2027
8.3 Diagnostic Centers
Market Estimates & Forecast, by Region, 2020-2027
Market Estimates & Forecast, by Country, 2020-2027
8.4 Research Laboratories
Market Estimates & Forecast, by Region, 2020-2027
Market Estimates & Forecast, by Country, 2020-2027
8.5 Others
Chapter 9. Global Elastography Imaging Market, by Region
9.1 Overview
9.2 Americas
9.2.1 North America
9.2.1.1 US
9.2.1.2 Canada
9.2.2 Latin America
9.3 Europe
9.3.1 Western Europe
9.3.1.1 Germany
9.3.1.2 France
9.3.1.3 Italy
9.3.1.4 Spain
9.3.1.5 UK
9.3.1.6 Rest of Western Europe
9.3.2 Eastern Europe
9.4 Asia-Pacific
9.4.1 Japan
9.4.2 China
9.4.3 India
9.4.4 Australia
9.4.5 South Korea
9.4.6 Rest of Asia-Pacific
9.5 Middle East & Africa
9.5.1 Middle East
9.5.2 Africa
Chapter 10. Company Landscape
10.1 Overview
10.2 Company Share Analysis
Chapter 11. Company Profiles
11.1 Canon Medical Systems Corporation
11.1.1 Company Overview
11.1.2 Product Type Overview
11.1.3 Financials Overview
11.1.4 Key Developments
11.1.5 SWOT Analysis
11.2 Esaote
11.2.1 Company Overview
11.2.2 Product Type Overview
11.2.3 Financial Overview
11.2.4 Key Developments
11.2.5 SWOT Analysis
11.3 Fujifilm Holdings Corporation
11.3.1 Company Overview
11.3.2 Product Type Overview
11.3.3 Financial Overview
11.3.4 Key Development
11.3.5 SWOT Analysis
11.4 General Electric Company
11.4.1 Company Overview
11.4.2 Product Type Overview
11.4.3 Financial Overview
11.4.4 Key Development
11.4.5 SWOT Analysis
11.5 Hitachi Ltd.
11.5.1 Company Overview
11.5.2 Product Type Overview
11.5.3 Financial overview
11.5.4 Key Developments
11.5.5 SWOT Analysis
11.6 Koninklijke Philips N.V.
11.6.1 Company Overview
11.6.2 Product Type Overview
11.6.3 Financial Overview
11.6.4 Key Developments
11.6.5 SWOT Analysis
11.7 Mindray Medical International Ltd.
11.7.1 Overview
11.7.2 Product Type Overview
11.7.3 Financial Overview
11.7.4 Key Developments
11.7.5 SWOT Analysis
11.8 Resoundant Inc.
11.8.1 Overview
11.8.2 Product Type Overview
11.8.3 Financials
11.8.4 Key Developments
11.8.5 SWOT Analysis
11.9 Samsung Electronics (Samsung Medison)
11.9.1 Overview
11.9.2 Product Type Overview
11.9.3 Financials
11.9.4 Key Developments
11.9.5 SWOT Analysis
11.10 Siemens AG
11.10.1 Overview
11.10.2 Product Type Overview
11.10.3 Financials
11.10.4 Key Developments
11.10.5 SWOT Analysis
11.11 Supersonic Imagine
11.11.1 Overview
11.11.2 Product Type Overview
11.11.3 Financials
11.11.4 Key Developments
11.11.5 SWOT Analysis
11.12 Others
Chapter 12 MRFR Conclusion
12.1 Key Findings
12.1.1 From CEO’s Viewpoint
12.1.2 Unmet Needs of the Market
12.2 Key Companies to Watch
12.3 Predictions for the Elastography Imaging Market
Chapter 13. Appendix
LIST OF TABLES
Table 1 Global Elastography Imaging Market Synopsis, 2020-2027
Table 2 Global Elastography Imaging Market Estimates and Forecast, 2020-2027 (USD Million)
Table 3 Global Elastography Imaging Market, by Modality, 2020-2027 (USD Million)
Table 4 Global Elastography Imaging Market, by Application, 2020-2027 (USD Million)
Table 5 Global Elastography Imaging Market, by End User, 2020-2027 (USD Million)
Table 6 Global Elastography Imaging Market, by Region, 2020-2027 (USD Million)
Table 7 North America: Elastography Imaging Market, by Modality, 2020-2027 (USD Million)
Table 8 North America: Elastography Imaging Market, by Application, 2020-2027 (USD Million)
Table 9 North America: Elastography Imaging Market, by End User, 2020-2027 (USD Million)
Table 10 US: Elastography Imaging Market, by Modality, 2020-2027 (USD Million)
Table 11 US: Elastography Imaging Market, by Application, 2020-2027 (USD Million)
Table 12 US: Elastography Imaging Market, by End User, 2020-2027 (USD Million)
Table 13 Canada: Elastography Imaging Market, by Modality, 2020-2027 (USD Million)
Table 14 Canada: Elastography Imaging Market, by Application, 2020-2027 (USD Million)
Table 15 Canada: Elastography Imaging Market, by End User, 2020-2027 (USD Million)
Table 16 Latin America: Elastography Imaging Market, by Modality, 2020-2027 (USD Million)
Table 17 Latin America: Elastography Imaging Market, by Application, 2020-2027 (USD Million)
Table 18 Latin America: Elastography Imaging Market, by End User, 2020-2027 (USD Million)
Table 19 Europe: Elastography Imaging Market, by Modality, 2020-2027 (USD Million)
Table 20 Europe: Elastography Imaging Market, by Application, 2020-2027 (USD Million)
Table 21 Europe: Elastography Imaging Market, by End User, 2020-2027 (USD Million)
Table 22 Western Europe: Elastography Imaging Market, by Modality, 2020-2027 (USD Million)
Table 23 Western Europe: Elastography Imaging Market, by Application, 2020-2027 (USD Million)
Table 24 Western Europe: Elastography Imaging Market, by End User, 2020-2027 (USD Million)
Table 25 Eastern Europe: Elastography Imaging Market, by Modality, 2020-2027 (USD Million)
Table 26 Eastern Europe: Elastography Imaging Market, by Application, 2020-2027 (USD Million)
Table 27 Eastern Europe: Elastography Imaging Market, by End User, 2020-2027 (USD Million)
Table 28 Asia-Pacific: Elastography Imaging Market, by Modality, 2020-2027 (USD Million)
Table 29 Asia-Pacific: Elastography Imaging Market, by Application, 2020-2027 (USD Million)
Table 30 Asia-Pacific: Elastography Imaging Market, by End User, 2020-2027 (USD Million)
Table 31 Middle East & Africa: Elastography Imaging Market, by Modality, 2020-2027 (USD Million)
Table 32 Middle East & Africa: Elastography Imaging Market, by Application, 2020-2027 (USD Million)
Table 33 Middle East & Africa: Elastography Imaging Market, by End User, 2020-2027 (USD Million)
LIST OF FIGURES
Figure 1 Research Process
Figure 2 Market Structure for Global Elastography Imaging Market
Figure 3 Market Dynamics for Global Elastography Imaging Market
Figure 4 Global Elastography Imaging Market Share, by Modality, 2020 (%)
Figure 5 Global Elastography Imaging Market Share, by Application, 2020 (%)
Figure 6 Global Elastography Imaging Market Share, by End User, 2020 (%)
Figure 7 Global Elastography Imaging Market Share, by Region, 2020 (%)
Figure 8 North America: Elastography Imaging Market Share, by Country, 2020 (%)
Figure 9 Europe: Elastography Imaging Market Share, by Region, 2020 (%)
Figure 10 Western Europe: Elastography Imaging Market Share, by Country, 2020 (%)
Figure 11 Asia-Pacific: Elastography Imaging Market Share, by Country, 2020 (%)
Figure 12 Middle East & Africa: Elastography Imaging Market Share, by Country, 2020 (%)
Figure 13 Global Elastography Imaging Market: Company Share Analysis, 2020 (%)
Figure 14 Canon Medical Systems Corporation: Key Financials
Figure 15 Canon Medical Systems Corporation: Segmental Revenue
Figure 16 Canon Medical Systems Corporation: Geographical Revenue
Figure 17 Fujifilm Holdings Corporation: Key Financials
Figure 18 Fujifilm Holdings Corporation: Segmental Revenue
Figure 19 Fujifilm Holdings Corporation: Geographical Revenue
Figure 20 General Electric Company: Key Financials
Figure 21 General Electric Company: Segmental Revenue
Figure 22 General Electric Company: Geographical Revenue
Figure 23 Hitachi Ltd.: Key Financials
Figure 24 Hitachi Ltd.: Segmental Revenue
Figure 25 Hitachi Ltd.: Geographical Revenue
Figure 26 Koninklijke Philips N.V.: Key Financials
Figure 27 Koninklijke Philips N.V.: Segmental Revenue
Figure 28 Koninklijke Philips N.V.: Geographical Revenue
Figure 29 Siemens AG: Key Financials
Figure 30 Siemens AG: Segmental Revenue
Figure 31 Siemens AG: Geographical Revenue
This table of content is tentative and subject to change as the research progresses.
Please Note: Financial details of company cannot be provided if the information of the company is not available in public domain and or reliable source.