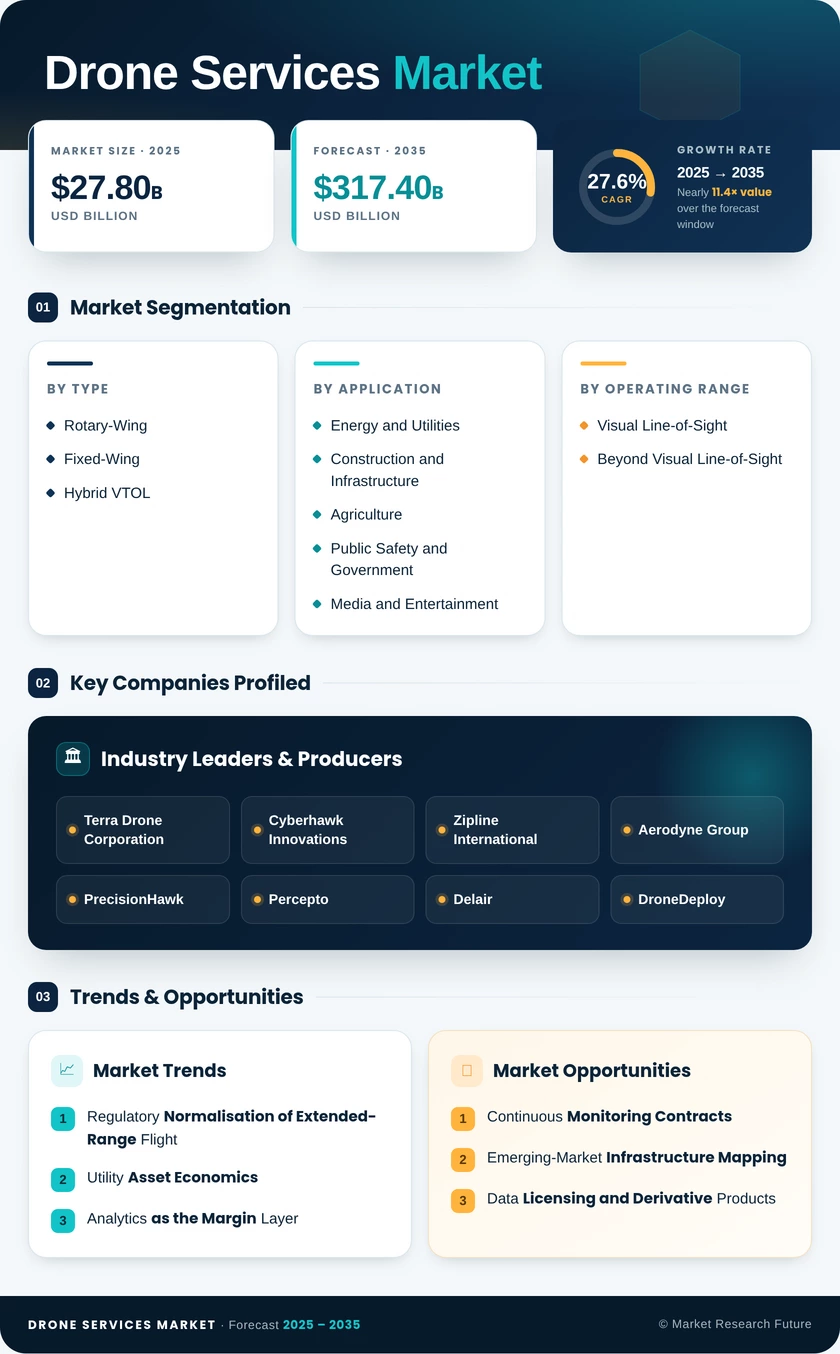
Drone Services Market (2026 - 2035)

ID: MRFR/AD/8044-HCR
168 Pages
Abbas Raut
Last Updated: August 25, 2026
Drone Services Market Size, Share, Industry Trend & Analysis Research Report Information By Service Type (Piloting and Operations, Data Analytics), By End User Industry (Energy and Utilities, Construction and Infrastructure, Agriculture, Public Safety and Government, Media and Entertainment, Mining, Insurance), By Drone Type (Rotary-Wing, Fixed-Wing, Hybrid VTOL), By Operating Range (Visual Line-of-Sight, Beyond Visual Line-of-Sight), By Region (North America, Europe, Asia-Pacific, South America, Middle East & Africa) - Forecast 2035
Drone Services Market
Market Size
Forecast Period2026-2035
CAGR (2026-2035)27.6%
2025 Market SizeUSD 27.8 Billion
2035 Market SizeUSD 317.4 Billion
Key Players
Terra Drone Corporation
Cyberhawk Innovations
Zipline International
Aerodyne Group
PrecisionHawk
Percepto
Opportunities
  • Continuous Monitoring Contracts
  • Emerging-Market Infrastructure Mapping
  • Data Licensing and Derivative Products
  1. 1 Market Summary |
    1. 1.1 Study Assumptions & Market Definition |
    2. 1.2 Scope of the Study |
    3. 1.3 Research Methodology
  2. 2 Key Report Takeaways |
    1. 2.1 By Service Type |
    2. 2.2 By End User Industry |
    3. 2.3 By Region
  3. 3 Market Size and Forecast (2021–2035) |
    1. 3.1 Historical Market Size (2021–2024) |
    2. 3.2 Base Year Assessment (2025) |
    3. 3.3 Forecast Market Size (2026–2035) |
    4. 3.4 Year-over-Year Growth Analysis
  4. 4 Driver Impact Analysis |
    1. 4.1 Regulatory Normalisation of Extended-Range Flight |
    2. 4.2 Utility Asset Economics |
    3. 4.3 Analytics as the Margin Layer |
    4. 4.4 Platform Endurance Breakthroughs
  5. 5 Restraints Impact Analysis |
    1. 5.1 Airspace Fragmentation |
    2. 5.2 Talent Scarcity |
    3. 5.3 Energy Density Limits
  6. 6 Opportunities |
    1. 6.1 Continuous Monitoring Contracts |
    2. 6.2 Emerging-Market Infrastructure Mapping |
    3. 6.3 Data Licensing and Derivative Products |
    4. 6.4 Counter-Drone and Airspace Assurance Services |
    5. 6.5 Medical and Cold-Chain Logistics
  7. 7 Regional Market Share and Country-Level Analysis |
    1. 7.1 North America | |
      1. 7.1.1 US | |
      2. 7.1.2 Canada | |
      3. 7.1.3 Mexico |
    2. 7.2 Europe | |
      1. 7.2.1 Germany | |
      2. 7.2.2 UK | |
      3. 7.2.3 France | |
      4. 7.2.4 Italy | |
      5. 7.2.5 Spain | |
      6. 7.2.6 Nordic Countries | |
      7. 7.2.7 Russia | |
      8. 7.2.8 Rest of Europe |
    3. 7.3 Asia-Pacific | |
      1. 7.3.1 China | |
      2. 7.3.2 India | |
      3. 7.3.3 Japan | |
      4. 7.3.4 South Korea | |
      5. 7.3.5 ASEAN | |
      6. 7.3.6 Rest of Asia-Pacific |
    4. 7.4 South America | |
      1. 7.4.1 Brazil | |
      2. 7.4.2 Argentina | |
      3. 7.4.3 Rest of South America |
    5. 7.5 Middle East & Africa | |
      1. 7.5.1 Saudi Arabia | |
      2. 7.5.2 UAE | |
      3. 7.5.3 South Africa | |
      4. 7.5.4 Egypt | |
      5. 7.5.5 Rest of Middle East & Africa
  8. 8 Future Outlook (2026–2035) |
    1. 8.1 Autonomy Ratios Reset the Cost Curve |
    2. 8.2 Platform Consolidation and the Services Stack |
    3. 8.3 Energy Transition Workload |
    4. 8.4 Assurance, Audit, and Data Provenance
  9. 9 Market Segmentation Analysis |
    1. 9.1 By Service Type | |
      1. 9.1.1 Piloting and Operations | |
      2. 9.1.2 Data Analytics |
    2. 9.2 By End User Industry | |
      1. 9.2.1 Energy and Utilities | |
      2. 9.2.2 Construction and Infrastructure | |
      3. 9.2.3 Agriculture | |
      4. 9.2.4 Public Safety and Government | |
      5. 9.2.5 Media and Entertainment | |
      6. 9.2.6 Mining | |
      7. 9.2.7 Insurance |
    3. 9.3 By Drone Type | |
      1. 9.3.1 Rotary-Wing | |
      2. 9.3.2 Fixed-Wing | |
      3. 9.3.3 Hybrid VTOL |
    4. 9.4 By Operating Range | |
      1. 9.4.1 Visual Line-of-Sight | |
      2. 9.4.2 Beyond Visual Line-of-Sight
  10. 10 Competitive Landscape |
    1. 10.1 Market Concentration Analysis |
    2. 10.2 Competitive Benchmarking Matrix |
    3. 10.3 Company Profiles
  11. 11 Recent News & Developments
  12. 12 Report Scope and Methodology
  13. 13 Detailed Sources and Citations
  14. 14 Frequently Asked Questions
  15. 15 LIST OF TABLES |
  16. TABLE 1 Global Drone Services Market Size & Forecast, by Revenue (USD Billion), 2021–2035 |
  17. TABLE 2 Global Drone Services Market – Year-over-Year Growth Analysis, 2021–2035 |
  18. TABLE 3 Driver Impact Analysis Matrix, 2026–2035 |
  19. TABLE 4 Restraint Impact Analysis Matrix, 2026–2035 |
  20. TABLE 5 Global Market Size, by Region, 2021–2035 (USD Billion) |
  21. TABLE 6 North America Market Size, by Country, 2021–2035 (USD Billion) |
  22. TABLE 7 Europe Market Size, by Country, 2021–2035 (USD Billion) |
  23. TABLE 8 Asia-Pacific Market Size, by Country, 2021–2035 (USD Billion) |
  24. TABLE 9 South America Market Size, by Country, 2021–2035 (USD Billion) |
  25. TABLE 10 Middle East & Africa Market Size, by Country, 2021–2035 (USD Billion) |
  26. TABLE 11 Global Market Size, by Service Type, 2021–2035 (USD Billion) |
  27. TABLE 12 Global Market Size, by End User Industry, 2021–2035 (USD Billion) |
  28. TABLE 13 Global Market Size, by Drone Type, 2021–2035 (USD Billion) |
  29. TABLE 14 Global Market Size, by Operating Range, 2021–2035 (USD Billion) |
  30. TABLE 15 North America Market Size, by Service Type, 2021–2035 (USD Billion) |
  31. TABLE 16 Europe Market Size, by End User Industry, 2021–2035 (USD Billion) |
  32. TABLE 17 Asia-Pacific Market Size, by Drone Type, 2021–2035 (USD Billion) |
  33. TABLE 18 South America Market Size, by Operating Range, 2021–2035 (USD Billion) |
  34. TABLE 19 Middle East & Africa Market Size, by Service Type, 2021–2035 (USD Billion) |
  35. TABLE 20 Competitive Benchmarking Matrix, 2026 |
  36. TABLE 21 Company Profiles – Key Players |
  37. TABLE 22 Recent Developments & Strategic Announcements, 2023–2025 |
  38. TABLE 23 Report Scope & Methodology Summary |
  39. TABLE 24 Detailed Sources and Citations Index
  40. 16 LIST OF FIGURES |
  41. FIGURE 1 Market Dynamics – Drivers, Restraints, Opportunities, and Challenges |
  42. FIGURE 2 Industry Value Chain Analysis |
  43. FIGURE 3 Porter's Five Forces Analysis |
  44. FIGURE 4 Global Market Size Trend and Forecast, 2021–2035 (USD Billion) |
  45. FIGURE 5 Year-over-Year Growth Trajectory, 2022–2035 (%) |
  46. FIGURE 6 Market Share by Service Type, 2025 vs 2035 (%) |
  47. FIGURE 7 Market Share by End User Industry, 2025 (%) |
  48. FIGURE 8 Market Share by Drone Type, 2025 vs 2035 (%) |
  49. FIGURE 9 Market Share by Operating Range, 2025 (%) |
  50. FIGURE 10 Regional Revenue Share Distribution, 2025 (%) |
  51. FIGURE 11 Regional CAGR Comparison, 2026–2035 (%) |
  52. FIGURE 12 Country-Level Revenue Contribution – Top 10 Markets, 2025 |
  53. FIGURE 13 Competitive Landscape Positioning Map, 2026 |
  54. FIGURE 14 Vendor Revenue Share Distribution, 2025 (%) |
  55. FIGURE 15 Technology Adoption Roadmap, 2026–2035

Segmentation Quick Reference

DimensionSub-SegmentsDominant SegmentFastest Growing Segment
By Service TypePiloting and Operations; Data AnalyticsPiloting and OperationsData Analytics
By End User IndustryEnergy and Utilities; Construction and Infrastructure; Agriculture; Public Safety and Government; Media and Entertainment; Mining; InsuranceEnergy and UtilitiesConstruction and Infrastructure
By Drone TypeRotary-Wing; Fixed-Wing; Hybrid VTOLRotary-WingHybrid VTOL
By Operating RangeVisual Line-of-Sight; Beyond Visual Line-of-SightVisual Line-of-SightBeyond Visual Line-of-Sight
By RegionNorth America; Europe; Asia-Pacific; South America; Middle East & AfricaNorth AmericaAsia-Pacific


Market Segmentation Overview

By Service Type

Sub-SegmentKey Trend
Piloting and OperationsAutonomy ratio reform is compressing per-flight labour cost
Data AnalyticsSubscription pricing is replacing per-deliverable billing


Service revenue is migrating from the flight line to the processing pipeline. Operators that once billed by the sortie now bill by the asset monitored, and that shift is reshaping both margin structure and contract duration across the sector.

By End User Industry

Sub-SegmentKey Trend
Energy and UtilitiesCondition-based maintenance replacing calendar inspection cycles
Construction and InfrastructureLender-mandated progress verification driving recurring capture
AgricultureSubsidised spraying programmes expanding smallholder access
Public Safety and GovernmentDrone-as-first-responder deployments in metropolitan agencies
Media and EntertainmentLive event and cinematography demand stabilising at maturity
MiningWeekly volumetric survey becoming standard operating practice
InsuranceCatastrophe response cycles shortening claims settlement


Vertical concentration remains high, with energy and construction together accounting for well over half of global spend. Public safety is the most policy-sensitive vertical, expanding wherever municipal budgets and airspace permissions align.

By Drone Type

Sub-SegmentKey Trend
Rotary-WingDocked resident fleets extending utilisation at fixed sites
Fixed-WingCorridor mapping efficiency sustaining agricultural demand
Hybrid VTOLExtended range unlocking offshore and remote terrain missions


Airframe selection increasingly follows mission geometry rather than vendor preference. Fleets are becoming mixed by default, with operators matching platform class to route length and payload requirement on a per-contract basis.

By Operating Range

Sub-SegmentKey Trend
Visual Line-of-SightRemains default for confined-site and short-duration missions
Beyond Visual Line-of-SightRule-based authorization pathways replacing case-by-case waivers


Range classification is the single strongest predictor of programme economics. As standing authorizations replace individual exemptions, the cost gap between the two categories narrows and adoption of extended-range operations accelerates across every major region.


Download PDF ×

We do not share your information with anyone. However, we may send you emails based on your report interest from time to time. You may contact us at any time to opt-out.