info@marketresearchfuture.com   📞 +1 (855) 661-4441(US)   📞 +44 1720 412 167(UK)   📞 +91 2269738890(APAC)
Certified Global Research Member
Isomar 1 Iso 1
Key Questions Answered
  • Global Market Outlook
  • In-depth analysis of global and regional trends
  • Analyze and identify the major players in the market, their market share, key developments, etc.
  • To understand the capability of the major players based on products offered, financials, and strategies.
  • Identify disrupting products, companies, and trends.
  • To identify opportunities in the market.
  • Analyze the key challenges in the market.
  • Analyze the regional penetration of players, products, and services in the market.
  • Comparison of major players financial performance.
  • Evaluate strategies adopted by major players.
  • Recommendations
Why Choose Market Research Future?
  • Vigorous research methodologies for specific market.
  • Knowledge partners across the globe
  • Large network of partner consultants.
  • Ever-increasing/ Escalating data base with quarterly monitoring of various markets
  • Trusted by fortune 500 companies/startups/ universities/organizations
  • Large database of 5000+ markets reports.
  • Effective and prompt pre- and post-sales support.

Drilling Fluids Market Research Report By Type (Water-Based Fluids, Oil-Based Fluids, Synthetic-Based Fluids, Gas-Based Fluids), By Application (Onshore Drilling, Offshore Drilling, Geothermal Energy, Mining), By Function (Cooling, Lubrication, Cuttings Removal, Pressure Control), By End Use (Oil and Gas, Construction, Environmental, Mining) andBy Regional (North America, Europe, South America, Asia Pacific, Middle East and Africa)- Forecast to 2035


ID: MRFR/E&P/2943-CR | 109 Pages | Author: Priya Nagrale| October 2020

Drilling Fluids Market Summary

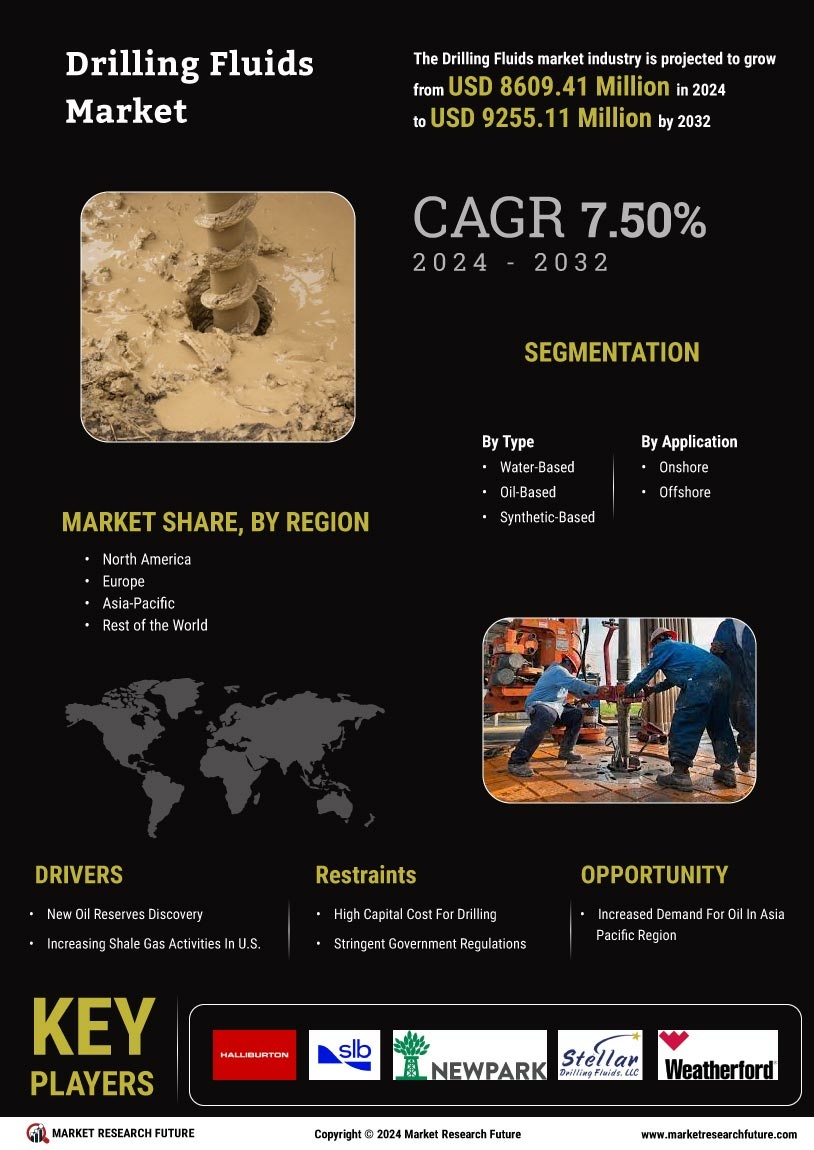
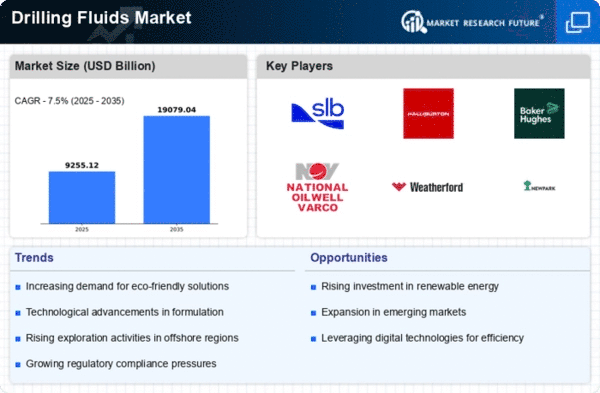
As per Market Research Future Analysis, the Global Drilling Fluids Market was valued at 9.8 USD Billion in 2023 and is projected to grow to 15 USD Billion by 2035, with a CAGR of 3.61% from 2025 to 2035. The market is driven by the increasing demand for oil and gas, advancements in drilling technology, and a shift towards eco-friendly solutions. Key players are focusing on innovative and sustainable drilling fluid formulations to meet regulatory standards and operational efficiency.

Key Market Trends & Highlights

The Drilling Fluids Market is witnessing significant trends influenced by various factors.

  • Market Size in 2024: 10.15 USD Billion; expected to reach 15 USD Billion by 2035.
  • Water-Based Fluids segment projected to grow from 4.05 USD Billion in 2024 to 5.85 USD Billion by 2035.
  • Oil-Based Fluids segment expected to rise from 3.15 USD Billion in 2024 to 4.5 USD Billion by 2035.
  • North America to dominate with a market value of 3.55 USD Billion in 2024, growing to 5.25 USD Billion by 2035.

Market Size & Forecast

2023 Market Size: USD 9.8 Billion
2024 Market Size: USD 10.15 Billion
2035 Market Size: USD 15 Billion
CAGR (2025-2035): 3.61%
Largest Regional Market Share in 2024: North America.

Major Players

Key Companies include Weatherford International, MI SWACO, Baker Hughes, Schlumberger, Intecsea, Geoservices, Petrochemical Energy, Bristol Oil, Newpark Resources, Halliburton, National Oilwell Varco, Baroid Industrial, Agnity, Tetra Technologies, Cimarex Energy.

Key Drilling Fluids Market Trends Highlighted

Particularly in areas with unexploited deposits and rising shale gas exploration expenditure, there are many chances to be investigated. The move toward sustainable practices is creating possibilities for the creation of bio-based and biodegradable drilling fluids, which fit with corporate social responsibility requirements and world environmental rules. Digital technologies in the shape of IoT and artificial intelligence are also simplifying drilling operations, hence enabling cost savings and efficiency improvements. Driven by worries about environmental effects and regulatory pressure, recent trends show an increasing preference for non-toxic drilling fluids, especially water-based ones.

Companies are pushing for more operational accuracy, so the movement toward automation and improved data analytics in drilling procedures is also increasingly noticeable. Countries concentrating on energy transition plans will drive a greater need for creative and dependable drilling fluids solutions that satisfy legal standards, influencing the future of the worldwide market.

Global Drilling Fluids Market Overview

Source: Primary Research, Secondary Research, Market Research Future Database and Analyst Review

Drilling Fluids Market Drivers

    • Increasing Demand for Oil and Gas Exploration

The rising demand for oil and gas exploration operations mostly drives the Drilling Fluids Market Industry. With a strong need for energy supplies, the International Energy Agency (IEA) forecasts worldwide oil consumption to hit 104.1 million barrels per day by 2026. Drilling activity has increased in countries including the United States, Saudi Arabia, and Russia, which has led operators to look for new drilling fluids that improve efficiency and lower costs.

Investments in exploration and production technologies are crucial as energy use grows, as they correspond with the expansion of the drilling fluids market. Furthermore, well-known companies like the American Petroleum Institute (API) are actively engaged in developing standards and encouraging creativity in drilling technology, hence supporting the need for advanced drilling fluids that fit the sector's changing requirements.

    • Technological Advancements in Drilling Techniques

The Drilling Fluids Market is mostly driven by technological developments. Inventions like horizontal drilling and hydraulic fracturing have underlined the need for high-performance drilling fluids that can resist complicated geological conditions. These innovative technologies have led the Society of Petroleum Engineers (SPE) to record notable increases in drilling efficiency. The need for high-quality drilling fluids will always increase as operators try to optimize recovery rates from current resources.

The use of automated drilling rigs and real-time monitoring systems, for instance, improves performance and reduces downtime, hence increasing the demand for advanced drilling solutions.

    • Stringent Environmental Regulations

Tighter environmental rules in many distinct parts of the world underline the need for eco-friendly drilling fluids, thus promoting the expansion of the Drilling Fluids Market Industry. Regulatory agencies like the Environmental Protection Agency (EPA) in the United States are enforcing tighter rules on the use and disposal of drilling fluids, hence encouraging oil and gas corporations to spend money on ecologically safe goods. Increased rules have spurred further research and development of non-toxic, biodegradable drilling fluids; the market sector for water-based fluids has a significant compound annual growth rate (CAGR).

Meeting compliance and guaranteeing sustainable practices in drilling operations depend on this trend.

Drilling Fluids Market Segment Insights:

Drilling Fluids Market Type Insights

The Drilling Fluids Market, segmented by Type, showcases a dynamic landscape with significant contributions from various fluid categories. In 2024, the overall market is expected to be valued at 10.15 USD Billion, reflecting a robust demand for drilling fluid solutions across diverse applications. The Water-Based Fluids segment leads the way, valued at 4.05 USD Billion in 2024 and projected to grow to 5.85 USD Billion by 2035, primarily due to their eco-friendly nature and cost-effectiveness, thereby holding a majority market share. The Oil-Based Fluids segment, valued at 3.15 USD Billion in 2024, is crucial for high-performance drilling operations, targeting complex geological formations that require superior lubricity.

Its value is expected to rise to 4.5 USD Billion by 2035, indicating a continued reliance on oil-based fluids for challenging drilling conditions. Moreover, the Synthetic-Based Fluids category is anticipated to gain traction, with a market valuation of 2.4 USD Billion in 2024, expanding to 3.35 USD Billion by 2035. This segment is significant owing to its ability to offer an optimal balance of performance and environmental compatibility, making it a preferred choice in environmentally sensitive areas or regions with strict regulations. In contrast, the Gas-Based Fluids segment, while smaller at 0.55 USD Billion in 2024, is expected to grow to 1.3 USD Billion by 2035.

This growth demonstrates emerging opportunities for gas-based solutions, particularly in offshore drilling and operations requiring specialized fluid properties. As such, while the Water-Based and Oil-Based segments dominate the market due to their established applications, the Synthetic-Based and Gas-Based categories present unique growth avenues, reflecting the evolving demands of the drilling industry. Consequently, the Drilling Fluids Market demonstrates a multifaceted approach toward fluid selection, driven by a combination of performance requirements, environmental considerations, and operational challenges across the globe.

Drilling Fluids Market Type Insights

Source: Primary Research, Secondary Research, Market Research Future Database and Analyst Review

Drilling Fluids Market Application Insights

The Drilling Fluids Market is poised for growth, particularly in its Application segment, slated to be valued at 10.15 USD Billion by 2024. This segment encompasses various applications, including Onshore Drilling, Offshore Drilling, Geothermal Energy, and Mining, which are essential for resource extraction and energy generation. Onshore Drilling has consistently dominated this market due to its extensive applications in oil and gas exploration, while Offshore Drilling benefits from increasingly advanced technologies that enhance efficiency and safety in marine environments. Geothermal Energy presents significant growth opportunities as the world transitions towards renewable energy sources, leveraging drilling fluids developed for sustainable energy extraction.

Furthermore, the Mining sector relies on specialized drilling fluids for improved performance and safety during mineral extraction, making it a vital aspect of the industry. Collectively, these areas illustrate the diverse potential and robust demand influencing the Drilling Fluids Market revenue, driven by challenges such as environmental regulations and the need for innovation in drilling technologies. As data suggests, the market is expected to witness a steady growth trajectory, with each application playing a crucial role in meeting the increasing energy demands globally.

Drilling Fluids Market Function Insights

The Drilling Fluids Market, particularly within the Function segment, is integral to the efficiency and effectiveness of drilling operations. As the market is projected to be valued at 10.15 USD Billion in 2024, it highlights the growing demand for advanced drilling solutions across various applications. The Function segment encompasses several critical areas including Cooling, Lubrication, Cuttings Removal, and Pressure Control. Cooling functions are vital for reducing friction and heat generation during drilling, thus enhancing equipment longevity. Similarly, Lubrication helps maintain the integrity of drill bits and tools, leading to improved performance and reduced wear.

Cuttings Removal is crucial for maintaining borehole stability and ensuring the continuous progress of drilling operations. Pressure Control is essential for managing the fluid dynamics within the wellbore to prevent blowouts and other drilling hazards. Each of these functions contributes significantly to optimizing drilling processes, thereby ensuring a safer and more productive environment in the Drilling Fluids Market. As this industry continues to evolve, understanding the diverse roles played by each function will be essential for stakeholders involved in drilling endeavors worldwide.

Drilling Fluids Market End Use Insights

The Drilling Fluids Market has shown significant growth, especially within its End Use segment, which includes essential applications in Oil and Gas, Construction, Environmental, and Mining industries. By 2024, the overall market is expected to reach a valuation of 10.15 USD Billion, indicative of a steady rise in demand driven by increased exploration activities and infrastructural developments worldwide. The Oil and Gas sector remains a leading player due to the ongoing global energy needs, creating substantial opportunities. Similarly, the Construction industry increasingly relies on efficient drilling fluids for foundation and well services, reflecting the importance of robust infrastructure.

Environmental applications are gaining traction as regulations tighten, driving innovation in sustainable drilling fluid solutions. Meanwhile, Mining activities expand in response to growing mineral demand, underscoring the relevance of drilling fluids in resource extraction. The Drilling Fluids Market segmentation reveals that while all segments contribute to market dynamics, Oil and Gas prominently dominates as the backbone of energy production. This key focus on End Use applications highlights the multifaceted nature of drilling fluids, presenting both opportunities and challenges for growth across various sectors.

Drilling Fluids Market Regional Insights

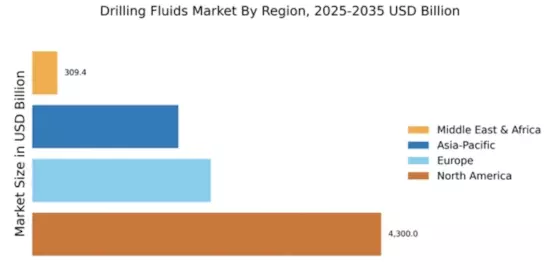
The Drilling Fluids Market is projected to experience significant growth, with regional markets contributing notably to this upward trajectory. In 2024, North America is anticipated to hold a major share, valued at 3.55 USD Billion, and is expected to reach 5.25 USD Billion by 2035, highlighting its dominance in the industry. Europe follows with a valuation of 2.45 USD Billion in 2024, growing to 3.55 USD Billion in 2035, indicating its strong foothold driven by regulatory practices and technological advancements.

The APAC region, valuing at 2.85 USD Billion in 2024 and projected to grow to 4.25 USD Billion by 2035, is gaining traction due to increasing energy demands and ongoing exploration projects. South America, while smaller, is still significant with a valuation of 0.75 USD Billion in 2024, expected to increase to 1.25 USD Billion by 2035, reflecting the region’s potential in natural resource extraction. The Middle East and Africa (MEA) market, starting at 0.6 USD Billion in 2024 and reaching 1.0 USD Billion in 2035, is crucial for its oil reserves and strategic positioning in global energy supply. Collectively, these regions are shaping the Drilling Fluids Market landscape, demonstrating varied growth drivers and market dynamics influenced by local regulations, resource availability, and investment trends.

Drilling Fluids Market Regional Insights

Source: Primary Research, Secondary Research, Market Research Future Database and Analyst Review

Drilling Fluids Market Key Players and Competitive Insights:

The Drilling Fluids Market is characterized by a dynamic competitive landscape, driven by the increasing demand for drilling fluids across various sectors such as oil and gas exploration, mining, and geothermal energy. As operators seek to enhance drilling efficiency and minimize costs, the market has witnessed significant innovations and advancements in fluid formulations, which has intensified competition among key players. Different regions experience varying levels of demand influenced by local regulations, resource availability, and technological advancements.

This evolving landscape has led to heightened focus on product differentiation and the development of eco-friendly drilling fluid solutions, which cater to environmental concerns while ensuring optimal performance in drilling operations. Companies are investing in research and development to create customized solutions that address the unique challenges associated with various geological environments, thereby enhancing their competitive positioning in the market. Weatherford International benefits from a strong presence in the Drilling Fluids Market due to its extensive portfolio that includes innovative drilling fluid systems and services tailored for diverse applications.

The company's commitment to providing comprehensive solutions ensures it can meet the specific needs of customers operating in challenging environments. Weatherford's established global network and strong technical expertise bolster its capabilities in delivering reliable and high-performance drilling fluids. With a focus on sustainability and efficiency, Weatherford International has developed formulations designed to improve drilling rates and reduce environmental impact, thereby strengthening its market position. The brand’s adaptability to changing market trends and technological advancements further reinforces its stature in the competitive landscape of drilling fluids. MI SWACO, a subsidiary of a leading energy services company, offers a comprehensive range of drilling fluid solutions that are widely utilized across the globe.

The company specializes in advanced drilling fluid systems, including water-based, oil-based, and synthetic-based fluids, catering to various drilling conditions and customer requirements. MI SWACO is recognized for its commitment to innovation and sustainability, aiming to provide solutions that enhance drilling performance while minimizing ecological impact. Through strategic mergers and acquisitions, MI SWACO has significantly expanded its market presence, allowing it to leverage synergies and enhance service delivery.

Its dedication to research and development has led to the introduction of innovative products that address the complex challenges faced by the drilling industry. The strength of MI SWACO lies in its ability to integrate technology into its offerings, which positions the company as a key player in the Drilling Fluids Market, ensuring it remains competitive in an ever-evolving landscape.

Key Companies in the Drilling Fluids Market Include:

    • Weatherford International
    • MI SWACO
    • Baker Hughes
    • Schlumberger
    • Intecsea
    • Geoservices
    • Petrochemical Energy
    • Bristol Oil
    • Newpark Resources
    • Halliburton
    • National Oilwell Varco
    • Baroid Industrial
    • Agnity
    • Tetra Technologies
    • Cimarex Energy

Drilling Fluids Market Industry Developments

The Drilling Fluids Market is currently witnessing several notable developments, including increased investments and advancements in alternative drilling fluids aimed at reducing environmental impact. Companies like Schlumberger and Halliburton are implementing advanced technologies to enhance drilling efficiency. In terms of mergers and acquisitions, in September 2023, Baker Hughes acquired a key technology startup focused on sustainable drilling solutions, further solidifying their market presence. Similarly, Weatherford International announced the acquisition of a small rival firm in October 2023, which will expand their product offerings and improve operational capabilities.

The market continues to grow, driven by the rising demand for oil and gas, with projections indicating a significant valuation increase over the next few years. Reports from various government sources indicate that investments in the energy sector are rising, reinforcing the importance of drilling fluids in improved extraction techniques. In recent years, the market has adapted to regulatory changes and environmental concerns, with developments in biobased and eco-friendly fluid formulations becoming critical. Companies like MI SWACO and National Oilwell Varco are actively pursuing Research and Development initiatives to meet these emerging market demands.

Report Attribute/Metric Source: Details
MARKET SIZE 2023 9.8 (USD Billion)
MARKET SIZE 2024 10.15 (USD Billion)
MARKET SIZE 2035 15.0 (USD Billion)
COMPOUND ANNUAL GROWTH RATE (CAGR) 3.61% (2025 - 2035)
REPORT COVERAGE Revenue Forecast, Competitive Landscape, Growth Factors, and Trends
BASE YEAR 2024
MARKET FORECAST PERIOD 2025 - 2035
HISTORICAL DATA 2019 - 2024
MARKET FORECAST UNITS USD Billion
KEY COMPANIES PROFILED Weatherford International, MI SWACO, Baker Hughes, Schlumberger, Intecsea, Geoservices, Petrochemical Energy, Bristol Oil, Newpark Resources, Halliburton, National Oilwell Varco, Baroid Industrial, Agnity, Tetra Technologies, Cimarex Energy
SEGMENTS COVERED Type, Application, Function, End Use, Regional
KEY MARKET OPPORTUNITIES Increasing offshore drilling activities, Rising demand for environmentally friendly fluids, Growth in shale gas exploration, Technological advancements in fluid systems, Expanding oil and gas production in emerging markets
KEY MARKET DYNAMICS growing demand for energy, advancements in drilling technology, environmental regulations and compliance, fluctuating crude oil prices, increasing offshore drilling activities
COUNTRIES COVERED North America, Europe, APAC, South America, MEA


Frequently Asked Questions (FAQ):

The Global Drilling Fluids Market is expected to be valued at 10.15 USD Billion in 2024.

The market is projected to grow at a CAGR of 3.61% from 2025 to 2035.

North America is expected to hold the largest market share, valued at 5.25 USD Billion by 2035.

The market value for Oil-Based Fluids is expected to reach 4.5 USD Billion by 2035.

Major players include Weatherford International, MI SWACO, Baker Hughes, and Schlumberger.

The market value for Water-Based Fluids in 2024 is expected to be 4.05 USD Billion.

The Synthetic-Based Fluids segment is expected to be valued at 3.35 USD Billion in 2035.

The projected value of the market in South America by 2035 is 1.25 USD Billion.

Key trends include a steady demand for advanced drilling fluids and the growing application in offshore drilling.

The market value for Gas-Based Fluids in 2024 is expected to be 0.55 USD Billion.

Comments

Drilling Fluids Market Segmentation


  • Drilling Fluids Market By Type (USD Billion, 2019-2035)


    • Water-Based Fluids


    • Oil-Based Fluids


    • Synthetic-Based Fluids


    • Gas-Based Fluids


  • Drilling Fluids Market By Application (USD Billion, 2019-2035)


    • Onshore Drilling


    • Offshore Drilling


    • Geothermal Energy


    • Mining


  • Drilling Fluids Market By Function (USD Billion, 2019-2035)


    • Cooling


    • Lubrication


    • Cuttings Removal


    • Pressure Control


  • Drilling Fluids Market By End Use (USD Billion, 2019-2035)


    • Oil and Gas


    • Construction


    • Environmental


    • Mining


  • Drilling Fluids Market By Regional (USD Billion, 2019-2035)


    • North America


    • Europe


    • South America


    • Asia Pacific


    • Middle East and Africa


Drilling Fluids Market Regional Outlook (USD Billion, 2019-2035)


  • North America Drilling Fluids Market Outlook (USD Billion, 2019-2035)


    • North America by Type


      • Water-Based Fluids


      • Oil-Based Fluids


      • Synthetic-Based Fluids


      • Gas-Based Fluids


    • North America by Application Type


      • Onshore Drilling


      • Offshore Drilling


      • Geothermal Energy


      • Mining


    • North America by Function Type


      • Cooling


      • Lubrication


      • Cuttings Removal


      • Pressure Control


    • North America by End Use Type


      • Oil and Gas


      • Construction


      • Environmental


      • Mining


    • North America by Regional Type


      • US


      • Canada


    • US Outlook (USD Billion, 2019-2035)


    • US by Type


      • Water-Based Fluids


      • Oil-Based Fluids


      • Synthetic-Based Fluids


      • Gas-Based Fluids


    • US by Application Type


      • Onshore Drilling


      • Offshore Drilling


      • Geothermal Energy


      • Mining


    • US by Function Type


      • Cooling


      • Lubrication


      • Cuttings Removal


      • Pressure Control


    • US by End Use Type


      • Oil and Gas


      • Construction


      • Environmental


      • Mining


    • CANADA Outlook (USD Billion, 2019-2035)


    • CANADA by Type


      • Water-Based Fluids


      • Oil-Based Fluids


      • Synthetic-Based Fluids


      • Gas-Based Fluids


    • CANADA by Application Type


      • Onshore Drilling


      • Offshore Drilling


      • Geothermal Energy


      • Mining


    • CANADA by Function Type


      • Cooling


      • Lubrication


      • Cuttings Removal


      • Pressure Control


    • CANADA by End Use Type


      • Oil and Gas


      • Construction


      • Environmental


      • Mining


  • Europe Drilling Fluids Market Outlook (USD Billion, 2019-2035)


    • Europe by Type


      • Water-Based Fluids


      • Oil-Based Fluids


      • Synthetic-Based Fluids


      • Gas-Based Fluids


    • Europe by Application Type


      • Onshore Drilling


      • Offshore Drilling


      • Geothermal Energy


      • Mining


    • Europe by Function Type


      • Cooling


      • Lubrication


      • Cuttings Removal


      • Pressure Control


    • Europe by End Use Type


      • Oil and Gas


      • Construction


      • Environmental


      • Mining


    • Europe by Regional Type


      • Germany


      • UK


      • France


      • Russia


      • Italy


      • Spain


      • Rest of Europe


    • GERMANY Outlook (USD Billion, 2019-2035)


    • GERMANY by Type


      • Water-Based Fluids


      • Oil-Based Fluids


      • Synthetic-Based Fluids


      • Gas-Based Fluids


    • GERMANY by Application Type


      • Onshore Drilling


      • Offshore Drilling


      • Geothermal Energy


      • Mining


    • GERMANY by Function Type


      • Cooling


      • Lubrication


      • Cuttings Removal


      • Pressure Control


    • GERMANY by End Use Type


      • Oil and Gas


      • Construction


      • Environmental


      • Mining


    • UK Outlook (USD Billion, 2019-2035)


    • UK by Type


      • Water-Based Fluids


      • Oil-Based Fluids


      • Synthetic-Based Fluids


      • Gas-Based Fluids


    • UK by Application Type


      • Onshore Drilling


      • Offshore Drilling


      • Geothermal Energy


      • Mining


    • UK by Function Type


      • Cooling


      • Lubrication


      • Cuttings Removal


      • Pressure Control


    • UK by End Use Type


      • Oil and Gas


      • Construction


      • Environmental


      • Mining


    • FRANCE Outlook (USD Billion, 2019-2035)


    • FRANCE by Type


      • Water-Based Fluids


      • Oil-Based Fluids


      • Synthetic-Based Fluids


      • Gas-Based Fluids


    • FRANCE by Application Type


      • Onshore Drilling


      • Offshore Drilling


      • Geothermal Energy


      • Mining


    • FRANCE by Function Type


      • Cooling


      • Lubrication


      • Cuttings Removal


      • Pressure Control


    • FRANCE by End Use Type


      • Oil and Gas


      • Construction


      • Environmental


      • Mining


    • RUSSIA Outlook (USD Billion, 2019-2035)


    • RUSSIA by Type


      • Water-Based Fluids


      • Oil-Based Fluids


      • Synthetic-Based Fluids


      • Gas-Based Fluids


    • RUSSIA by Application Type


      • Onshore Drilling


      • Offshore Drilling


      • Geothermal Energy


      • Mining


    • RUSSIA by Function Type


      • Cooling


      • Lubrication


      • Cuttings Removal


      • Pressure Control


    • RUSSIA by End Use Type


      • Oil and Gas


      • Construction


      • Environmental


      • Mining


    • ITALY Outlook (USD Billion, 2019-2035)


    • ITALY by Type


      • Water-Based Fluids


      • Oil-Based Fluids


      • Synthetic-Based Fluids


      • Gas-Based Fluids


    • ITALY by Application Type


      • Onshore Drilling


      • Offshore Drilling


      • Geothermal Energy


      • Mining


    • ITALY by Function Type


      • Cooling


      • Lubrication


      • Cuttings Removal


      • Pressure Control


    • ITALY by End Use Type


      • Oil and Gas


      • Construction


      • Environmental


      • Mining


    • SPAIN Outlook (USD Billion, 2019-2035)


    • SPAIN by Type


      • Water-Based Fluids


      • Oil-Based Fluids


      • Synthetic-Based Fluids


      • Gas-Based Fluids


    • SPAIN by Application Type


      • Onshore Drilling


      • Offshore Drilling


      • Geothermal Energy


      • Mining


    • SPAIN by Function Type


      • Cooling


      • Lubrication


      • Cuttings Removal


      • Pressure Control


    • SPAIN by End Use Type


      • Oil and Gas


      • Construction


      • Environmental


      • Mining


    • REST OF EUROPE Outlook (USD Billion, 2019-2035)


    • REST OF EUROPE by Type


      • Water-Based Fluids


      • Oil-Based Fluids


      • Synthetic-Based Fluids


      • Gas-Based Fluids


    • REST OF EUROPE by Application Type


      • Onshore Drilling


      • Offshore Drilling


      • Geothermal Energy


      • Mining


    • REST OF EUROPE by Function Type


      • Cooling


      • Lubrication


      • Cuttings Removal


      • Pressure Control


    • REST OF EUROPE by End Use Type


      • Oil and Gas


      • Construction


      • Environmental


      • Mining


  • APAC Drilling Fluids Market Outlook (USD Billion, 2019-2035)


    • APAC by Type


      • Water-Based Fluids


      • Oil-Based Fluids


      • Synthetic-Based Fluids


      • Gas-Based Fluids


    • APAC by Application Type


      • Onshore Drilling


      • Offshore Drilling


      • Geothermal Energy


      • Mining


    • APAC by Function Type


      • Cooling


      • Lubrication


      • Cuttings Removal


      • Pressure Control


    • APAC by End Use Type


      • Oil and Gas


      • Construction


      • Environmental


      • Mining


    • APAC by Regional Type


      • China


      • India


      • Japan


      • South Korea


      • Malaysia


      • Thailand


      • Indonesia


      • Rest of APAC


    • CHINA Outlook (USD Billion, 2019-2035)


    • CHINA by Type


      • Water-Based Fluids


      • Oil-Based Fluids


      • Synthetic-Based Fluids


      • Gas-Based Fluids


    • CHINA by Application Type


      • Onshore Drilling


      • Offshore Drilling


      • Geothermal Energy


      • Mining


    • CHINA by Function Type


      • Cooling


      • Lubrication


      • Cuttings Removal


      • Pressure Control


    • CHINA by End Use Type


      • Oil and Gas


      • Construction


      • Environmental


      • Mining


    • INDIA Outlook (USD Billion, 2019-2035)


    • INDIA by Type


      • Water-Based Fluids


      • Oil-Based Fluids


      • Synthetic-Based Fluids


      • Gas-Based Fluids


    • INDIA by Application Type


      • Onshore Drilling


      • Offshore Drilling


      • Geothermal Energy


      • Mining


    • INDIA by Function Type


      • Cooling


      • Lubrication


      • Cuttings Removal


      • Pressure Control


    • INDIA by End Use Type


      • Oil and Gas


      • Construction


      • Environmental


      • Mining


    • JAPAN Outlook (USD Billion, 2019-2035)


    • JAPAN by Type


      • Water-Based Fluids


      • Oil-Based Fluids


      • Synthetic-Based Fluids


      • Gas-Based Fluids


    • JAPAN by Application Type


      • Onshore Drilling


      • Offshore Drilling


      • Geothermal Energy


      • Mining


    • JAPAN by Function Type


      • Cooling


      • Lubrication


      • Cuttings Removal


      • Pressure Control


    • JAPAN by End Use Type


      • Oil and Gas


      • Construction


      • Environmental


      • Mining


    • SOUTH KOREA Outlook (USD Billion, 2019-2035)


    • SOUTH KOREA by Type


      • Water-Based Fluids


      • Oil-Based Fluids


      • Synthetic-Based Fluids


      • Gas-Based Fluids


    • SOUTH KOREA by Application Type


      • Onshore Drilling


      • Offshore Drilling


      • Geothermal Energy


      • Mining


    • SOUTH KOREA by Function Type


      • Cooling


      • Lubrication


      • Cuttings Removal


      • Pressure Control


    • SOUTH KOREA by End Use Type


      • Oil and Gas


      • Construction


      • Environmental


      • Mining


    • MALAYSIA Outlook (USD Billion, 2019-2035)


    • MALAYSIA by Type


      • Water-Based Fluids


      • Oil-Based Fluids


      • Synthetic-Based Fluids


      • Gas-Based Fluids


    • MALAYSIA by Application Type


      • Onshore Drilling


      • Offshore Drilling


      • Geothermal Energy


      • Mining


    • MALAYSIA by Function Type


      • Cooling


      • Lubrication


      • Cuttings Removal


      • Pressure Control


    • MALAYSIA by End Use Type


      • Oil and Gas


      • Construction


      • Environmental


      • Mining


    • THAILAND Outlook (USD Billion, 2019-2035)


    • THAILAND by Type


      • Water-Based Fluids


      • Oil-Based Fluids


      • Synthetic-Based Fluids


      • Gas-Based Fluids


    • THAILAND by Application Type


      • Onshore Drilling


      • Offshore Drilling


      • Geothermal Energy


      • Mining


    • THAILAND by Function Type


      • Cooling


      • Lubrication


      • Cuttings Removal


      • Pressure Control


    • THAILAND by End Use Type


      • Oil and Gas


      • Construction


      • Environmental


      • Mining


    • INDONESIA Outlook (USD Billion, 2019-2035)


    • INDONESIA by Type


      • Water-Based Fluids


      • Oil-Based Fluids


      • Synthetic-Based Fluids


      • Gas-Based Fluids


    • INDONESIA by Application Type


      • Onshore Drilling


      • Offshore Drilling


      • Geothermal Energy


      • Mining


    • INDONESIA by Function Type


      • Cooling


      • Lubrication


      • Cuttings Removal


      • Pressure Control


    • INDONESIA by End Use Type


      • Oil and Gas


      • Construction


      • Environmental


      • Mining


    • REST OF APAC Outlook (USD Billion, 2019-2035)


    • REST OF APAC by Type


      • Water-Based Fluids


      • Oil-Based Fluids


      • Synthetic-Based Fluids


      • Gas-Based Fluids


    • REST OF APAC by Application Type


      • Onshore Drilling


      • Offshore Drilling


      • Geothermal Energy


      • Mining


    • REST OF APAC by Function Type


      • Cooling


      • Lubrication


      • Cuttings Removal


      • Pressure Control


    • REST OF APAC by End Use Type


      • Oil and Gas


      • Construction


      • Environmental


      • Mining


  • South America Drilling Fluids Market Outlook (USD Billion, 2019-2035)


    • South America by Type


      • Water-Based Fluids


      • Oil-Based Fluids


      • Synthetic-Based Fluids


      • Gas-Based Fluids


    • South America by Application Type


      • Onshore Drilling


      • Offshore Drilling


      • Geothermal Energy


      • Mining


    • South America by Function Type


      • Cooling


      • Lubrication


      • Cuttings Removal


      • Pressure Control


    • South America by End Use Type


      • Oil and Gas


      • Construction


      • Environmental


      • Mining


    • South America by Regional Type


      • Brazil


      • Mexico


      • Argentina


      • Rest of South America


    • BRAZIL Outlook (USD Billion, 2019-2035)


    • BRAZIL by Type


      • Water-Based Fluids


      • Oil-Based Fluids


      • Synthetic-Based Fluids


      • Gas-Based Fluids


    • BRAZIL by Application Type


      • Onshore Drilling


      • Offshore Drilling


      • Geothermal Energy


      • Mining


    • BRAZIL by Function Type


      • Cooling


      • Lubrication


      • Cuttings Removal


      • Pressure Control


    • BRAZIL by End Use Type


      • Oil and Gas


      • Construction


      • Environmental


      • Mining


    • MEXICO Outlook (USD Billion, 2019-2035)


    • MEXICO by Type


      • Water-Based Fluids


      • Oil-Based Fluids


      • Synthetic-Based Fluids


      • Gas-Based Fluids


    • MEXICO by Application Type


      • Onshore Drilling


      • Offshore Drilling


      • Geothermal Energy


      • Mining


    • MEXICO by Function Type


      • Cooling


      • Lubrication


      • Cuttings Removal


      • Pressure Control


    • MEXICO by End Use Type


      • Oil and Gas


      • Construction


      • Environmental


      • Mining


    • ARGENTINA Outlook (USD Billion, 2019-2035)


    • ARGENTINA by Type


      • Water-Based Fluids


      • Oil-Based Fluids


      • Synthetic-Based Fluids


      • Gas-Based Fluids


    • ARGENTINA by Application Type


      • Onshore Drilling


      • Offshore Drilling


      • Geothermal Energy


      • Mining


    • ARGENTINA by Function Type


      • Cooling


      • Lubrication


      • Cuttings Removal


      • Pressure Control


    • ARGENTINA by End Use Type


      • Oil and Gas


      • Construction


      • Environmental


      • Mining


    • REST OF SOUTH AMERICA Outlook (USD Billion, 2019-2035)


    • REST OF SOUTH AMERICA by Type


      • Water-Based Fluids


      • Oil-Based Fluids


      • Synthetic-Based Fluids


      • Gas-Based Fluids


    • REST OF SOUTH AMERICA by Application Type


      • Onshore Drilling


      • Offshore Drilling


      • Geothermal Energy


      • Mining


    • REST OF SOUTH AMERICA by Function Type


      • Cooling


      • Lubrication


      • Cuttings Removal


      • Pressure Control


    • REST OF SOUTH AMERICA by End Use Type


      • Oil and Gas


      • Construction


      • Environmental


      • Mining


  • MEA Drilling Fluids Market Outlook (USD Billion, 2019-2035)


    • MEA by Type


      • Water-Based Fluids


      • Oil-Based Fluids


      • Synthetic-Based Fluids


      • Gas-Based Fluids


    • MEA by Application Type


      • Onshore Drilling


      • Offshore Drilling


      • Geothermal Energy


      • Mining


    • MEA by Function Type


      • Cooling


      • Lubrication


      • Cuttings Removal


      • Pressure Control


    • MEA by End Use Type


      • Oil and Gas


      • Construction


      • Environmental


      • Mining


    • MEA by Regional Type


      • GCC Countries


      • South Africa


      • Rest of MEA


    • GCC COUNTRIES Outlook (USD Billion, 2019-2035)


    • GCC COUNTRIES by Type


      • Water-Based Fluids


      • Oil-Based Fluids


      • Synthetic-Based Fluids


      • Gas-Based Fluids


    • GCC COUNTRIES by Application Type


      • Onshore Drilling


      • Offshore Drilling


      • Geothermal Energy


      • Mining


    • GCC COUNTRIES by Function Type


      • Cooling


      • Lubrication


      • Cuttings Removal


      • Pressure Control


    • GCC COUNTRIES by End Use Type


      • Oil and Gas


      • Construction


      • Environmental


      • Mining


    • SOUTH AFRICA Outlook (USD Billion, 2019-2035)


    • SOUTH AFRICA by Type


      • Water-Based Fluids


      • Oil-Based Fluids


      • Synthetic-Based Fluids


      • Gas-Based Fluids


    • SOUTH AFRICA by Application Type


      • Onshore Drilling


      • Offshore Drilling


      • Geothermal Energy


      • Mining


    • SOUTH AFRICA by Function Type


      • Cooling


      • Lubrication


      • Cuttings Removal


      • Pressure Control


    • SOUTH AFRICA by End Use Type


      • Oil and Gas


      • Construction


      • Environmental


      • Mining


    • REST OF MEA Outlook (USD Billion, 2019-2035)


    • REST OF MEA by Type


      • Water-Based Fluids


      • Oil-Based Fluids


      • Synthetic-Based Fluids


      • Gas-Based Fluids


    • REST OF MEA by Application Type


      • Onshore Drilling


      • Offshore Drilling


      • Geothermal Energy


      • Mining


    • REST OF MEA by Function Type


      • Cooling


      • Lubrication


      • Cuttings Removal


      • Pressure Control


    • REST OF MEA by End Use Type


      • Oil and Gas


      • Construction


      • Environmental


      • Mining


TABLE OF CONTENTS

1. EXECUTIVE SUMMARY

1.1. Market Overview

1.2. Key Findings

1.3. Market Segmentation

1.4. Competitive Landscape

1.5. Challenges and Opportunities

1.6. Future Outlook

2. MARKET INTRODUCTION

2.1. Definition

2.2. Scope of the study

2.2.1. Research Objective

2.2.2. Assumption

2.2.3. Limitations

3. RESEARCH METHODOLOGY

3.1. Overview

3.2. Data Mining

3.3. Secondary Research

3.4. Primary Research

3.4.1. Primary Interviews and Information Gathering Process

3.4.2. Breakdown of Primary Respondents

3.5. Forecasting Model

3.6. Market Size Estimation

3.6.1. Bottom-Up Approach

3.6.2. Top-Down Approach

3.7. Data Triangulation

3.8. Validation

4. MARKET DYNAMICS

4.1. Overview

4.2. Drivers

4.3. Restraints

4.4. Opportunities

5. MARKET FACTOR ANALYSIS

5.1. Value chain Analysis

5.2. Porter's Five Forces Analysis

5.2.1. Bargaining Power of Suppliers

5.2.2. Bargaining Power of Buyers

5.2.3. Threat of New Entrants

5.2.4. Threat of Substitutes

5.2.5. Intensity of Rivalry

5.3. COVID-19 Impact Analysis

5.3.1. Market Impact Analysis

5.3.2. Regional Impact

5.3.3. Opportunity and Threat Analysis

6. DRILLING FLUIDS MARKET, BY TYPE (USD BILLION)

6.1. Water-Based Fluids

6.2. Oil-Based Fluids

6.3. Synthetic-Based Fluids

6.4. Gas-Based Fluids

7. DRILLING FLUIDS MARKET, BY APPLICATION (USD BILLION)

7.1. Onshore Drilling

7.2. Offshore Drilling

7.3. Geothermal Energy

7.4. Mining

8. DRILLING FLUIDS MARKET, BY FUNCTION (USD BILLION)

8.1. Cooling

8.2. Lubrication

8.3. Cuttings Removal

8.4. Pressure Control

9. DRILLING FLUIDS MARKET, BY END USE (USD BILLION)

9.1. Oil and Gas

9.2. Construction

9.3. Environmental

9.4. Mining

10. DRILLING FLUIDS MARKET, BY REGIONAL (USD BILLION)

10.1. North America

10.1.1. US

10.1.2. Canada

10.2. Europe

10.2.1. Germany

10.2.2. UK

10.2.3. France

10.2.4. Russia

10.2.5. Italy

10.2.6. Spain

10.2.7. Rest of Europe

10.3. APAC

10.3.1. China

10.3.2. India

10.3.3. Japan

10.3.4. South Korea

10.3.5. Malaysia

10.3.6. Thailand

10.3.7. Indonesia

10.3.8. Rest of APAC

10.4. South America

10.4.1. Brazil

10.4.2. Mexico

10.4.3. Argentina

10.4.4. Rest of South America

10.5. MEA

10.5.1. GCC Countries

10.5.2. South Africa

10.5.3. Rest of MEA

11. COMPETITIVE LANDSCAPE

11.1. Overview

11.2. Competitive Analysis

11.3. Market share Analysis

11.4. Major Growth Strategy in the Drilling Fluids Market

11.5. Competitive Benchmarking

11.6. Leading Players in Terms of Number of Developments in the Drilling Fluids Market

11.7. Key developments and growth strategies

11.7.1. New Product Launch/Service Deployment

11.7.2. Merger & Acquisitions

11.7.3. Joint Ventures

11.8. Major Players Financial Matrix

11.8.1. Sales and Operating Income

11.8.2. Major Players R&D Expenditure. 2023

12. COMPANY PROFILES

12.1. Weatherford International

12.1.1. Financial Overview

12.1.2. Products Offered

12.1.3. Key Developments

12.1.4. SWOT Analysis

12.1.5. Key Strategies

12.2. MI SWACO

12.2.1. Financial Overview

12.2.2. Products Offered

12.2.3. Key Developments

12.2.4. SWOT Analysis

12.2.5. Key Strategies

12.3. Baker Hughes

12.3.1. Financial Overview

12.3.2. Products Offered

12.3.3. Key Developments

12.3.4. SWOT Analysis

12.3.5. Key Strategies

12.4. Schlumberger

12.4.1. Financial Overview

12.4.2. Products Offered

12.4.3. Key Developments

12.4.4. SWOT Analysis

12.4.5. Key Strategies

12.5. Intecsea

12.5.1. Financial Overview

12.5.2. Products Offered

12.5.3. Key Developments

12.5.4. SWOT Analysis

12.5.5. Key Strategies

12.6. Geoservices

12.6.1. Financial Overview

12.6.2. Products Offered

12.6.3. Key Developments

12.6.4. SWOT Analysis

12.6.5. Key Strategies

12.7. Petrochemical Energy

12.7.1. Financial Overview

12.7.2. Products Offered

12.7.3. Key Developments

12.7.4. SWOT Analysis

12.7.5. Key Strategies

12.8. Bristol Oil

12.8.1. Financial Overview

12.8.2. Products Offered

12.8.3. Key Developments

12.8.4. SWOT Analysis

12.8.5. Key Strategies

12.9. Newpark Resources

12.9.1. Financial Overview

12.9.2. Products Offered

12.9.3. Key Developments

12.9.4. SWOT Analysis

12.9.5. Key Strategies

12.10. Halliburton

12.10.1. Financial Overview

12.10.2. Products Offered

12.10.3. Key Developments

12.10.4. SWOT Analysis

12.10.5. Key Strategies

12.11. National Oilwell Varco

12.11.1. Financial Overview

12.11.2. Products Offered

12.11.3. Key Developments

12.11.4. SWOT Analysis

12.11.5. Key Strategies

12.12. Baroid Industrial

12.12.1. Financial Overview

12.12.2. Products Offered

12.12.3. Key Developments

12.12.4. SWOT Analysis

12.12.5. Key Strategies

12.13. Agnity

12.13.1. Financial Overview

12.13.2. Products Offered

12.13.3. Key Developments

12.13.4. SWOT Analysis

12.13.5. Key Strategies

12.14. Tetra Technologies

12.14.1. Financial Overview

12.14.2. Products Offered

12.14.3. Key Developments

12.14.4. SWOT Analysis

12.14.5. Key Strategies

12.15. Cimarex Energy

12.15.1. Financial Overview

12.15.2. Products Offered

12.15.3. Key Developments

12.15.4. SWOT Analysis

12.15.5. Key Strategies

13. APPENDIX

13.1. References

13.2. Related Reports

LIST OF TABLES

TABLE 1. LIST OF ASSUMPTIONS

TABLE 2. NORTH AMERICA MARKET SIZE ESTIMATES & FORECAST, BY TYPE, 2019-2035 (USD BILLIONS)

TABLE 3. NORTH AMERICA MARKET SIZE ESTIMATES & FORECAST, BY APPLICATION, 2019-2035 (USD BILLIONS)

TABLE 4. NORTH AMERICA MARKET SIZE ESTIMATES & FORECAST, BY FUNCTION, 2019-2035 (USD BILLIONS)

TABLE 5. NORTH AMERICA MARKET SIZE ESTIMATES & FORECAST, BY END USE, 2019-2035 (USD BILLIONS)

TABLE 6. NORTH AMERICA MARKET SIZE ESTIMATES & FORECAST, BY REGIONAL, 2019-2035 (USD BILLIONS)

TABLE 7. US MARKET SIZE ESTIMATES & FORECAST, BY TYPE, 2019-2035 (USD BILLIONS)

TABLE 8. US MARKET SIZE ESTIMATES & FORECAST, BY APPLICATION, 2019-2035 (USD BILLIONS)

TABLE 9. US MARKET SIZE ESTIMATES & FORECAST, BY FUNCTION, 2019-2035 (USD BILLIONS)

TABLE 10. US MARKET SIZE ESTIMATES & FORECAST, BY END USE, 2019-2035 (USD BILLIONS)

TABLE 11. US MARKET SIZE ESTIMATES & FORECAST, BY REGIONAL, 2019-2035 (USD BILLIONS)

TABLE 12. CANADA MARKET SIZE ESTIMATES & FORECAST, BY TYPE, 2019-2035 (USD BILLIONS)

TABLE 13. CANADA MARKET SIZE ESTIMATES & FORECAST, BY APPLICATION, 2019-2035 (USD BILLIONS)

TABLE 14. CANADA MARKET SIZE ESTIMATES & FORECAST, BY FUNCTION, 2019-2035 (USD BILLIONS)

TABLE 15. CANADA MARKET SIZE ESTIMATES & FORECAST, BY END USE, 2019-2035 (USD BILLIONS)

TABLE 16. CANADA MARKET SIZE ESTIMATES & FORECAST, BY REGIONAL, 2019-2035 (USD BILLIONS)

TABLE 17. EUROPE MARKET SIZE ESTIMATES & FORECAST, BY TYPE, 2019-2035 (USD BILLIONS)

TABLE 18. EUROPE MARKET SIZE ESTIMATES & FORECAST, BY APPLICATION, 2019-2035 (USD BILLIONS)

TABLE 19. EUROPE MARKET SIZE ESTIMATES & FORECAST, BY FUNCTION, 2019-2035 (USD BILLIONS)

TABLE 20. EUROPE MARKET SIZE ESTIMATES & FORECAST, BY END USE, 2019-2035 (USD BILLIONS)

TABLE 21. EUROPE MARKET SIZE ESTIMATES & FORECAST, BY REGIONAL, 2019-2035 (USD BILLIONS)

TABLE 22. GERMANY MARKET SIZE ESTIMATES & FORECAST, BY TYPE, 2019-2035 (USD BILLIONS)

TABLE 23. GERMANY MARKET SIZE ESTIMATES & FORECAST, BY APPLICATION, 2019-2035 (USD BILLIONS)

TABLE 24. GERMANY MARKET SIZE ESTIMATES & FORECAST, BY FUNCTION, 2019-2035 (USD BILLIONS)

TABLE 25. GERMANY MARKET SIZE ESTIMATES & FORECAST, BY END USE, 2019-2035 (USD BILLIONS)

TABLE 26. GERMANY MARKET SIZE ESTIMATES & FORECAST, BY REGIONAL, 2019-2035 (USD BILLIONS)

TABLE 27. UK MARKET SIZE ESTIMATES & FORECAST, BY TYPE, 2019-2035 (USD BILLIONS)

TABLE 28. UK MARKET SIZE ESTIMATES & FORECAST, BY APPLICATION, 2019-2035 (USD BILLIONS)

TABLE 29. UK MARKET SIZE ESTIMATES & FORECAST, BY FUNCTION, 2019-2035 (USD BILLIONS)

TABLE 30. UK MARKET SIZE ESTIMATES & FORECAST, BY END USE, 2019-2035 (USD BILLIONS)

TABLE 31. UK MARKET SIZE ESTIMATES & FORECAST, BY REGIONAL, 2019-2035 (USD BILLIONS)

TABLE 32. FRANCE MARKET SIZE ESTIMATES & FORECAST, BY TYPE, 2019-2035 (USD BILLIONS)

TABLE 33. FRANCE MARKET SIZE ESTIMATES & FORECAST, BY APPLICATION, 2019-2035 (USD BILLIONS)

TABLE 34. FRANCE MARKET SIZE ESTIMATES & FORECAST, BY FUNCTION, 2019-2035 (USD BILLIONS)

TABLE 35. FRANCE MARKET SIZE ESTIMATES & FORECAST, BY END USE, 2019-2035 (USD BILLIONS)

TABLE 36. FRANCE MARKET SIZE ESTIMATES & FORECAST, BY REGIONAL, 2019-2035 (USD BILLIONS)

TABLE 37. RUSSIA MARKET SIZE ESTIMATES & FORECAST, BY TYPE, 2019-2035 (USD BILLIONS)

TABLE 38. RUSSIA MARKET SIZE ESTIMATES & FORECAST, BY APPLICATION, 2019-2035 (USD BILLIONS)

TABLE 39. RUSSIA MARKET SIZE ESTIMATES & FORECAST, BY FUNCTION, 2019-2035 (USD BILLIONS)

TABLE 40. RUSSIA MARKET SIZE ESTIMATES & FORECAST, BY END USE, 2019-2035 (USD BILLIONS)

TABLE 41. RUSSIA MARKET SIZE ESTIMATES & FORECAST, BY REGIONAL, 2019-2035 (USD BILLIONS)

TABLE 42. ITALY MARKET SIZE ESTIMATES & FORECAST, BY TYPE, 2019-2035 (USD BILLIONS)

TABLE 43. ITALY MARKET SIZE ESTIMATES & FORECAST, BY APPLICATION, 2019-2035 (USD BILLIONS)

TABLE 44. ITALY MARKET SIZE ESTIMATES & FORECAST, BY FUNCTION, 2019-2035 (USD BILLIONS)

TABLE 45. ITALY MARKET SIZE ESTIMATES & FORECAST, BY END USE, 2019-2035 (USD BILLIONS)

TABLE 46. ITALY MARKET SIZE ESTIMATES & FORECAST, BY REGIONAL, 2019-2035 (USD BILLIONS)

TABLE 47. SPAIN MARKET SIZE ESTIMATES & FORECAST, BY TYPE, 2019-2035 (USD BILLIONS)

TABLE 48. SPAIN MARKET SIZE ESTIMATES & FORECAST, BY APPLICATION, 2019-2035 (USD BILLIONS)

TABLE 49. SPAIN MARKET SIZE ESTIMATES & FORECAST, BY FUNCTION, 2019-2035 (USD BILLIONS)

TABLE 50. SPAIN MARKET SIZE ESTIMATES & FORECAST, BY END USE, 2019-2035 (USD BILLIONS)

TABLE 51. SPAIN MARKET SIZE ESTIMATES & FORECAST, BY REGIONAL, 2019-2035 (USD BILLIONS)

TABLE 52. REST OF EUROPE MARKET SIZE ESTIMATES & FORECAST, BY TYPE, 2019-2035 (USD BILLIONS)

TABLE 53. REST OF EUROPE MARKET SIZE ESTIMATES & FORECAST, BY APPLICATION, 2019-2035 (USD BILLIONS)

TABLE 54. REST OF EUROPE MARKET SIZE ESTIMATES & FORECAST, BY FUNCTION, 2019-2035 (USD BILLIONS)

TABLE 55. REST OF EUROPE MARKET SIZE ESTIMATES & FORECAST, BY END USE, 2019-2035 (USD BILLIONS)

TABLE 56. REST OF EUROPE MARKET SIZE ESTIMATES & FORECAST, BY REGIONAL, 2019-2035 (USD BILLIONS)

TABLE 57. APAC MARKET SIZE ESTIMATES & FORECAST, BY TYPE, 2019-2035 (USD BILLIONS)

TABLE 58. APAC MARKET SIZE ESTIMATES & FORECAST, BY APPLICATION, 2019-2035 (USD BILLIONS)

TABLE 59. APAC MARKET SIZE ESTIMATES & FORECAST, BY FUNCTION, 2019-2035 (USD BILLIONS)

TABLE 60. APAC MARKET SIZE ESTIMATES & FORECAST, BY END USE, 2019-2035 (USD BILLIONS)

TABLE 61. APAC MARKET SIZE ESTIMATES & FORECAST, BY REGIONAL, 2019-2035 (USD BILLIONS)

TABLE 62. CHINA MARKET SIZE ESTIMATES & FORECAST, BY TYPE, 2019-2035 (USD BILLIONS)

TABLE 63. CHINA MARKET SIZE ESTIMATES & FORECAST, BY APPLICATION, 2019-2035 (USD BILLIONS)

TABLE 64. CHINA MARKET SIZE ESTIMATES & FORECAST, BY FUNCTION, 2019-2035 (USD BILLIONS)

TABLE 65. CHINA MARKET SIZE ESTIMATES & FORECAST, BY END USE, 2019-2035 (USD BILLIONS)

TABLE 66. CHINA MARKET SIZE ESTIMATES & FORECAST, BY REGIONAL, 2019-2035 (USD BILLIONS)

TABLE 67. INDIA MARKET SIZE ESTIMATES & FORECAST, BY TYPE, 2019-2035 (USD BILLIONS)

TABLE 68. INDIA MARKET SIZE ESTIMATES & FORECAST, BY APPLICATION, 2019-2035 (USD BILLIONS)

TABLE 69. INDIA MARKET SIZE ESTIMATES & FORECAST, BY FUNCTION, 2019-2035 (USD BILLIONS)

TABLE 70. INDIA MARKET SIZE ESTIMATES & FORECAST, BY END USE, 2019-2035 (USD BILLIONS)

TABLE 71. INDIA MARKET SIZE ESTIMATES & FORECAST, BY REGIONAL, 2019-2035 (USD BILLIONS)

TABLE 72. JAPAN MARKET SIZE ESTIMATES & FORECAST, BY TYPE, 2019-2035 (USD BILLIONS)

TABLE 73. JAPAN MARKET SIZE ESTIMATES & FORECAST, BY APPLICATION, 2019-2035 (USD BILLIONS)

TABLE 74. JAPAN MARKET SIZE ESTIMATES & FORECAST, BY FUNCTION, 2019-2035 (USD BILLIONS)

TABLE 75. JAPAN MARKET SIZE ESTIMATES & FORECAST, BY END USE, 2019-2035 (USD BILLIONS)

TABLE 76. JAPAN MARKET SIZE ESTIMATES & FORECAST, BY REGIONAL, 2019-2035 (USD BILLIONS)

TABLE 77. SOUTH KOREA MARKET SIZE ESTIMATES & FORECAST, BY TYPE, 2019-2035 (USD BILLIONS)

TABLE 78. SOUTH KOREA MARKET SIZE ESTIMATES & FORECAST, BY APPLICATION, 2019-2035 (USD BILLIONS)

TABLE 79. SOUTH KOREA MARKET SIZE ESTIMATES & FORECAST, BY FUNCTION, 2019-2035 (USD BILLIONS)

TABLE 80. SOUTH KOREA MARKET SIZE ESTIMATES & FORECAST, BY END USE, 2019-2035 (USD BILLIONS)

TABLE 81. SOUTH KOREA MARKET SIZE ESTIMATES & FORECAST, BY REGIONAL, 2019-2035 (USD BILLIONS)

TABLE 82. MALAYSIA MARKET SIZE ESTIMATES & FORECAST, BY TYPE, 2019-2035 (USD BILLIONS)

TABLE 83. MALAYSIA MARKET SIZE ESTIMATES & FORECAST, BY APPLICATION, 2019-2035 (USD BILLIONS)

TABLE 84. MALAYSIA MARKET SIZE ESTIMATES & FORECAST, BY FUNCTION, 2019-2035 (USD BILLIONS)

TABLE 85. MALAYSIA MARKET SIZE ESTIMATES & FORECAST, BY END USE, 2019-2035 (USD BILLIONS)

TABLE 86. MALAYSIA MARKET SIZE ESTIMATES & FORECAST, BY REGIONAL, 2019-2035 (USD BILLIONS)

TABLE 87. THAILAND MARKET SIZE ESTIMATES & FORECAST, BY TYPE, 2019-2035 (USD BILLIONS)

TABLE 88. THAILAND MARKET SIZE ESTIMATES & FORECAST, BY APPLICATION, 2019-2035 (USD BILLIONS)

TABLE 89. THAILAND MARKET SIZE ESTIMATES & FORECAST, BY FUNCTION, 2019-2035 (USD BILLIONS)

TABLE 90. THAILAND MARKET SIZE ESTIMATES & FORECAST, BY END USE, 2019-2035 (USD BILLIONS)

TABLE 91. THAILAND MARKET SIZE ESTIMATES & FORECAST, BY REGIONAL, 2019-2035 (USD BILLIONS)

TABLE 92. INDONESIA MARKET SIZE ESTIMATES & FORECAST, BY TYPE, 2019-2035 (USD BILLIONS)

TABLE 93. INDONESIA MARKET SIZE ESTIMATES & FORECAST, BY APPLICATION, 2019-2035 (USD BILLIONS)

TABLE 94. INDONESIA MARKET SIZE ESTIMATES & FORECAST, BY FUNCTION, 2019-2035 (USD BILLIONS)

TABLE 95. INDONESIA MARKET SIZE ESTIMATES & FORECAST, BY END USE, 2019-2035 (USD BILLIONS)

TABLE 96. INDONESIA MARKET SIZE ESTIMATES & FORECAST, BY REGIONAL, 2019-2035 (USD BILLIONS)

TABLE 97. REST OF APAC MARKET SIZE ESTIMATES & FORECAST, BY TYPE, 2019-2035 (USD BILLIONS)

TABLE 98. REST OF APAC MARKET SIZE ESTIMATES & FORECAST, BY APPLICATION, 2019-2035 (USD BILLIONS)

TABLE 99. REST OF APAC MARKET SIZE ESTIMATES & FORECAST, BY FUNCTION, 2019-2035 (USD BILLIONS)

TABLE 100. REST OF APAC MARKET SIZE ESTIMATES & FORECAST, BY END USE, 2019-2035 (USD BILLIONS)

TABLE 101. REST OF APAC MARKET SIZE ESTIMATES & FORECAST, BY REGIONAL, 2019-2035 (USD BILLIONS)

TABLE 102. SOUTH AMERICA MARKET SIZE ESTIMATES & FORECAST, BY TYPE, 2019-2035 (USD BILLIONS)

TABLE 103. SOUTH AMERICA MARKET SIZE ESTIMATES & FORECAST, BY APPLICATION, 2019-2035 (USD BILLIONS)

TABLE 104. SOUTH AMERICA MARKET SIZE ESTIMATES & FORECAST, BY FUNCTION, 2019-2035 (USD BILLIONS)

TABLE 105. SOUTH AMERICA MARKET SIZE ESTIMATES & FORECAST, BY END USE, 2019-2035 (USD BILLIONS)

TABLE 106. SOUTH AMERICA MARKET SIZE ESTIMATES & FORECAST, BY REGIONAL, 2019-2035 (USD BILLIONS)

TABLE 107. BRAZIL MARKET SIZE ESTIMATES & FORECAST, BY TYPE, 2019-2035 (USD BILLIONS)

TABLE 108. BRAZIL MARKET SIZE ESTIMATES & FORECAST, BY APPLICATION, 2019-2035 (USD BILLIONS)

TABLE 109. BRAZIL MARKET SIZE ESTIMATES & FORECAST, BY FUNCTION, 2019-2035 (USD BILLIONS)

TABLE 110. BRAZIL MARKET SIZE ESTIMATES & FORECAST, BY END USE, 2019-2035 (USD BILLIONS)

TABLE 111. BRAZIL MARKET SIZE ESTIMATES & FORECAST, BY REGIONAL, 2019-2035 (USD BILLIONS)

TABLE 112. MEXICO MARKET SIZE ESTIMATES & FORECAST, BY TYPE, 2019-2035 (USD BILLIONS)

TABLE 113. MEXICO MARKET SIZE ESTIMATES & FORECAST, BY APPLICATION, 2019-2035 (USD BILLIONS)

TABLE 114. MEXICO MARKET SIZE ESTIMATES & FORECAST, BY FUNCTION, 2019-2035 (USD BILLIONS)

TABLE 115. MEXICO MARKET SIZE ESTIMATES & FORECAST, BY END USE, 2019-2035 (USD BILLIONS)

TABLE 116. MEXICO MARKET SIZE ESTIMATES & FORECAST, BY REGIONAL, 2019-2035 (USD BILLIONS)

TABLE 117. ARGENTINA MARKET SIZE ESTIMATES & FORECAST, BY TYPE, 2019-2035 (USD BILLIONS)

TABLE 118. ARGENTINA MARKET SIZE ESTIMATES & FORECAST, BY APPLICATION, 2019-2035 (USD BILLIONS)

TABLE 119. ARGENTINA MARKET SIZE ESTIMATES & FORECAST, BY FUNCTION, 2019-2035 (USD BILLIONS)

TABLE 120. ARGENTINA MARKET SIZE ESTIMATES & FORECAST, BY END USE, 2019-2035 (USD BILLIONS)

TABLE 121. ARGENTINA MARKET SIZE ESTIMATES & FORECAST, BY REGIONAL, 2019-2035 (USD BILLIONS)

TABLE 122. REST OF SOUTH AMERICA MARKET SIZE ESTIMATES & FORECAST, BY TYPE, 2019-2035 (USD BILLIONS)

TABLE 123. REST OF SOUTH AMERICA MARKET SIZE ESTIMATES & FORECAST, BY APPLICATION, 2019-2035 (USD BILLIONS)

TABLE 124. REST OF SOUTH AMERICA MARKET SIZE ESTIMATES & FORECAST, BY FUNCTION, 2019-2035 (USD BILLIONS)

TABLE 125. REST OF SOUTH AMERICA MARKET SIZE ESTIMATES & FORECAST, BY END USE, 2019-2035 (USD BILLIONS)

TABLE 126. REST OF SOUTH AMERICA MARKET SIZE ESTIMATES & FORECAST, BY REGIONAL, 2019-2035 (USD BILLIONS)

TABLE 127. MEA MARKET SIZE ESTIMATES & FORECAST, BY TYPE, 2019-2035 (USD BILLIONS)

TABLE 128. MEA MARKET SIZE ESTIMATES & FORECAST, BY APPLICATION, 2019-2035 (USD BILLIONS)

TABLE 129. MEA MARKET SIZE ESTIMATES & FORECAST, BY FUNCTION, 2019-2035 (USD BILLIONS)

TABLE 130. MEA MARKET SIZE ESTIMATES & FORECAST, BY END USE, 2019-2035 (USD BILLIONS)

TABLE 131. MEA MARKET SIZE ESTIMATES & FORECAST, BY REGIONAL, 2019-2035 (USD BILLIONS)

TABLE 132. GCC COUNTRIES MARKET SIZE ESTIMATES & FORECAST, BY TYPE, 2019-2035 (USD BILLIONS)

TABLE 133. GCC COUNTRIES MARKET SIZE ESTIMATES & FORECAST, BY APPLICATION, 2019-2035 (USD BILLIONS)

TABLE 134. GCC COUNTRIES MARKET SIZE ESTIMATES & FORECAST, BY FUNCTION, 2019-2035 (USD BILLIONS)

TABLE 135. GCC COUNTRIES MARKET SIZE ESTIMATES & FORECAST, BY END USE, 2019-2035 (USD BILLIONS)

TABLE 136. GCC COUNTRIES MARKET SIZE ESTIMATES & FORECAST, BY REGIONAL, 2019-2035 (USD BILLIONS)

TABLE 137. SOUTH AFRICA MARKET SIZE ESTIMATES & FORECAST, BY TYPE, 2019-2035 (USD BILLIONS)

TABLE 138. SOUTH AFRICA MARKET SIZE ESTIMATES & FORECAST, BY APPLICATION, 2019-2035 (USD BILLIONS)

TABLE 139. SOUTH AFRICA MARKET SIZE ESTIMATES & FORECAST, BY FUNCTION, 2019-2035 (USD BILLIONS)

TABLE 140. SOUTH AFRICA MARKET SIZE ESTIMATES & FORECAST, BY END USE, 2019-2035 (USD BILLIONS)

TABLE 141. SOUTH AFRICA MARKET SIZE ESTIMATES & FORECAST, BY REGIONAL, 2019-2035 (USD BILLIONS)

TABLE 142. REST OF MEA MARKET SIZE ESTIMATES & FORECAST, BY TYPE, 2019-2035 (USD BILLIONS)

TABLE 143. REST OF MEA MARKET SIZE ESTIMATES & FORECAST, BY APPLICATION, 2019-2035 (USD BILLIONS)

TABLE 144. REST OF MEA MARKET SIZE ESTIMATES & FORECAST, BY FUNCTION, 2019-2035 (USD BILLIONS)

TABLE 145. REST OF MEA MARKET SIZE ESTIMATES & FORECAST, BY END USE, 2019-2035 (USD BILLIONS)

TABLE 146. REST OF MEA MARKET SIZE ESTIMATES & FORECAST, BY REGIONAL, 2019-2035 (USD BILLIONS)

TABLE 147. PRODUCT LAUNCH/PRODUCT DEVELOPMENT/APPROVAL

TABLE 148. ACQUISITION/PARTNERSHIP

LIST OF FIGURES

FIGURE 1. MARKET SYNOPSIS

FIGURE 2. NORTH AMERICA MARKET ANALYSIS

FIGURE 3. US MARKET ANALYSIS BY TYPE

FIGURE 4. US MARKET ANALYSIS BY APPLICATION

FIGURE 5. US MARKET ANALYSIS BY FUNCTION

FIGURE 6. US MARKET ANALYSIS BY END USE

FIGURE 7. US MARKET ANALYSIS BY REGIONAL

FIGURE 8. CANADA MARKET ANALYSIS BY TYPE

FIGURE 9. CANADA MARKET ANALYSIS BY APPLICATION

FIGURE 10. CANADA MARKET ANALYSIS BY FUNCTION

FIGURE 11. CANADA MARKET ANALYSIS BY END USE

FIGURE 12. CANADA MARKET ANALYSIS BY REGIONAL

FIGURE 13. EUROPE MARKET ANALYSIS

FIGURE 14. GERMANY MARKET ANALYSIS BY TYPE

FIGURE 15. GERMANY MARKET ANALYSIS BY APPLICATION

FIGURE 16. GERMANY MARKET ANALYSIS BY FUNCTION

FIGURE 17. GERMANY MARKET ANALYSIS BY END USE

FIGURE 18. GERMANY MARKET ANALYSIS BY REGIONAL

FIGURE 19. UK MARKET ANALYSIS BY TYPE

FIGURE 20. UK MARKET ANALYSIS BY APPLICATION

FIGURE 21. UK MARKET ANALYSIS BY FUNCTION

FIGURE 22. UK MARKET ANALYSIS BY END USE

FIGURE 23. UK MARKET ANALYSIS BY REGIONAL

FIGURE 24. FRANCE MARKET ANALYSIS BY TYPE

FIGURE 25. FRANCE MARKET ANALYSIS BY APPLICATION

FIGURE 26. FRANCE MARKET ANALYSIS BY FUNCTION

FIGURE 27. FRANCE MARKET ANALYSIS BY END USE

FIGURE 28. FRANCE MARKET ANALYSIS BY REGIONAL

FIGURE 29. RUSSIA MARKET ANALYSIS BY TYPE

FIGURE 30. RUSSIA MARKET ANALYSIS BY APPLICATION

FIGURE 31. RUSSIA MARKET ANALYSIS BY FUNCTION

FIGURE 32. RUSSIA MARKET ANALYSIS BY END USE

FIGURE 33. RUSSIA MARKET ANALYSIS BY REGIONAL

FIGURE 34. ITALY MARKET ANALYSIS BY TYPE

FIGURE 35. ITALY MARKET ANALYSIS BY APPLICATION

FIGURE 36. ITALY MARKET ANALYSIS BY FUNCTION

FIGURE 37. ITALY MARKET ANALYSIS BY END USE

FIGURE 38. ITALY MARKET ANALYSIS BY REGIONAL

FIGURE 39. SPAIN MARKET ANALYSIS BY TYPE

FIGURE 40. SPAIN MARKET ANALYSIS BY APPLICATION

FIGURE 41. SPAIN MARKET ANALYSIS BY FUNCTION

FIGURE 42. SPAIN MARKET ANALYSIS BY END USE

FIGURE 43. SPAIN MARKET ANALYSIS BY REGIONAL

FIGURE 44. REST OF EUROPE MARKET ANALYSIS BY TYPE

FIGURE 45. REST OF EUROPE MARKET ANALYSIS BY APPLICATION

FIGURE 46. REST OF EUROPE MARKET ANALYSIS BY FUNCTION

FIGURE 47. REST OF EUROPE MARKET ANALYSIS BY END USE

FIGURE 48. REST OF EUROPE MARKET ANALYSIS BY REGIONAL

FIGURE 49. APAC MARKET ANALYSIS

FIGURE 50. CHINA MARKET ANALYSIS BY TYPE

FIGURE 51. CHINA MARKET ANALYSIS BY APPLICATION

FIGURE 52. CHINA MARKET ANALYSIS BY FUNCTION

FIGURE 53. CHINA MARKET ANALYSIS BY END USE

FIGURE 54. CHINA MARKET ANALYSIS BY REGIONAL

FIGURE 55. INDIA MARKET ANALYSIS BY TYPE

FIGURE 56. INDIA MARKET ANALYSIS BY APPLICATION

FIGURE 57. INDIA MARKET ANALYSIS BY FUNCTION

FIGURE 58. INDIA MARKET ANALYSIS BY END USE

FIGURE 59. INDIA MARKET ANALYSIS BY REGIONAL

FIGURE 60. JAPAN MARKET ANALYSIS BY TYPE

FIGURE 61. JAPAN MARKET ANALYSIS BY APPLICATION

FIGURE 62. JAPAN MARKET ANALYSIS BY FUNCTION

FIGURE 63. JAPAN MARKET ANALYSIS BY END USE

FIGURE 64. JAPAN MARKET ANALYSIS BY REGIONAL

FIGURE 65. SOUTH KOREA MARKET ANALYSIS BY TYPE

FIGURE 66. SOUTH KOREA MARKET ANALYSIS BY APPLICATION

FIGURE 67. SOUTH KOREA MARKET ANALYSIS BY FUNCTION

FIGURE 68. SOUTH KOREA MARKET ANALYSIS BY END USE

FIGURE 69. SOUTH KOREA MARKET ANALYSIS BY REGIONAL

FIGURE 70. MALAYSIA MARKET ANALYSIS BY TYPE

FIGURE 71. MALAYSIA MARKET ANALYSIS BY APPLICATION

FIGURE 72. MALAYSIA MARKET ANALYSIS BY FUNCTION

FIGURE 73. MALAYSIA MARKET ANALYSIS BY END USE

FIGURE 74. MALAYSIA MARKET ANALYSIS BY REGIONAL

FIGURE 75. THAILAND MARKET ANALYSIS BY TYPE

FIGURE 76. THAILAND MARKET ANALYSIS BY APPLICATION

FIGURE 77. THAILAND MARKET ANALYSIS BY FUNCTION

FIGURE 78. THAILAND MARKET ANALYSIS BY END USE

FIGURE 79. THAILAND MARKET ANALYSIS BY REGIONAL

FIGURE 80. INDONESIA MARKET ANALYSIS BY TYPE

FIGURE 81. INDONESIA MARKET ANALYSIS BY APPLICATION

FIGURE 82. INDONESIA MARKET ANALYSIS BY FUNCTION

FIGURE 83. INDONESIA MARKET ANALYSIS BY END USE

FIGURE 84. INDONESIA MARKET ANALYSIS BY REGIONAL

FIGURE 85. REST OF APAC MARKET ANALYSIS BY TYPE

FIGURE 86. REST OF APAC MARKET ANALYSIS BY APPLICATION

FIGURE 87. REST OF APAC MARKET ANALYSIS BY FUNCTION

FIGURE 88. REST OF APAC MARKET ANALYSIS BY END USE

FIGURE 89. REST OF APAC MARKET ANALYSIS BY REGIONAL

FIGURE 90. SOUTH AMERICA MARKET ANALYSIS

FIGURE 91. BRAZIL MARKET ANALYSIS BY TYPE

FIGURE 92. BRAZIL MARKET ANALYSIS BY APPLICATION

FIGURE 93. BRAZIL MARKET ANALYSIS BY FUNCTION

FIGURE 94. BRAZIL MARKET ANALYSIS BY END USE

FIGURE 95. BRAZIL MARKET ANALYSIS BY REGIONAL

FIGURE 96. MEXICO MARKET ANALYSIS BY TYPE

FIGURE 97. MEXICO MARKET ANALYSIS BY APPLICATION

FIGURE 98. MEXICO MARKET ANALYSIS BY FUNCTION

FIGURE 99. MEXICO MARKET ANALYSIS BY END USE

FIGURE 100. MEXICO MARKET ANALYSIS BY REGIONAL

FIGURE 101. ARGENTINA MARKET ANALYSIS BY TYPE

FIGURE 102. ARGENTINA MARKET ANALYSIS BY APPLICATION

FIGURE 103. ARGENTINA MARKET ANALYSIS BY FUNCTION

FIGURE 104. ARGENTINA MARKET ANALYSIS BY END USE

FIGURE 105. ARGENTINA MARKET ANALYSIS BY REGIONAL

FIGURE 106. REST OF SOUTH AMERICA MARKET ANALYSIS BY TYPE

FIGURE 107. REST OF SOUTH AMERICA MARKET ANALYSIS BY APPLICATION

FIGURE 108. REST OF SOUTH AMERICA MARKET ANALYSIS BY FUNCTION

FIGURE 109. REST OF SOUTH AMERICA MARKET ANALYSIS BY END USE

FIGURE 110. REST OF SOUTH AMERICA MARKET ANALYSIS BY REGIONAL

FIGURE 111. MEA MARKET ANALYSIS

FIGURE 112. GCC COUNTRIES MARKET ANALYSIS BY TYPE

FIGURE 113. GCC COUNTRIES MARKET ANALYSIS BY APPLICATION

FIGURE 114. GCC COUNTRIES MARKET ANALYSIS BY FUNCTION

FIGURE 115. GCC COUNTRIES MARKET ANALYSIS BY END USE

FIGURE 116. GCC COUNTRIES MARKET ANALYSIS BY REGIONAL

FIGURE 117. SOUTH AFRICA MARKET ANALYSIS BY TYPE

FIGURE 118. SOUTH AFRICA MARKET ANALYSIS BY APPLICATION

FIGURE 119. SOUTH AFRICA MARKET ANALYSIS BY FUNCTION

FIGURE 120. SOUTH AFRICA MARKET ANALYSIS BY END USE

FIGURE 121. SOUTH AFRICA MARKET ANALYSIS BY REGIONAL

FIGURE 122. REST OF MEA MARKET ANALYSIS BY TYPE

FIGURE 123. REST OF MEA MARKET ANALYSIS BY APPLICATION

FIGURE 124. REST OF MEA MARKET ANALYSIS BY FUNCTION

FIGURE 125. REST OF MEA MARKET ANALYSIS BY END USE

FIGURE 126. REST OF MEA MARKET ANALYSIS BY REGIONAL

FIGURE 127. KEY BUYING CRITERIA OF DRILLING FLUIDS MARKET

FIGURE 128. RESEARCH PROCESS OF MRFR

FIGURE 129. DRO ANALYSIS OF DRILLING FLUIDS MARKET

FIGURE 130. DRIVERS IMPACT ANALYSIS: DRILLING FLUIDS MARKET

FIGURE 131. RESTRAINTS IMPACT ANALYSIS: DRILLING FLUIDS MARKET

FIGURE 132. SUPPLY / VALUE CHAIN: DRILLING FLUIDS MARKET

FIGURE 133. DRILLING FLUIDS MARKET, BY TYPE, 2025 (% SHARE)

FIGURE 134. DRILLING FLUIDS MARKET, BY TYPE, 2019 TO 2035 (USD Billions)

FIGURE 135. DRILLING FLUIDS MARKET, BY APPLICATION, 2025 (% SHARE)

FIGURE 136. DRILLING FLUIDS MARKET, BY APPLICATION, 2019 TO 2035 (USD Billions)

FIGURE 137. DRILLING FLUIDS MARKET, BY FUNCTION, 2025 (% SHARE)

FIGURE 138. DRILLING FLUIDS MARKET, BY FUNCTION, 2019 TO 2035 (USD Billions)

FIGURE 139. DRILLING FLUIDS MARKET, BY END USE, 2025 (% SHARE)

FIGURE 140. DRILLING FLUIDS MARKET, BY END USE, 2019 TO 2035 (USD Billions)

FIGURE 141. DRILLING FLUIDS MARKET, BY REGIONAL, 2025 (% SHARE)

FIGURE 142. DRILLING FLUIDS MARKET, BY REGIONAL, 2019 TO 2035 (USD Billions)

FIGURE 143. BENCHMARKING OF MAJOR COMPETITORS

Leading companies partner with us for data-driven Insights.

clients

Kindly complete the form below to receive a free sample of this Report

We do not share your information with anyone. However, we may send you emails based on your report interest from time to time. You may contact us at any time to opt-out.

Tailored for You
  • Dedicated Research on any specifics segment or region.
  • Focused Research on specific players in the market.
  • Custom Report based only on your requirements.
  • Flexibility to add or subtract any chapter in the study.
  • Historic data from 2014 and forecasts outlook till 2040.
  • Flexibility of providing data/insights in formats (PDF, PPT, Excel).
  • Provide cross segmentation in applicable scenario/markets.
report-img