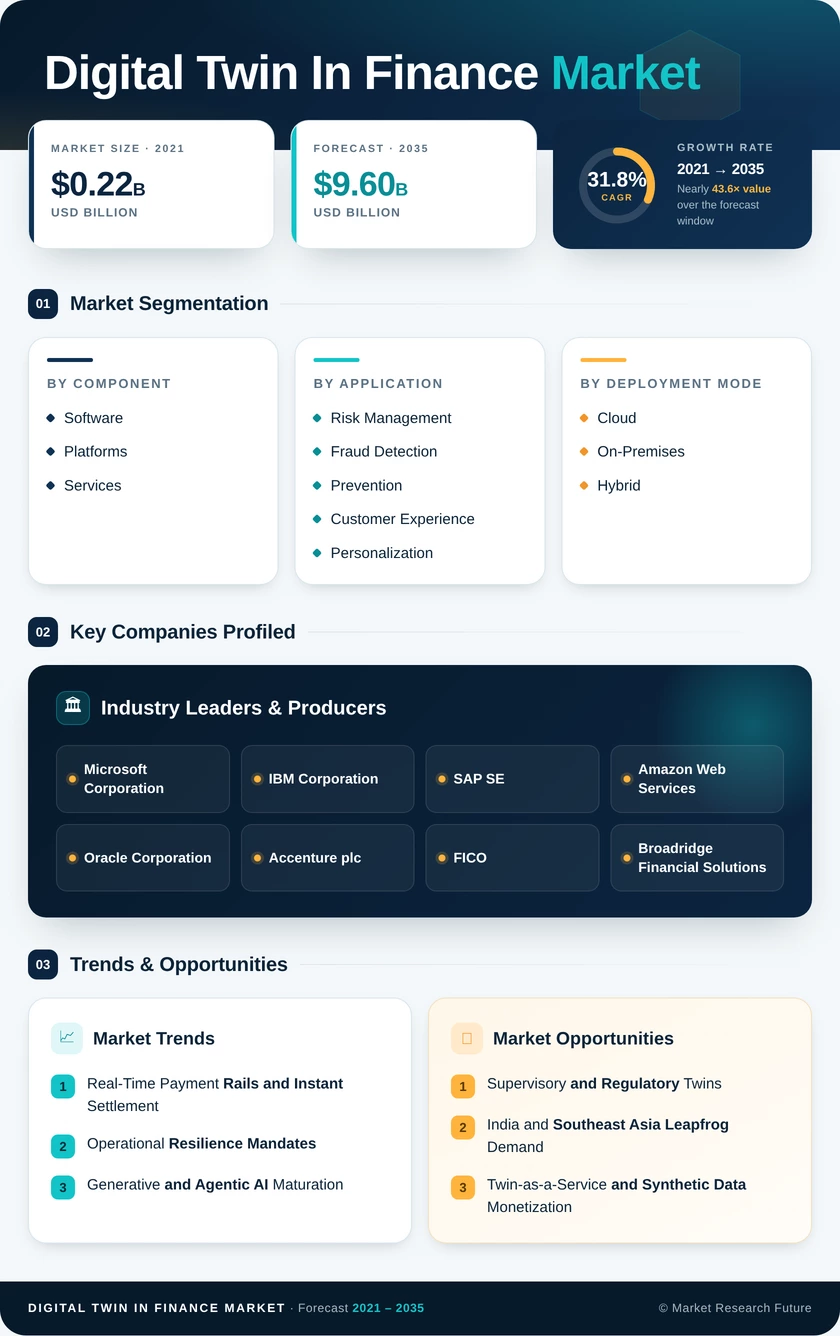
Digital Twin In Finance Market (2026 – 2035)

ID: MRFR/ICT/29959-HCR 128 Pages Kiran Jinkalwad Last Updated: October 17, 2026
Digital Twin In Finance Market Size, Share and Research Report By Component (Software, Platforms, Services), By Application (Risk Management, Fraud Detection and Prevention, Customer Experience and Personalization, Process Automation and Optimization, Compliance and Regulatory Reporting), By Deployment Mode (Cloud, On-Premises, Hybrid), By Organisation Size (Large Enterprises, Small and Medium-Sized Enterprises), By End-User Industry (Banking, Insurance, Asset Management, Fintech and Payments, Capital Markets and Investment Banking) and By Regional (North America, Europe, Asia-Pacific, South America, Middle East & Africa) - Industry Forecast to 2035.
Digital Twin In Finance Market
Market Size
Forecast Period2026-2035
CAGR (2026-2035)31.8%
2025 Market SizeUSD 0.60 Billion
2035 Market SizeUSD 9.60 Billion
Key Players
Microsoft Corporation
IBM Corporation
SAP SE
Amazon Web Services
Oracle Corporation
Accenture plc
Opportunities
  • Supervisory and Regulatory Twins
  • India and Southeast Asia Leapfrog Demand
  • Twin-as-a-Service and Synthetic Data Monetization
  1. 1 Market Summary | |
  2. 2 Key Report Takeaways | |
    1. 2.1 By Component | |
    2. 2.2 By Application | |
    3. 2.3 By Deployment Mode | |
    4. 2.4 By Organisation Size | |
    5. 2.5 By End-User Industry | |
    6. 2.6 By Region | |
  3. 3 Market Size and Forecast (2021–2035) | |
  4. 4 Driver Impact Analysis | |
    1. 4.1 Real-Time Payment Rails and Instant Settlement | |
    2. 4.2 Operational Resilience Mandates | |
    3. 4.3 Generative and Agentic AI Maturation | |
    4. 4.4 Escalating Fraud Losses | |
    5. 4.5 Climate Risk Stress Testing | |
    6. 4.6 Composable Cloud Platforms | |
    7. 4.7 Digital Rail Expansion in Emerging Markets | |
  5. 5 Restraints Impact Analysis | |
    1. 5.1 Legacy Core Systems and Weak Data Lineage | |
    2. 5.2 Model Explainability and AI Regulation | |
    3. 5.3 Cyber and Data-Sovereignty Exposure | |
    4. 5.4 Skills Scarcity | |
    5. 5.5 Cloud and Vendor Concentration Risk | |
  6. 6 Opportunities | |
    1. 6.1 Supervisory and Regulatory Twins | |
    2. 6.2 India and Southeast Asia Leapfrog Demand | |
    3. 6.3 Twin-as-a-Service and Synthetic Data Monetization | |
    4. 6.4 Tokenized Asset and Collateral Twins | |
    5. 6.5 US Treasury Clearing Transition | |
  7. 7 Regional Market Share and Country-Level Analysis | |
    1. 7.1 North America | | |
      1. 7.1.1 US | | |
      2. 7.1.2 Canada | | |
      3. 7.1.3 Mexico | |
    2. 7.2 Europe | | |
      1. 7.2.1 Germany | | |
      2. 7.2.2 UK | | |
      3. 7.2.3 France | | |
      4. 7.2.4 Italy | | |
      5. 7.2.5 Spain | | |
      6. 7.2.6 Nordic Countries | | |
      7. 7.2.7 Russia | | |
      8. 7.2.8 Rest of Europe | |
    3. 7.3 Asia-Pacific | | |
      1. 7.3.1 China | | |
      2. 7.3.2 India | | |
      3. 7.3.3 Japan | | |
      4. 7.3.4 South Korea | | |
      5. 7.3.5 ASEAN | | |
      6. 7.3.6 Rest of Asia-Pacific | |
    4. 7.4 South America | | |
      1. 7.4.1 Brazil | | |
      2. 7.4.2 Argentina | | |
      3. 7.4.3 Rest of South America | |
    5. 7.5 Middle East & Africa | | |
      1. 7.5.1 Saudi Arabia | | |
      2. 7.5.2 UAE | | |
      3. 7.5.3 South Africa | | |
      4. 7.5.4 Egypt | | |
      5. 7.5.5 Rest of MEA | |
  8. 8 Future Outlook (2026–2035) | |
    1. 8.1 Agentic AI and Autonomous Operations | |
    2. 8.2 Platform Economics and Consolidation | |
    3. 8.3 Tokenization and Always-On Settlement | |
    4. 8.4 Climate and Sustainability Risk | |
  9. 9 Segmentation Analysis | |
    1. 9.1 By Component | | |
      1. 9.1.1 Software | | |
      2. 9.1.2 Platforms | | |
      3. 9.1.3 Services | |
    2. 9.2 By Application | | |
      1. 9.2.1 Risk Management | | |
      2. 9.2.2 Fraud Detection and Prevention | | |
      3. 9.2.3 Customer Experience and Personalization | | |
      4. 9.2.4 Process Automation and Optimization | | |
      5. 9.2.5 Compliance and Regulatory Reporting | | |
      6. 9.2.6 Other Applications | |
    3. 9.3 By Deployment Mode | | |
      1. 9.3.1 Cloud | | |
      2. 9.3.2 On-Premises | | |
      3. 9.3.3 Hybrid | |
    4. 9.4 By Organisation Size | | |
      1. 9.4.1 Large Enterprises | | |
      2. 9.4.2 Small and Medium-Sized Enterprises | |
    5. 9.5 By End-User Industry | | |
      1. 9.5.1 Banking | | |
      2. 9.5.2 Insurance | | |
      3. 9.5.3 Asset Management | | |
      4. 9.5.4 Fintech and Payments | | |
      5. 9.5.5 Other End-User Industries | | |
      6. 9.5.6 Capital Markets and Investment Banking | |
  10. 10 Competitive Landscape | |
    1. 10.1 Market Concentration Analysis | |
    2. 10.2 Competitive Benchmarking Matrix | |
    3. 10.3 Company Profiles | | |
      1. 10.3.1 Microsoft Corporation | | |
      2. 10.3.2 IBM Corporation | | |
      3. 10.3.3 SAP SE | | |
      4. 10.3.4 Amazon Web Services | | |
      5. 10.3.5 Oracle Corporation | | |
      6. 10.3.6 Accenture plc | | |
      7. 10.3.7 FICO | | |
      8. 10.3.8 Broadridge Financial Solutions | | |
      9. 10.3.9 Capgemini SE | | |
      10. 10.3.10 Matera | |
  11. 11 Recent News & Developments | |
  12. 12 Report Scope and Methodology | |
  13. 13 Detailed Sources and Citations | |
  14. 14 Frequently Asked Questions (FAQs) | | LIST OF TABLES | |
  15. TABLE 1 Report Summary — Key Market Metrics, 2025–2035 | |
  16. TABLE 2 Global Market Size and Forecast, by Revenue (USD Billion), 2021–2035 | |
  17. TABLE 3 Driver Impact Analysis, 2026–2035 | |
  18. TABLE 4 Restraints Impact Analysis, 2026–2035 | |
  19. TABLE 5 Regional Summary — Market Metrics and Investment Themes, 2025 | |
  20. TABLE 6 North America Market, by Country, 2025–2035 | |
  21. TABLE 7 Europe Market, by Country, 2025–2035 | |
  22. TABLE 8 Asia-Pacific Market, by Country, 2025–2035 | |
  23. TABLE 9 South America Market, by Country, 2025–2035 | |
  24. TABLE 10 Middle East & Africa Market, by Country, 2025–2035 | |
  25. TABLE 11 Global Market, by Component, 2025–2035 | |
  26. TABLE 12 Global Market, by Application, 2025–2035 | |
  27. TABLE 13 Global Market, by Deployment Mode, 2025–2035 | |
  28. TABLE 14 Global Market, by Organisation Size, 2025–2035 | |
  29. TABLE 15 Global Market, by End-User Industry, 2025–2035 | |
  30. TABLE 16 Competitive Benchmarking Matrix, 2025 | |
  31. TABLE 17 Report Scope and Methodology | |
  32. TABLE 18 Detailed Sources and Citations | | LIST OF FIGURES | |
  33. FIGURE 1 Market Dynamics — Drivers, Restraints, and Opportunities | |
  34. FIGURE 2 Industry Value Chain Analysis | |
  35. FIGURE 3 Porter's Five Forces Analysis | |
  36. FIGURE 4 Global Market Size Trend (USD Billion), 2021–2035 | |
  37. FIGURE 5 Year-over-Year Growth Rate, 2022–2035 | |
  38. FIGURE 6 Market Share by Component, 2025 | |
  39. FIGURE 7 Market Share by Application, 2025 | |
  40. FIGURE 8 Market Share by Deployment Mode, 2025 | |
  41. FIGURE 9 Market Share by Organisation Size, 2025 | |
  42. FIGURE 10 Market Share by End-User Industry, 2025 | |
  43. FIGURE 11 Regional Market Share, 2025 | |
  44. FIGURE 12 Regional CAGR Comparison, 2026–2035 | |
  45. FIGURE 13 Competitive Landscape — Estimated Vendor Share Ranges, 2025 | |
  46. FIGURE 14 Competitive Positioning Matrix

Segmentation Quick Reference

DimensionSub-SegmentsDominant SegmentFastest Growing Segment
By ComponentSoftware, Platforms, ServicesSoftware (43.5% share)Platforms (32.8% CAGR)
By ApplicationRisk Management, Fraud Detection and Prevention, Customer Experience and Personalization, Process Automation and Optimization, Compliance and Regulatory Reporting, Other ApplicationsRisk Management (28.2% share)Fraud Detection and Prevention (32.6% CAGR)
By Deployment ModeCloud, On-Premises, HybridCloud (58.4% share)Hybrid (32.9% CAGR)
By Organisation SizeLarge Enterprises, Small and Medium-Sized EnterprisesLarge Enterprises (67.0% share)Small and Medium-Sized Enterprises (32.7% CAGR)
By End-User IndustryBanking, Insurance, Asset Management, Fintech and Payments, Other End-User IndustriesBanking (49.4% share)Fintech and Payments (32.5% CAGR)
By RegionNorth America, Europe, Asia-Pacific, South America, Middle East & AfricaNorth America (38.5% share (2025))Asia-Pacific (35.2% CAGR (2026–2035))


Market Segmentation Overview

By Component

Sub-SegmentKey Trend
SoftwareSimulation engines embedded in risk and process suites
PlatformsComposable microservices with open APIs
ServicesValidation and explainability support under new regulation


Software leads with a 43.5% share because banks first acquired simulation capability inside existing risk and asset-liability suites. Platforms grow fastest at a 32.8% CAGR as buyers prefer shared data layers that let them add liquidity, fraud, and process replicas incrementally. Services track platform uptake, since each new deployment needs process mapping and model documentation.

By Application

Sub-SegmentKey Trend
Risk ManagementContinuous liquidity and capital stress testing
Fraud Detection and PreventionBehavioral profiling for instant payments
Customer Experience and PersonalizationJourney simulation inside mobile apps
Process Automation and OptimizationSame-day reconciliation and settlement
Compliance and Regulatory ReportingAuto-generated supervisory scenario evidence
Other ApplicationsTreasury and trade-finance modelling


Risk Management holds the largest share at 28.2% because stress testing already has established budgets and supervisory mandates. Fraud Detection and Prevention grows fastest at a 32.6% CAGR as instant rails remove the batch windows that manual review relied on. Compliance and Regulatory Reporting twins are gaining traction as DORA evidence requirements take hold.

By Deployment Mode

Sub-SegmentKey Trend
CloudBurst compute for large scenario runs
On-PremisesRetained at proprietary trading desks
HybridLocal personal data with cloud-based computation


Cloud dominates with a 58.4% share because large Monte Carlo and agent-based runs need elastic capacity few banks own. Hybrid grows fastest at a 32.9% CAGR as residency rules in Europe, India, and the Gulf require sensitive data to stay local. On-Premises persists where trading desks reject shared-infrastructure risk.

By Organisation Size

Sub-SegmentKey Trend
Large EnterprisesTwins paired with data-lake and AI buildouts
Small and Medium-Sized EnterprisesTemplate-driven, subscription-priced deployments


Large Enterprises account for 67.0% of spending, as tier-one banks and insurers fold twins into multi-year transformation programs. Small and Medium-Sized Enterprises grow faster at a 32.7% CAGR because pre-built templates and consumption pricing shrink proof-of-concept cycles and remove large licence commitments.

By End-User Industry

Sub-SegmentKey Trend
BankingResilience, liquidity, and credit replicas
InsuranceCatastrophe-loss and pricing twins
Asset ManagementCollateral and portfolio simulation
Fintech and PaymentsMillisecond replicas for 24×7 rails
Other End-User IndustriesMarket infrastructure and credit bureau use


Banking leads with a 49.4% share, reflecting the breadth of its resilience and stress-testing obligations. Fintech and Payments grows fastest at a 32.5% CAGR because instant rails and stablecoin settlement demand real-time replicas of transaction flows. Insurance and Asset Management follow with catastrophe-loss and collateral twins, respectively.




Download PDF ×

We do not share your information with anyone. However, we may send you emails based on your report interest from time to time. You may contact us at any time to opt-out.