info@marketresearchfuture.com   📞 +1 (855) 661-4441(US)   📞 +44 1720 412 167(UK)   📞 +91 2269738890(APAC)
Certified Global Research Member
Isomar 1 Iso 1
Key Questions Answered
  • Global Market Outlook
  • In-depth analysis of global and regional trends
  • Analyze and identify the major players in the market, their market share, key developments, etc.
  • To understand the capability of the major players based on products offered, financials, and strategies.
  • Identify disrupting products, companies, and trends.
  • To identify opportunities in the market.
  • Analyze the key challenges in the market.
  • Analyze the regional penetration of players, products, and services in the market.
  • Comparison of major players financial performance.
  • Evaluate strategies adopted by major players.
  • Recommendations
Why Choose Market Research Future?
  • Vigorous research methodologies for specific market.
  • Knowledge partners across the globe
  • Large network of partner consultants.
  • Ever-increasing/ Escalating data base with quarterly monitoring of various markets
  • Trusted by fortune 500 companies/startups/ universities/organizations
  • Large database of 5000+ markets reports.
  • Effective and prompt pre- and post-sales support.

Digital Twin Market Research Report By Application (Manufacturing, Healthcare, Smart Cities, Automotive, Energy Management), By Technology (IoT-Enabled Digital Twins, AI-Driven Digital Twins, Simulation-Based Digital Twins, Data-Driven Digital Twins), By End Use (B2B, B2C, Government), By Deployment Type (Cloud-Based, On-Premises) and By Regional (North America, Europe, South America, Asia Pacific, Middle East and Africa) - Forecast to 2035


ID: MRFR/ICT/3089-CR | 200 Pages | Author: Aarti Dhapte| July 2025

Digital Twin Market Summary

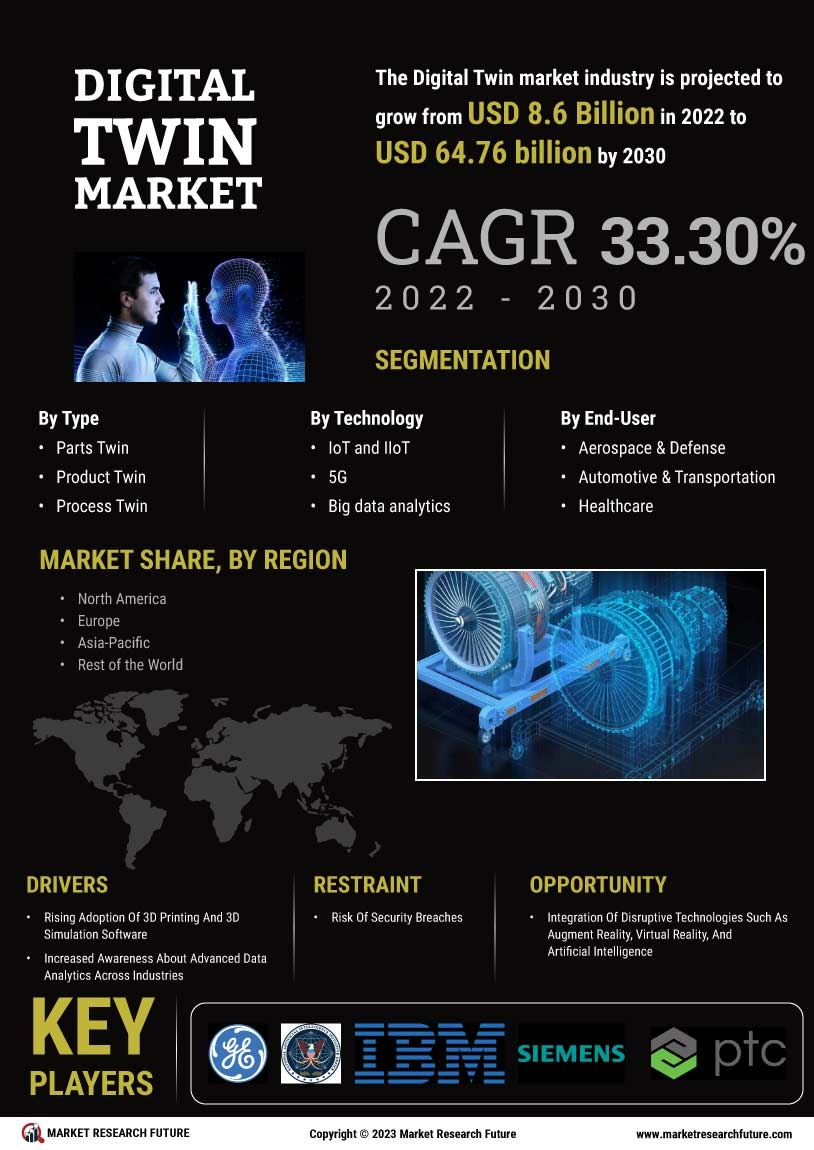
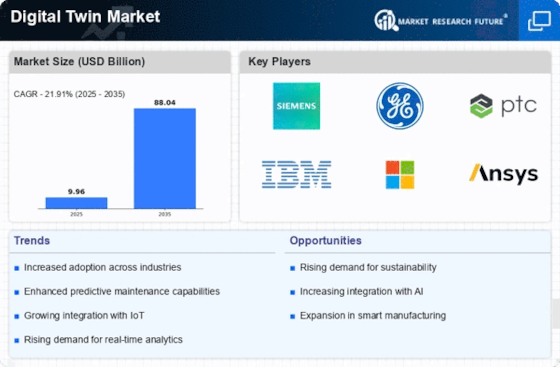
As per Market Research Future analysis, the Digital Twin Market Size was estimated at 8.17 (USD Billion) in 2023.The Digital Twin Market Industry is expected to grow from 9.96 (USD Billion) in 2024 to 88.04 (USD Billion) by 2035. The Digital Twin Market CAGR (growth rate) is expected to be around 21.91% during the forecast period (2025 - 2035). The market is driven by the adoption of Industry 4.0, IoT technologies, and the demand for predictive maintenance across various sectors, including manufacturing, healthcare, and urban development.

Key Market Trends & Highlights

Key trends driving the Digital Twin Market include technological advancements and increased collaboration.

  • Manufacturing sector expected to grow from 3.5 USD Billion in 2024 to 31.5 USD Billion by 2035.
  • Healthcare segment projected to rise from 2.0 USD Billion in 2024 to 19.2 USD Billion by 2035.
  • Smart cities application forecasted to expand from 1.5 USD Billion in 2024 to 13.4 USD Billion by 2035.
  • North America to dominate with a market value of 3.5 USD Billion in 2024, growing to 32.0 USD Billion by 2035.

Market Size & Forecast

2023 Market Size: USD 8.17 Billion
2024 Market Size: USD 9.96 Billion
2035 Market Size: USD 88.04 Billion
CAGR (2025-2035): 21.91%
Largest Regional Market Share in 2024: North America.

Major Players

IBM, NVIDIA, Altair, SAP, Bentley Systems, PTC, Hexagon, Microsoft, Ansys, Emerson, AVEVA, Siemens, Oracle, General Electric.

Key Digital Twin Market Trends Highlighted

The Digital Twin Market is currently undergoing significant market trends, which are being driven by the increasing demand for operational efficiency and technological advancements. Companies are increasingly utilizing digital twin technology to generate virtual replicas of physical assets and systems, which facilitates real-time monitoring and predictive maintenance. Government initiatives that enhance smart manufacturing and urban planning are supporting this transition toward digital transformation, which reflects an increasing emphasis on operational optimization and sustainability. The integration of digital twin applications with Internet of Things (IoT) devices has increased in recent years, thereby enhancing the capacity to collect and analyze data efficiently.

There is a substantial opportunity to investigate the advantages of data-driven decision-making and improved consumer experiences as industries such as healthcare, manufacturing, and urban development invest in digital twin solutions. Enterprises are acknowledging the potential of digital siblings to improve innovation capabilities and increase efficiency. Additionally, the global deployment of digital doppelganger solutions is being facilitated by the expansion of cloud computing services. This accessibility is enabling smaller businesses to capitalize on sophisticated technologies that were previously exclusively accessible to larger corporations.

The growing emphasis on sustainability practices is also generating opportunities to optimize resource utilization through the simulation capabilities of digital twins, thereby supporting global objectives for carbon reduction. The convergence of these factors suggests a dynamic landscape for the digital twin market, with evolving applications and opportunities that are reshaping industries worldwide.

Global Digital Twin Market Overview

Source: Primary Research, Secondary Research, Market Research Future Database, and Analyst Review

Rising Adoption of IoT Technology

The increasing adoption of Internet of Things (IoT) technology is one of the key drivers fueling the growth of the Digital Twin Market Industry. As organizations implement IoT systems, they generate vast amounts of data that can be effectively utilized to create digital twins. According to recent findings, the number of IoT-connected devices worldwide is expected to exceed 50 billion by 2030, showcasing a significant demand for digital twin technology to manage and analyze the incoming data.

Major technology companies such as Siemens and General Electric are leading the charge by incorporating IoT technology into their digital twin platforms, enhancing performance tracking and decision-making processes. This proliferation of IoT devices necessitates advanced analytical tools like digital twins to optimize operational efficiency and predictive maintenance, thereby expanding the Digital Twin Market.

Increased Focus on Predictive Maintenance

Predictive maintenance is emerging as a critical driver in the Digital Twin Market Industry, mainly due to the need for organizations to minimize downtime and maintenance costs. The use of digital twins allows businesses to predict equipment failures before they occur by simulating real-time performance and analyzing historical data. Research from relevant industrial bodies indicates that predictive maintenance can reduce overall maintenance costs by up to 30% and increase operational efficiency by 25%.

Companies like Rolls-Royce have adopted digital twin technology to monitor aircraft engine performance, allowing them to extend service life and improve safety, thereby highlighting the importance of digital twins in modern maintenance strategies.

Growing Demand for Smart Cities

The increasing focus on developing smart cities around the globe is significantly driving the Digital Twin Market Industry. As urban populations continue to grow, cities are faced with challenges related to infrastructure, transportation, and energy management. Digital twins serve as virtual representations of physical assets, allowing city planners and administrators to create efficient systems. It is estimated that by 2050, two-thirds of the world’s population will reside in urban areas, leading to an increased demand for smart technology solutions.

Leading cities such as Barcelona and Singapore have integrated digital twin technologies in urban planning, enabling real-time monitoring and improvements in public services, thus accelerating the growth of the Digital Twin Market.

Enhanced Product Development in Manufacturing

The Digital Twin Market Industry is also experiencing growth due to enhanced product development in the manufacturing sector. Digital twins provide manufacturers with a virtual environment to test and refine products before actual production, speeding up the Research and Development (R&D) process. A report indicates that companies using digital twins in product development can decrease time-to-market by as much as 50%, offering a significant competitive advantage.

Companies like Tesla and Boeing have successfully leveraged digital twin technology to streamline production processes, reduce costs, and improve product quality. This trend reinforces the pivotal role of digital twins in modern manufacturing practices, showcasing their potential for further expansion within the Digital Twin Market.

Digital Twin Market Segment Insights

Digital Twin Market Application Insights  

The Digital Twin Market is experiencing significant growth, particularly within the Application segment. The diverse applications of digital twin technology span across various industries, including Manufacturing, Healthcare, Smart Cities, Automotive, and Energy Management. In the manufacturing domain, the market is estimated to hold a value of 2.5 USD Billion in 2024 and increase to 22.5 USD billion by 2035. This segment is crucial as manufacturers leverage digital twins for predictive maintenance and efficiency enhancements, thereby leading the transformation of operational processes.

Healthcare is another vital area where digital twin technology is making substantial impacts. With a market value of 1.8 USD billion projected for 2024, rising to 16.2 USD Billion in 2035, it enables personalized medicine, patient monitoring, and operational optimization in healthcare facilities, showcasing its potential to revolutionize patient care and medical research. In the Smart Cities segment, valued at 1.5 USD Billion in 2024 and expected to reach 13.5 USD Billion by 2035, digital twins facilitate urban planning and infrastructure management, optimizing resource allocation and improving citizen engagement.

The automotive industry is on a similar growth trajectory, with an anticipated value of 2.0 USD Billion in 2024 and 18.0 USD billion in 2035, as car manufacturers utilize digital twins for design, testing, and enhancing vehicle performance. Finally, the Energy Management segment is also gaining traction, with a value of 1.2 USD billion projected for 2024 and growth to 10.8 USD billion by 2035. Digital twins in this area are significant for optimizing energy production and consumption, contributing to sustainability initiatives worldwide. The Digital Twin Market segmentation highlights how each of these applications plays an essential role in industrial advancements and urban development, driven by the increasing adoption of Industry 4.0 principles and the growing demand for smart solutions that improve efficiency and efficacy in various sectors.

Digital Twin Market Application Insights

Source: Primary Research, Secondary Research, Market Research Future Database, and Analyst Review

Digital Twin Market Technology Insights  

The Digital Twin Market is witnessing a robust growth from 2025 to 2035. Within its technology sector, various solutions such as IoT-Enabled Digital Twins, AI-Driven Digital Twins, Simulation-Based Digital Twins, and Data-Driven Digital Twins play crucial roles. IoT-Enabled Digital Twins are particularly significant, providing real-time data integration and insights that enhance operational efficiency across industries.

AI-Driven Digital Twins are becoming increasingly prevalent, leveraging artificial intelligence to optimize predictive maintenance and performance monitoring. Simulation-based digital Twins allow for thorough testing and predictive analysis in virtual environments, significantly impacting design and development processes. Moreover, Data-Driven Digital Twins offer valuable insights through extensive data analytics, enabling organizations to make informed decisions.

Collectively, these technological advancements are shaping the future of the Digital Twin Market industry, driving innovations that cater to evolving business demands and enhancing productivity and resource management across various sectors. The continued investment in digital twin technologies underlines the commitment to improving operational capabilities on a global scale.

Digital Twin Market End Use Insights  

The key segments within the end-use include: Business-to-Business (B2B), Business-to-Consumer (B2C), and Government applications. The B2B segment remains vital, as organizations leverage digital twins for improved product lifecycle management and enhanced operational efficiencies. Meanwhile, the B2C segment captures consumer engagement metrics, optimizing personalized experiences and product offerings.

Government usage of digital twins is also expanding, reflecting significant investment in infrastructure and smart city initiatives aimed at efficiency and sustainability. The Digital Twin Market data indicates that these sectors contribute to the industry's dynamic evolution, driven by technological advancement and the growing demand for data-driven decisions. Overall, the segment roadmap illustrates a landscape rich with opportunities as it responds to the ever-evolving market growth and innovation demands across the globe.

Digital Twin Market Deployment Type Insights  

The Digital Twin Market has been witnessing substantial growth, driven significantly by the Deployment Type segment, which includes Cloud-Based and On-Premises solutions. The Cloud-Based solutions are particularly notable for their scalability, flexibility, and cost-effectiveness, allowing organizations to leverage advanced analytics and real-time data processing without significant upfront investments. Conversely, On-Premises deployments are favored by industries where data security and control are paramount, such as aerospace and defense. This segment addresses specific legacy system integrations, ensuring compliance with regulatory requirements and providing increased customization.

As organizations increasingly prioritize digital transformation, the Digital Twin Market revenue is expected to expand significantly, opening up new opportunities for innovations in sectors like manufacturing, healthcare, and urban planning. The market growth in this deployment arena will be propelled by the rising demand for predictive maintenance, operational efficiency, and enhanced decision-making capabilities, further intensifying the competition among leading players in the Digital Twin Market industry.

Digital Twin Market Regional Insights  

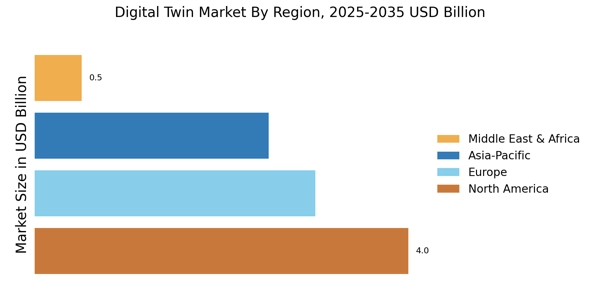
The Digital Twin Market is poised for robust growth, with North America commanding a significant position, valued at 4.0 USD Billion in 2024 and projected to reach 36.0 USD Billion by 2035. This region dominates primarily due to its advanced technological landscape and high investments in Research and Development. Europe follows closely, starting at 2.5 USD Billion in 2024 and increasing to 22.5 USD billion by 2035, driven by the growing demand for smart manufacturing and Industry 4.0 initiatives. Asia Pacific is also emerging as a key player, anticipated to grow from 2.75 USD Billion in 2024 to 24.75 USD billion in 2035, benefiting from rapid industrialization and urbanization.

South America, while smaller, shows promise with a valuation rise from 0.75 USD Billion in 2024 to 6.75 USD billion by 2035, indicating increasing adoption of digital technologies. The Middle East and Africa segment, valued at 0.96 USD billion in 2024 and projected to reach 8.0 USD billion by 2035, is experiencing growth due to digital transformation initiatives. Each of these regions exhibits unique drivers, challenges, and opportunities that contribute to the overall growth in the Digital Twin Market revenue and its segmentation, reflecting a dynamic industry landscape in diverse geographical locations.

Digital Twin Market Regional Insights

Source: Primary Research, Secondary Research, Market Research Future Database, and Analyst Review

Digital Twin Market Key Players and Competitive Insights

The Digital Twin Market has seen a significant upsurge in recent years, driven by advancements in technology and the growing need for real-time data analytics across various industries. As organizations strive to improve operational efficiency, reduce costs, and enhance product lifecycle management, the adoption of digital twins has become increasingly prevalent. Competitive insights into this market indicate a diverse landscape, characterized by innovations in cloud computing, IoT, and artificial intelligence, as companies leverage these technologies to create sophisticated twin models. Players in this market are vying for leadership positions through strategic partnerships, mergers, and comprehensive service offerings, thus intensifying competition and accelerating the pace of growth of digital twin solutions globally.

Altair Engineering stands out in the Digital Twin Market for its robust simulation-driven approach that emphasizes design and innovation. The company's commitment to providing advanced analytics and simulation software positions it as a strong player, enabling organizations to leverage high-fidelity digital twins for enhanced decision-making. Altair harnesses its strengths in artificial intelligence and machine learning to optimize the performance of digital twin applications across various sectors, such as manufacturing and automotive. By integrating simulation technology with data analytics, Altair Engineering provides clients with tools that guide product development and operational strategies, thereby substantiating its relevance and market presence in the digital twin space. The company has cultivated a reputation for delivering intuitive and flexible solutions, facilitating widespread adoption and integration within existing workflows across industries.

PTC has established a notable position in the Digital Twin Market, recognized for its innovative solutions that bridge physical and digital environments. The company emphasizes its strong product lineup, particularly with its ThingWorx platform, which is geared towards enabling the creation and management of digital twins across the entire product lifecycle. PTC's strengths lie in its ability to provide comprehensive end-to-end solutions that encompass IoT, augmented reality, and product lifecycle management, thus catering to the evolving needs of various sectors. The company's strategic mergers and acquisitions have further reinforced its market position, enabling it to expand its capabilities and enhance its offering portfolio. PTC's solid market presence is complemented by its focus on customer-centric innovations, facilitating organizations in leveraging digital twins to optimize operations, increase efficiency, and drive product innovation on a global scale.

Key Companies in the Digital Twin Market Include

  • Altair Engineering
  • PTC
  • General Electric
  • Oracle
  • Microsoft
  • NVIDIA
  • IBM
  • Honeywell
  • Siemens
  • Bosch
  • Dassault Systemes
  • SAP
  • Ansys
  • Accenture
  • Emerson Electric

Digital Twin Market Industry Developments

The Digital Twin Market has seen significant developments recently, particularly with advancements in Artificial Intelligence and the Internet of Things driving the adoption of digital twin technology across industries.

In January 2025, Siemens introduced advancements in industrial AI and digital twin technology, which enabled secure access to extensive language models on factory floors. Siemens initiated the Siemens for Startups program in collaboration with AWS, while JetZero selected Siemens Xcelerator for its composite wing aircraft development. Siemens also partnered with Sony to develop immersive designs using a mixed-reality headset and NX Software, and collaborated with NVIDIA on product lifecycle management.

DriveLab ACS880, a next-generation digital twin solution that is compatible with HIL, was introduced by ABB and Typhoon HIL, a U.S.-based hardware technology provider, in December 2024. By integrating Hardware-in-the-Loop (HIL), this technology improves user development by addressing interoperability challenges. It simplifies commissioning and verifies product behavior by integrating control hardware, firmware, and software with high-fidelity digital models. The solution enhances safety, efficiency, and quality by reducing risk.

In July 2024, ANSYS, Inc. formed a partnership with Super Micro Computer, Inc., a U.S.-based IT company, and NVIDIA Corporation, a U.S.-based software company, to provide hardware solutions that enhance the multiphysics simulation capabilities of ANSYS. NVIDIA Corporation's AI and digital twin platforms are instrumental in the development of the company's state-of-the-art AI superchips, as they allow the company to exceed the boundaries of simulation performance.

The market valuation of companies such as IBM and Microsoft has been rising, driven by increased investments in Research and Development for digital twin solutions, further highlighting the growing importance of this technology within the global industrial landscape. The digital twin sector continues to expand, reflecting its vital role in enabling businesses to optimize operations and innovate through real-time data utilization.

Digital Twin Market Segmentation Insights

Digital Twin Market Application Outlook

  • Manufacturing
  • Healthcare
  • Smart Cities
  • Automotive
  • Energy Management

Digital Twin Market Technology Outlook

  • IoT-Enabled Digital Twins
  • AI-Driven Digital Twins
  • Simulation-Based Digital Twins
  • Data-Driven Digital Twins

Digital Twin Market End Use Outlook

  • B2B
  • B2C
  • Government

Digital Twin Market Deployment Type Outlook

  • Cloud-Based
  • On-Premises

Digital Twin Market Regional Outlook

  • North America
  • Europe
  • South America
  • Asia Pacific
  • Middle East and Africa
Report Attribute/Metric Details
Market Size 2018 8.17(USD Billion)
Market Size 2024 9.96(USD Billion)
Market Size 2035 88.04 (USD Billion)
Compound Annual Growth Rate (CAGR) 21.91% (2025 - 2035)
Report Coverage Revenue Forecast, Competitive Landscape, Growth Factors, and Trends
Base Year 2024
Market Forecast Period 2025 - 2035
Historical Data 2019 - 2024
Market Forecast Units USD Billion
Key Companies Profiled Altair Engineering, PTC, General Electric, Oracle, Microsoft, NVIDIA, IBM, Honeywell, Siemens, Bosch, Dassault Systemes, SAP, Ansys, Accenture, Emerson Electric
Segments Covered Application, Technology, End Use, Deployment Type, Regional
Key Market Opportunities Increased demand for predictive maintenance, Growth in IoT integration, Expansion in smart manufacturing, Rising focus on sustainability initiatives, Enhanced virtual simulations for training
Key Market Dynamics Increased industrial automation, growing IoT integration, Demand for predictive maintenance, Enhanced data analytics capabilities, and rising investment in smart cities
Countries Covered North America, Europe, APAC, South America, MEA


Frequently Asked Questions (FAQ):

The Digital Twin Market is expected to be valued at approximately 9.96 USD Billion in 2024.

By 2035, the Digital Twin Market is anticipated to reach around 88.04 USD billion.

The market is expected to grow at a CAGR of 21.91% from 2025 to 2035.

North America is expected to dominate the market with a valuation of 4.0 USD billion in 2024.

The manufacturing application of the Digital Twin Market is projected to be valued at 22.5 USD Billion in 2035.

Key players include Altair Engineering, PTC, General Electric, Oracle, Microsoft, and NVIDIA, among others.

In 2024, the healthcare application of Digital Twin is valued at approximately 1.8 USD billion.

The market for smart cities is expected to reach around 13.5 USD billion by 2035.

The energy management application is valued at approximately 1.2 USD Billion in 2024.

The Asia Pacific region is expected to reach a market size of about 24.75 USD billion by 2035.

Comments

Digital Twin Market Segmentation


  • Digital Twin Market By Application (USD Billion, 2019-2035)


    • Manufacturing


    • Healthcare


    • Smart Cities


    • Automotive


    • Energy Management


  • Digital Twin Market By Technology (USD Billion, 2019-2035)


    • IoT-Enabled Digital Twins


    • AI-Driven Digital Twins


    • Simulation-Based Digital Twins


    • Data-Driven Digital Twins


  • Digital Twin Market By End Use (USD Billion, 2019-2035)


    • B2B


    • B2C


    • Government


  • Digital Twin Market By Deployment Type (USD Billion, 2019-2035)


    • Cloud-Based


    • On-Premises


  • Digital Twin Market By Regional (USD Billion, 2019-2035)


    • North America


    • Europe


    • South America


    • Asia Pacific


    • Middle East and Africa


Digital Twin Market Regional Outlook (USD Billion, 2019-2035)


  • North America Outlook (USD Billion, 2019-2035)


    • North America Market by Application Type


      • Manufacturing


      • Healthcare


      • Smart Cities


      • Automotive


      • Energy Management


    • North America Market by Technology Type


      • IoT-Enabled s


      • AI-Driven s


      • Simulation-Based s


      • Data-Driven s


    • North America Market by End Use Type


      • B2B


      • B2C


      • Government


    • North America Market by Deployment Type


      • Cloud-Based


      • On-Premises


    • North America Market by Regional Type


      • US


      • Canada


    • US Outlook (USD Billion, 2019-2035)


    • US Market by Application Type


      • Manufacturing


      • Healthcare


      • Smart Cities


      • Automotive


      • Energy Management


    • US Market by Technology Type


      • IoT-Enabled s


      • AI-Driven s


      • Simulation-Based s


      • Data-Driven s


    • US Market by End Use Type


      • B2B


      • B2C


      • Government


    • US Market by Deployment Type


      • Cloud-Based


      • On-Premises


    • CANADA Outlook (USD Billion, 2019-2035)


    • CANADA Market by Application Type


      • Manufacturing


      • Healthcare


      • Smart Cities


      • Automotive


      • Energy Management


    • CANADA Market by Technology Type


      • IoT-Enabled s


      • AI-Driven s


      • Simulation-Based s


      • Data-Driven s


    • CANADA Market by End Use Type


      • B2B


      • B2C


      • Government


    • CANADA Market by Deployment Type


      • Cloud-Based


      • On-Premises


  • Europe Outlook (USD Billion, 2019-2035)


    • Europe Market by Application Type


      • Manufacturing


      • Healthcare


      • Smart Cities


      • Automotive


      • Energy Management


    • Europe Market by Technology Type


      • IoT-Enabled s


      • AI-Driven s


      • Simulation-Based s


      • Data-Driven s


    • Europe Market by End Use Type


      • B2B


      • B2C


      • Government


    • Europe Market by Deployment Type


      • Cloud-Based


      • On-Premises


    • Europe Market by Regional Type


      • Germany


      • UK


      • France


      • Russia


      • Italy


      • Spain


      • Rest of Europe


    • GERMANY Outlook (USD Billion, 2019-2035)


    • GERMANY Market by Application Type


      • Manufacturing


      • Healthcare


      • Smart Cities


      • Automotive


      • Energy Management


    • GERMANY Market by Technology Type


      • IoT-Enabled s


      • AI-Driven s


      • Simulation-Based s


      • Data-Driven s


    • GERMANY Market by End Use Type


      • B2B


      • B2C


      • Government


    • GERMANY Market by Deployment Type


      • Cloud-Based


      • On-Premises


    • UK Outlook (USD Billion, 2019-2035)


    • UK Market by Application Type


      • Manufacturing


      • Healthcare


      • Smart Cities


      • Automotive


      • Energy Management


    • UK Market by Technology Type


      • IoT-Enabled s


      • AI-Driven s


      • Simulation-Based s


      • Data-Driven s


    • UK Market by End Use Type


      • B2B


      • B2C


      • Government


    • UK Market by Deployment Type


      • Cloud-Based


      • On-Premises


    • FRANCE Outlook (USD Billion, 2019-2035)


    • FRANCE Market by Application Type


      • Manufacturing


      • Healthcare


      • Smart Cities


      • Automotive


      • Energy Management


    • FRANCE Market by Technology Type


      • IoT-Enabled s


      • AI-Driven s


      • Simulation-Based s


      • Data-Driven s


    • FRANCE Market by End Use Type


      • B2B


      • B2C


      • Government


    • FRANCE Market by Deployment Type


      • Cloud-Based


      • On-Premises


    • RUSSIA Outlook (USD Billion, 2019-2035)


    • RUSSIA Market by Application Type


      • Manufacturing


      • Healthcare


      • Smart Cities


      • Automotive


      • Energy Management


    • RUSSIA Market by Technology Type


      • IoT-Enabled s


      • AI-Driven s


      • Simulation-Based s


      • Data-Driven s


    • RUSSIA Market by End Use Type


      • B2B


      • B2C


      • Government


    • RUSSIA Market by Deployment Type


      • Cloud-Based


      • On-Premises


    • ITALY Outlook (USD Billion, 2019-2035)


    • ITALY Market by Application Type


      • Manufacturing


      • Healthcare


      • Smart Cities


      • Automotive


      • Energy Management


    • ITALY Market by Technology Type


      • IoT-Enabled s


      • AI-Driven s


      • Simulation-Based s


      • Data-Driven s


    • ITALY Market by End Use Type


      • B2B


      • B2C


      • Government


    • ITALY Market by Deployment Type


      • Cloud-Based


      • On-Premises


    • SPAIN Outlook (USD Billion, 2019-2035)


    • SPAIN Market by Application Type


      • Manufacturing


      • Healthcare


      • Smart Cities


      • Automotive


      • Energy Management


    • SPAIN Market by Technology Type


      • IoT-Enabled s


      • AI-Driven s


      • Simulation-Based s


      • Data-Driven s


    • SPAIN Market by End Use Type


      • B2B


      • B2C


      • Government


    • SPAIN Market by Deployment Type


      • Cloud-Based


      • On-Premises


    • REST OF EUROPE Outlook (USD Billion, 2019-2035)


    • REST OF EUROPE Market by Application Type


      • Manufacturing


      • Healthcare


      • Smart Cities


      • Automotive


      • Energy Management


    • REST OF EUROPE Market by Technology Type


      • IoT-Enabled s


      • AI-Driven s


      • Simulation-Based s


      • Data-Driven s


    • REST OF EUROPE Market by End Use Type


      • B2B


      • B2C


      • Government


    • REST OF EUROPE Market by Deployment Type


      • Cloud-Based


      • On-Premises


  • APAC Outlook (USD Billion, 2019-2035)


    • APAC Market by Application Type


      • Manufacturing


      • Healthcare


      • Smart Cities


      • Automotive


      • Energy Management


    • APAC Market by Technology Type


      • IoT-Enabled s


      • AI-Driven s


      • Simulation-Based s


      • Data-Driven s


    • APAC Market by End Use Type


      • B2B


      • B2C


      • Government


    • APAC Market by Deployment Type


      • Cloud-Based


      • On-Premises


    • APAC Market by Regional Type


      • China


      • India


      • Japan


      • South Korea


      • Malaysia


      • Thailand


      • Indonesia


      • Rest of APAC


    • CHINA Outlook (USD Billion, 2019-2035)


    • CHINA Market by Application Type


      • Manufacturing


      • Healthcare


      • Smart Cities


      • Automotive


      • Energy Management


    • CHINA Market by Technology Type


      • IoT-Enabled s


      • AI-Driven s


      • Simulation-Based s


      • Data-Driven s


    • CHINA Market by End Use Type


      • B2B


      • B2C


      • Government


    • CHINA Market by Deployment Type


      • Cloud-Based


      • On-Premises


    • INDIA Outlook (USD Billion, 2019-2035)


    • INDIA Market by Application Type


      • Manufacturing


      • Healthcare


      • Smart Cities


      • Automotive


      • Energy Management


    • INDIA Market by Technology Type


      • IoT-Enabled s


      • AI-Driven s


      • Simulation-Based s


      • Data-Driven s


    • INDIA Market by End Use Type


      • B2B


      • B2C


      • Government


    • INDIA Market by Deployment Type


      • Cloud-Based


      • On-Premises


    • JAPAN Outlook (USD Billion, 2019-2035)


    • JAPAN Market by Application Type


      • Manufacturing


      • Healthcare


      • Smart Cities


      • Automotive


      • Energy Management


    • JAPAN Market by Technology Type


      • IoT-Enabled s


      • AI-Driven s


      • Simulation-Based s


      • Data-Driven s


    • JAPAN Market by End Use Type


      • B2B


      • B2C


      • Government


    • JAPAN Market by Deployment Type


      • Cloud-Based


      • On-Premises


    • SOUTH KOREA Outlook (USD Billion, 2019-2035)


    • SOUTH KOREA Market by Application Type


      • Manufacturing


      • Healthcare


      • Smart Cities


      • Automotive


      • Energy Management


    • SOUTH KOREA Market by Technology Type


      • IoT-Enabled s


      • AI-Driven s


      • Simulation-Based s


      • Data-Driven s


    • SOUTH KOREA Market by End Use Type


      • B2B


      • B2C


      • Government


    • SOUTH KOREA Market by Deployment Type


      • Cloud-Based


      • On-Premises


    • MALAYSIA Outlook (USD Billion, 2019-2035)


    • MALAYSIA Market by Application Type


      • Manufacturing


      • Healthcare


      • Smart Cities


      • Automotive


      • Energy Management


    • MALAYSIA Market by Technology Type


      • IoT-Enabled s


      • AI-Driven s


      • Simulation-Based s


      • Data-Driven s


    • MALAYSIA Market by End Use Type


      • B2B


      • B2C


      • Government


    • MALAYSIA Market by Deployment Type


      • Cloud-Based


      • On-Premises


    • THAILAND Outlook (USD Billion, 2019-2035)


    • THAILAND Market by Application Type


      • Manufacturing


      • Healthcare


      • Smart Cities


      • Automotive


      • Energy Management


    • THAILAND Market by Technology Type


      • IoT-Enabled s


      • AI-Driven s


      • Simulation-Based s


      • Data-Driven s


    • THAILAND Market by End Use Type


      • B2B


      • B2C


      • Government


    • THAILAND Market by Deployment Type


      • Cloud-Based


      • On-Premises


    • INDONESIA Outlook (USD Billion, 2019-2035)


    • INDONESIA Market by Application Type


      • Manufacturing


      • Healthcare


      • Smart Cities


      • Automotive


      • Energy Management


    • INDONESIA Market by Technology Type


      • IoT-Enabled s


      • AI-Driven s


      • Simulation-Based s


      • Data-Driven s


    • INDONESIA Market by End Use Type


      • B2B


      • B2C


      • Government


    • INDONESIA Market by Deployment Type


      • Cloud-Based


      • On-Premises


    • REST OF APAC Outlook (USD Billion, 2019-2035)


    • REST OF APAC Market by Application Type


      • Manufacturing


      • Healthcare


      • Smart Cities


      • Automotive


      • Energy Management


    • REST OF APAC Market by Technology Type


      • IoT-Enabled s


      • AI-Driven s


      • Simulation-Based s


      • Data-Driven s


    • REST OF APAC Market by End Use Type


      • B2B


      • B2C


      • Government


    • REST OF APAC Market by Deployment Type


      • Cloud-Based


      • On-Premises


  • South America Outlook (USD Billion, 2019-2035)


    • South America Market by Application Type


      • Manufacturing


      • Healthcare


      • Smart Cities


      • Automotive


      • Energy Management


    • South America Market by Technology Type


      • IoT-Enabled s


      • AI-Driven s


      • Simulation-Based s


      • Data-Driven s


    • South America Market by End Use Type


      • B2B


      • B2C


      • Government


    • South America Market by Deployment Type


      • Cloud-Based


      • On-Premises


    • South America Market by Regional Type


      • Brazil


      • Mexico


      • Argentina


      • Rest of South America


    • BRAZIL Outlook (USD Billion, 2019-2035)


    • BRAZIL Market by Application Type


      • Manufacturing


      • Healthcare


      • Smart Cities


      • Automotive


      • Energy Management


    • BRAZIL Market by Technology Type


      • IoT-Enabled s


      • AI-Driven s


      • Simulation-Based s


      • Data-Driven s


    • BRAZIL Market by End Use Type


      • B2B


      • B2C


      • Government


    • BRAZIL Market by Deployment Type


      • Cloud-Based


      • On-Premises


    • MEXICO Outlook (USD Billion, 2019-2035)


    • MEXICO Market by Application Type


      • Manufacturing


      • Healthcare


      • Smart Cities


      • Automotive


      • Energy Management


    • MEXICO Market by Technology Type


      • IoT-Enabled s


      • AI-Driven s


      • Simulation-Based s


      • Data-Driven s


    • MEXICO Market by End Use Type


      • B2B


      • B2C


      • Government


    • MEXICO Market by Deployment Type


      • Cloud-Based


      • On-Premises


    • ARGENTINA Outlook (USD Billion, 2019-2035)


    • ARGENTINA Market by Application Type


      • Manufacturing


      • Healthcare


      • Smart Cities


      • Automotive


      • Energy Management


    • ARGENTINA Market by Technology Type


      • IoT-Enabled s


      • AI-Driven s


      • Simulation-Based s


      • Data-Driven s


    • ARGENTINA Market by End Use Type


      • B2B


      • B2C


      • Government


    • ARGENTINA Market by Deployment Type


      • Cloud-Based


      • On-Premises


    • REST OF SOUTH AMERICA Outlook (USD Billion, 2019-2035)


    • REST OF SOUTH AMERICA Market by Application Type


      • Manufacturing


      • Healthcare


      • Smart Cities


      • Automotive


      • Energy Management


    • REST OF SOUTH AMERICA Market by Technology Type


      • IoT-Enabled s


      • AI-Driven s


      • Simulation-Based s


      • Data-Driven s


    • REST OF SOUTH AMERICA Market by End Use Type


      • B2B


      • B2C


      • Government


    • REST OF SOUTH AMERICA Market by Deployment Type


      • Cloud-Based


      • On-Premises


  • MEA Outlook (USD Billion, 2019-2035)


    • MEA Market by Application Type


      • Manufacturing


      • Healthcare


      • Smart Cities


      • Automotive


      • Energy Management


    • MEA Market by Technology Type


      • IoT-Enabled s


      • AI-Driven s


      • Simulation-Based s


      • Data-Driven s


    • MEA Market by End Use Type


      • B2B


      • B2C


      • Government


    • MEA Market by Deployment Type


      • Cloud-Based


      • On-Premises


    • MEA Market by Regional Type


      • GCC Countries


      • South Africa


      • Rest of MEA


    • GCC COUNTRIES Outlook (USD Billion, 2019-2035)


    • GCC COUNTRIES Market by Application Type


      • Manufacturing


      • Healthcare


      • Smart Cities


      • Automotive


      • Energy Management


    • GCC COUNTRIES Market by Technology Type


      • IoT-Enabled s


      • AI-Driven s


      • Simulation-Based s


      • Data-Driven s


    • GCC COUNTRIES Market by End Use Type


      • B2B


      • B2C


      • Government


    • GCC COUNTRIES Market by Deployment Type


      • Cloud-Based


      • On-Premises


    • SOUTH AFRICA Outlook (USD Billion, 2019-2035)


    • SOUTH AFRICA Market by Application Type


      • Manufacturing


      • Healthcare


      • Smart Cities


      • Automotive


      • Energy Management


    • SOUTH AFRICA Market by Technology Type


      • IoT-Enabled s


      • AI-Driven s


      • Simulation-Based s


      • Data-Driven s


    • SOUTH AFRICA Market by End Use Type


      • B2B


      • B2C


      • Government


    • SOUTH AFRICA Market by Deployment Type


      • Cloud-Based


      • On-Premises


    • REST OF MEA Outlook (USD Billion, 2019-2035)


    • REST OF MEA Market by Application Type


      • Manufacturing


      • Healthcare


      • Smart Cities


      • Automotive


      • Energy Management


    • REST OF MEA Market by Technology Type


      • IoT-Enabled s


      • AI-Driven s


      • Simulation-Based s


      • Data-Driven s


    • REST OF MEA Market by End Use Type


      • B2B


      • B2C


      • Government


    • REST OF MEA Market by Deployment Type


      • Cloud-Based


      • On-Premises


Research Methodology on Digital Twin Market


1. Introduction


In recent years, digital twin technology is gaining popularity due to its many advantages and applications. This technology can be used to develop potential solutions for many industrial and business problems. However, there are still many challenges that need to be addressed before they can be applied to a variety of real-time scenarios. This study has set out to provide a comprehensive research methodology that would be used to analyze the market potential of digital twin technology in depth.


2. Research Design


For this study, a research design using a combination of qualitative and quantitative research methods is employed. Qualitative methods, such as interviews and focus groups, are used to better understand the needs and opinions of key vendors and users as well as identify the various issues facing the digital twin technology market. Quantitative methods, such as surveys and market analysis, are used to gain an understanding of the market size, the growth rate of the technology, and the potential for further expansion in the coming years.


3. Data Sources


In order to assess the market potential of the digital twin technology, data from primary and secondary sources are used. Primary data will be collected from interviews and focus groups with vendors and users in the digital twin technology industry. Additionally, surveys are used to better understand the current trends in the digital twin technology market, as well as its future potential.


Secondary data is collected from a variety of sources, including published reports, industry journals, and other sources of industry-specific information. Additionally, databases such as the Global Systemically Important Banks (G-SIB) database and the World Bank, as well as public records, census data, and financial statement analysis will be used to gain a better understanding of the global market.


4. Research Approach


To further enhance the research, a mixed-methods approach will be used. This includes a combination of both primary and secondary data collection methods, as well as qualitative and quantitative research techniques. This approach will provide a more in-depth understanding of the market and its potential.


The qualitative research techniques utilized in this study include interviews with key vendors and users and focus groups. The qualitative methods help uncover the areas where digital twin technology could be used, and help to provide insights into current and future trends in the industry.


The quantitative research techniques used in this study involve surveys, market sizing, and market segmentation. The surveys will provide an in-depth understanding of the current trends in the industry and the potential for further growth. Additionally, market sizing and segmentation will provide an understanding of the total market potential of the industry.


5. Data Collection


The data collection process for this study consists of both primary and secondary data sources. Primary data from interviews and focus groups are used to uncover the users’ needs and opinions of the technology, while surveys will be used to better understand the current trends in the industry.


Secondary data collected includes a variety of financial analyses, industry-specific reports, and market sizing. Furthermore, a range of databases, such as the World Bank and G-SIB database, as well as public records and census data, are used to gain an understanding of the global market.


6. Data Analysis


The data collected in this study is analyzed using multi-dimensional analysis techniques, such as factor analysis and cluster analysis. This provides a clearer picture of the market potential and key drivers of growth. Additionally, multiple regression analyses are applied to better understand the impact of the different variables on the market potential.


7. Conclusion


This research methodology is designed to provide a comprehensive assessment of the digital twin technology market. By utilizing a combination of qualitative and quantitative research techniques and a range of data sources, this research provides an understanding of the current trends in the industry and the potential for further growth in the forecast period from 2023 to 2030.

Table of Contents


  1. EXECUTIVE SUMMARY


    1. Market Overview


    2. Key Findings


    3. Market Segmentation


    4. Competitive Landscape


    5. Challenges and Opportunities


    6. Future Outlook


  1. MARKET INTRODUCTION


    1. Definition


    2. Scope of the study


      1. Research Objective


      2. Assumption


      3. Limitations


  2. RESEARCH METHODOLOGY


    1. Overview


    2. Data Mining


    3. Secondary Research


    4. Primary Research


      1. Primary Interviews and Information Gathering Process


      2. Breakdown of Primary Respondents


    5. Forecasting Model


    6. Market Size Estimation


      1. Bottom-Up Approach


      2. Top-Down Approach


    7. Data Triangulation


    8. Validation


  1. MARKET DYNAMICS


    1. Overview


    2. Drivers


    3. Restraints


    4. Opportunities


  2. MARKET FACTOR ANALYSIS


    1. Value chain Analysis


    2. Porter's Five Forces Analysis


      1. Bargaining Power of Suppliers


      2. Bargaining Power of Buyers


      3. Threat of New Entrants


      4. Threat of Substitutes


      5. Intensity of Rivalry


    3. COVID-19 Impact Analysis


      1. Market Impact Analysis


      2. Regional Impact


      3. Opportunity and Threat Analysis


  1. Digital Twin Market, BY Application (USD Billion)


    1. Manufacturing


    2. Healthcare


    3. Smart Cities


    4. Automotive


    5. Energy Management


  2. Digital Twin Market, BY Technology (USD Billion)


    1. IoT-Enabled Digital Twins


    2. AI-Driven Digital Twins


    3. Simulation-Based Digital Twins


    4. Data-Driven s


  3. Digital Twin Market, BY End Use (USD Billion)


    1. B2B


    2. B2C


    3. Government


  4. Digital Twin Market, BY Deployment Type (USD Billion)


    1. Cloud-Based


    2. On-Premises


  5. Digital Twin Market, BY Regional (USD Billion)


    1. North America


      1. US


      2. Canada


    2. Europe


      1. Germany


      2. UK


      3. France


      4. Russia


      5. Italy


      6. Spain


      7. Rest of Europe


    3. APAC


      1. China


      2. India


      3. Japan


      4. South Korea


      5. Malaysia


      6. Thailand


      7. Indonesia


      8. Rest of APAC


    4. South America


      1. Brazil


      2. Mexico


      3. Argentina


      4. Rest of South America


    5. MEA


      1. GCC Countries


      2. South Africa


      3. Rest of MEA


  1. Competitive Landscape


    1. Overview


    2. Competitive Analysis


    3. Market share Analysis


    4. Major Growth Strategy in the Digital Twin Market


    5. Competitive Benchmarking


    6. Leading Players in Terms of Number of Developments in the Digital Twin Market


    7. Key developments and growth strategies


      1. New Product Launch/Service Deployment


      2. Merger & Acquisitions


      3. Joint Ventures


    8. Major Players Financial Matrix


      1. Sales and Operating Income


      2. Major Players R&D Expenditure. 2023


  2. Company Profiles


    1. IBM


      1. Financial Overview


      2. Products Offered


      3. Key Developments


      4. SWOT Analysis


      5. Key Strategies


    2. NVIDIA


      1. Financial Overview


      2. Products Offered


      3. Key Developments


      4. SWOT Analysis


      5. Key Strategies


    3. Altair


      1. Financial Overview


      2. Products Offered


      3. Key Developments


      4. SWOT Analysis


      5. Key Strategies


    4. SAP


      1. Financial Overview


      2. Products Offered


      3. Key Developments


      4. SWOT Analysis


      5. Key Strategies


    5. Bentley Systems


      1. Financial Overview


      2. Products Offered


      3. Key Developments


      4. SWOT Analysis


      5. Key Strategies


    6. PTC


      1. Financial Overview


      2. Products Offered


      3. Key Developments


      4. SWOT Analysis


      5. Key Strategies


    7. Hexagon


      1. Financial Overview


      2. Products Offered


      3. Key Developments


      4. SWOT Analysis


      5. Key Strategies


    8. Microsoft


      1. Financial Overview


      2. Products Offered


      3. Key Developments


      4. SWOT Analysis


      5. Key Strategies


    9. Ansys


      1. Financial Overview


      2. Products Offered


      3. Key Developments


      4. SWOT Analysis


      5. Key Strategies


    10. Emerson


      1. Financial Overview


      2. Products Offered


      3. Key Developments


      4. SWOT Analysis


      5. Key Strategies


    11. AVEVA


      1. Financial Overview


      2. Products Offered


      3. Key Developments


      4. SWOT Analysis


      5. Key Strategies


    12. Siemens


      1. Financial Overview


      2. Products Offered


      3. Key Developments


      4. SWOT Analysis


      5. Key Strategies


    13. Oracle


      1. Financial Overview


      2. Products Offered


      3. Key Developments


      4. SWOT Analysis


      5. Key Strategies


    14. General Electric


      1. Financial Overview


      2. Products Offered


      3. Key Developments


      4. SWOT Analysis


      5. Key Strategies


  3. Appendix


    1. References


    2. Related Reports


LIST Of tables


  1. LIST OF ASSUMPTIONS


  2. North America Market SIZE ESTIMATES & FORECAST, BY APPLICATION, 2019-2035 (USD Billions)


  3. North America Market SIZE ESTIMATES & FORECAST, BY TECHNOLOGY, 2019-2035 (USD Billions)


  4. North America Market SIZE ESTIMATES & FORECAST, BY END USE, 2019-2035 (USD Billions)


  5. North America Market SIZE ESTIMATES & FORECAST, BY DEPLOYMENT TYPE, 2019-2035 (USD Billions)


  6. North America Market SIZE ESTIMATES & FORECAST, BY REGIONAL, 2019-2035 (USD Billions)


  7. US Market SIZE ESTIMATES & FORECAST, BY APPLICATION, 2019-2035 (USD Billions)


  8. US Market SIZE ESTIMATES & FORECAST, BY TECHNOLOGY, 2019-2035 (USD Billions)


  9. US Market SIZE ESTIMATES & FORECAST, BY END USE, 2019-2035 (USD Billions)


  10. US Market SIZE ESTIMATES & FORECAST, BY DEPLOYMENT TYPE, 2019-2035 (USD Billions)


  11. US Market SIZE ESTIMATES & FORECAST, BY REGIONAL, 2019-2035 (USD Billions)


  12. Canada Market SIZE ESTIMATES & FORECAST, BY APPLICATION, 2019-2035 (USD Billions)


  13. Canada Market SIZE ESTIMATES & FORECAST, BY TECHNOLOGY, 2019-2035 (USD Billions)


  14. Canada Market SIZE ESTIMATES & FORECAST, BY END USE, 2019-2035 (USD Billions)


  15. Canada Market SIZE ESTIMATES & FORECAST, BY DEPLOYMENT TYPE, 2019-2035 (USD Billions)


  16. Canada Market SIZE ESTIMATES & FORECAST, BY REGIONAL, 2019-2035 (USD Billions)


  17. Europe Market SIZE ESTIMATES & FORECAST, BY APPLICATION, 2019-2035 (USD Billions)


  18. Europe Market SIZE ESTIMATES & FORECAST, BY TECHNOLOGY, 2019-2035 (USD Billions)


  19. Europe Market SIZE ESTIMATES & FORECAST, BY END USE, 2019-2035 (USD Billions)


  20. Europe Market SIZE ESTIMATES & FORECAST, BY DEPLOYMENT TYPE, 2019-2035 (USD Billions)


  21. Europe Market SIZE ESTIMATES & FORECAST, BY REGIONAL, 2019-2035 (USD Billions)


  22. Germany Market SIZE ESTIMATES & FORECAST, BY APPLICATION, 2019-2035 (USD Billions)


  23. Germany Market SIZE ESTIMATES & FORECAST, BY TECHNOLOGY, 2019-2035 (USD Billions)


  24. Germany Market SIZE ESTIMATES & FORECAST, BY END USE, 2019-2035 (USD Billions)


  25. Germany Market SIZE ESTIMATES & FORECAST, BY DEPLOYMENT TYPE, 2019-2035 (USD Billions)


  26. Germany Market SIZE ESTIMATES & FORECAST, BY REGIONAL, 2019-2035 (USD Billions)


  27. UK Market SIZE ESTIMATES & FORECAST, BY APPLICATION, 2019-2035 (USD Billions)


  28. UK Market SIZE ESTIMATES & FORECAST, BY TECHNOLOGY, 2019-2035 (USD Billions)


  29. UK Market SIZE ESTIMATES & FORECAST, BY END USE, 2019-2035 (USD Billions)


  30. UK Market SIZE ESTIMATES & FORECAST, BY DEPLOYMENT TYPE, 2019-2035 (USD Billions)


  31. UK Market SIZE ESTIMATES & FORECAST, BY REGIONAL, 2019-2035 (USD Billions)


  32. France Market SIZE ESTIMATES & FORECAST, BY APPLICATION, 2019-2035 (USD Billions)


  33. France Market SIZE ESTIMATES & FORECAST, BY TECHNOLOGY, 2019-2035 (USD Billions)


  34. France Market SIZE ESTIMATES & FORECAST, BY END USE, 2019-2035 (USD Billions)


  35. France Market SIZE ESTIMATES & FORECAST, BY DEPLOYMENT TYPE, 2019-2035 (USD Billions)


  36. France Market SIZE ESTIMATES & FORECAST, BY REGIONAL, 2019-2035 (USD Billions)


  37. Russia Market SIZE ESTIMATES & FORECAST, BY APPLICATION, 2019-2035 (USD Billions)


  38. Russia Market SIZE ESTIMATES & FORECAST, BY TECHNOLOGY, 2019-2035 (USD Billions)


  39. Russia Market SIZE ESTIMATES & FORECAST, BY END USE, 2019-2035 (USD Billions)


  40. Russia Market SIZE ESTIMATES & FORECAST, BY DEPLOYMENT TYPE, 2019-2035 (USD Billions)


  41. Russia Market SIZE ESTIMATES & FORECAST, BY REGIONAL, 2019-2035 (USD Billions)


  42. Italy Market SIZE ESTIMATES & FORECAST, BY APPLICATION, 2019-2035 (USD Billions)


  43. Italy Market SIZE ESTIMATES & FORECAST, BY TECHNOLOGY, 2019-2035 (USD Billions)


  44. Italy Market SIZE ESTIMATES & FORECAST, BY END USE, 2019-2035 (USD Billions)


  45. Italy Market SIZE ESTIMATES & FORECAST, BY DEPLOYMENT TYPE, 2019-2035 (USD Billions)


  46. Italy Market SIZE ESTIMATES & FORECAST, BY REGIONAL, 2019-2035 (USD Billions)


  47. Spain Market SIZE ESTIMATES & FORECAST, BY APPLICATION, 2019-2035 (USD Billions)


  48. Spain Market SIZE ESTIMATES & FORECAST, BY TECHNOLOGY, 2019-2035 (USD Billions)


  49. Spain Market SIZE ESTIMATES & FORECAST, BY END USE, 2019-2035 (USD Billions)


  50. Spain Market SIZE ESTIMATES & FORECAST, BY DEPLOYMENT TYPE, 2019-2035 (USD Billions)


  51. Spain Market SIZE ESTIMATES & FORECAST, BY REGIONAL, 2019-2035 (USD Billions)


  52. Rest of Europe Market SIZE ESTIMATES & FORECAST, BY APPLICATION, 2019-2035 (USD Billions)


  53. Rest of Europe Market SIZE ESTIMATES & FORECAST, BY TECHNOLOGY, 2019-2035 (USD Billions)


  54. Rest of Europe Market SIZE ESTIMATES & FORECAST, BY END USE, 2019-2035 (USD Billions)


  55. Rest of Europe Market SIZE ESTIMATES & FORECAST, BY DEPLOYMENT TYPE, 2019-2035 (USD Billions)


  56. Rest of Europe Market SIZE ESTIMATES & FORECAST, BY REGIONAL, 2019-2035 (USD Billions)


  57. APAC Market SIZE ESTIMATES & FORECAST, BY APPLICATION, 2019-2035 (USD Billions)


  58. APAC Market SIZE ESTIMATES & FORECAST, BY TECHNOLOGY, 2019-2035 (USD Billions)


  59. APAC Market SIZE ESTIMATES & FORECAST, BY END USE, 2019-2035 (USD Billions)


  60. APAC Market SIZE ESTIMATES & FORECAST, BY DEPLOYMENT TYPE, 2019-2035 (USD Billions)


  61. APAC Market SIZE ESTIMATES & FORECAST, BY REGIONAL, 2019-2035 (USD Billions)


  62. China Market SIZE ESTIMATES & FORECAST, BY APPLICATION, 2019-2035 (USD Billions)


  63. China Market SIZE ESTIMATES & FORECAST, BY TECHNOLOGY, 2019-2035 (USD Billions)


  64. China Market SIZE ESTIMATES & FORECAST, BY END USE, 2019-2035 (USD Billions)


  65. China Market SIZE ESTIMATES & FORECAST, BY DEPLOYMENT TYPE, 2019-2035 (USD Billions)


  66. China Market SIZE ESTIMATES & FORECAST, BY REGIONAL, 2019-2035 (USD Billions)


  67. India Market SIZE ESTIMATES & FORECAST, BY APPLICATION, 2019-2035 (USD Billions)


  68. India Market SIZE ESTIMATES & FORECAST, BY TECHNOLOGY, 2019-2035 (USD Billions)


  69. India Market SIZE ESTIMATES & FORECAST, BY END USE, 2019-2035 (USD Billions)


  70. India Market SIZE ESTIMATES & FORECAST, BY DEPLOYMENT TYPE, 2019-2035 (USD Billions)


  71. India Market SIZE ESTIMATES & FORECAST, BY REGIONAL, 2019-2035 (USD Billions)


  72. Japan Market SIZE ESTIMATES & FORECAST, BY APPLICATION, 2019-2035 (USD Billions)


  73. Japan Market SIZE ESTIMATES & FORECAST, BY TECHNOLOGY, 2019-2035 (USD Billions)


  74. Japan Market SIZE ESTIMATES & FORECAST, BY END USE, 2019-2035 (USD Billions)


  75. Japan Market SIZE ESTIMATES & FORECAST, BY DEPLOYMENT TYPE, 2019-2035 (USD Billions)


  76. Japan Market SIZE ESTIMATES & FORECAST, BY REGIONAL, 2019-2035 (USD Billions)


  77. South Korea Market SIZE ESTIMATES & FORECAST, BY APPLICATION, 2019-2035 (USD Billions)


  78. South Korea Market SIZE ESTIMATES & FORECAST, BY TECHNOLOGY, 2019-2035 (USD Billions)


  79. South Korea Market SIZE ESTIMATES & FORECAST, BY END USE, 2019-2035 (USD Billions)


  80. South Korea Market SIZE ESTIMATES & FORECAST, BY DEPLOYMENT TYPE, 2019-2035 (USD Billions)


  81. South Korea Market SIZE ESTIMATES & FORECAST, BY REGIONAL, 2019-2035 (USD Billions)


  82. Malaysia Market SIZE ESTIMATES & FORECAST, BY APPLICATION, 2019-2035 (USD Billions)


  83. Malaysia Market SIZE ESTIMATES & FORECAST, BY TECHNOLOGY, 2019-2035 (USD Billions)


  84. Malaysia Market SIZE ESTIMATES & FORECAST, BY END USE, 2019-2035 (USD Billions)


  85. Malaysia Market SIZE ESTIMATES & FORECAST, BY DEPLOYMENT TYPE, 2019-2035 (USD Billions)


  86. Malaysia Market SIZE ESTIMATES & FORECAST, BY REGIONAL, 2019-2035 (USD Billions)


  87. Thailand Market SIZE ESTIMATES & FORECAST, BY APPLICATION, 2019-2035 (USD Billions)


  88. Thailand Market SIZE ESTIMATES & FORECAST, BY TECHNOLOGY, 2019-2035 (USD Billions)


  89. Thailand Market SIZE ESTIMATES & FORECAST, BY END USE, 2019-2035 (USD Billions)


  90. Thailand Market SIZE ESTIMATES & FORECAST, BY DEPLOYMENT TYPE, 2019-2035 (USD Billions)


  91. Thailand Market SIZE ESTIMATES & FORECAST, BY REGIONAL, 2019-2035 (USD Billions)


  92. Indonesia Market SIZE ESTIMATES & FORECAST, BY APPLICATION, 2019-2035 (USD Billions)


  93. Indonesia Market SIZE ESTIMATES & FORECAST, BY TECHNOLOGY, 2019-2035 (USD Billions)


  94. Indonesia Market SIZE ESTIMATES & FORECAST, BY END USE, 2019-2035 (USD Billions)


  95. Indonesia Market SIZE ESTIMATES & FORECAST, BY DEPLOYMENT TYPE, 2019-2035 (USD Billions)


  96. Indonesia Market SIZE ESTIMATES & FORECAST, BY REGIONAL, 2019-2035 (USD Billions)


  97. Rest of APAC Market SIZE ESTIMATES & FORECAST, BY APPLICATION, 2019-2035 (USD Billions)


  98. Rest of APAC Market SIZE ESTIMATES & FORECAST, BY TECHNOLOGY, 2019-2035 (USD Billions)


  99. Rest of APAC Market SIZE ESTIMATES & FORECAST, BY END USE, 2019-2035 (USD Billions)


  100. Rest of APAC Market SIZE ESTIMATES & FORECAST, BY DEPLOYMENT TYPE, 2019-2035 (USD Billions)


  101. Rest of APAC Market SIZE ESTIMATES & FORECAST, BY REGIONAL, 2019-2035 (USD Billions)


  102. South America Market SIZE ESTIMATES & FORECAST, BY APPLICATION, 2019-2035 (USD Billions)


  103. South America Market SIZE ESTIMATES & FORECAST, BY TECHNOLOGY, 2019-2035 (USD Billions)


  104. South America Market SIZE ESTIMATES & FORECAST, BY END USE, 2019-2035 (USD Billions)


  105. South America Market SIZE ESTIMATES & FORECAST, BY DEPLOYMENT TYPE, 2019-2035 (USD Billions)


  106. South America Market SIZE ESTIMATES & FORECAST, BY REGIONAL, 2019-2035 (USD Billions)


  107. Brazil Market SIZE ESTIMATES & FORECAST, BY APPLICATION, 2019-2035 (USD Billions)


  108. Brazil Market SIZE ESTIMATES & FORECAST, BY TECHNOLOGY, 2019-2035 (USD Billions)


  109. Brazil Market SIZE ESTIMATES & FORECAST, BY END USE, 2019-2035 (USD Billions)


  110. Brazil Market SIZE ESTIMATES & FORECAST, BY DEPLOYMENT TYPE, 2019-2035 (USD Billions)


  111. Brazil Market SIZE ESTIMATES & FORECAST, BY REGIONAL, 2019-2035 (USD Billions)


  112. Mexico Market SIZE ESTIMATES & FORECAST, BY APPLICATION, 2019-2035 (USD Billions)


  113. Mexico Market SIZE ESTIMATES & FORECAST, BY TECHNOLOGY, 2019-2035 (USD Billions)


  114. Mexico Market SIZE ESTIMATES & FORECAST, BY END USE, 2019-2035 (USD Billions)


  115. Mexico Market SIZE ESTIMATES & FORECAST, BY DEPLOYMENT TYPE, 2019-2035 (USD Billions)


  116. Mexico Market SIZE ESTIMATES & FORECAST, BY REGIONAL, 2019-2035 (USD Billions)


  117. Argentina Market SIZE ESTIMATES & FORECAST, BY APPLICATION, 2019-2035 (USD Billions)


  118. Argentina Market SIZE ESTIMATES & FORECAST, BY TECHNOLOGY, 2019-2035 (USD Billions)


  119. Argentina Market SIZE ESTIMATES & FORECAST, BY END USE, 2019-2035 (USD Billions)


  120. Argentina Market SIZE ESTIMATES & FORECAST, BY DEPLOYMENT TYPE, 2019-2035 (USD Billions)


  121. Argentina Market SIZE ESTIMATES & FORECAST, BY REGIONAL, 2019-2035 (USD Billions)


  122. Rest of South America Market SIZE ESTIMATES & FORECAST, BY APPLICATION, 2019-2035 (USD Billions)


  123. Rest of South America Market SIZE ESTIMATES & FORECAST, BY TECHNOLOGY, 2019-2035 (USD Billions)


  124. Rest of South America Market SIZE ESTIMATES & FORECAST, BY END USE, 2019-2035 (USD Billions)


  125. Rest of South America Market SIZE ESTIMATES & FORECAST, BY DEPLOYMENT TYPE, 2019-2035 (USD Billions)


  126. Rest of South America Market SIZE ESTIMATES & FORECAST, BY REGIONAL, 2019-2035 (USD Billions)


  127. MEA Market SIZE ESTIMATES & FORECAST, BY APPLICATION, 2019-2035 (USD Billions)


  128. MEA Market SIZE ESTIMATES & FORECAST, BY TECHNOLOGY, 2019-2035 (USD Billions)


  129. MEA Market SIZE ESTIMATES & FORECAST, BY END USE, 2019-2035 (USD Billions)


  130. MEA Market SIZE ESTIMATES & FORECAST, BY DEPLOYMENT TYPE, 2019-2035 (USD Billions)


  131. MEA Market SIZE ESTIMATES & FORECAST, BY REGIONAL, 2019-2035 (USD Billions)


  132. GCC Countries Market SIZE ESTIMATES & FORECAST, BY APPLICATION, 2019-2035 (USD Billions)


  133. GCC Countries Market SIZE ESTIMATES & FORECAST, BY TECHNOLOGY, 2019-2035 (USD Billions)


  134. GCC Countries Market SIZE ESTIMATES & FORECAST, BY END USE, 2019-2035 (USD Billions)


  135. GCC Countries Market SIZE ESTIMATES & FORECAST, BY DEPLOYMENT TYPE, 2019-2035 (USD Billions)


  136. GCC Countries Market SIZE ESTIMATES & FORECAST, BY REGIONAL, 2019-2035 (USD Billions)


  137. South Africa Market SIZE ESTIMATES & FORECAST, BY APPLICATION, 2019-2035 (USD Billions)


  138. South Africa Market SIZE ESTIMATES & FORECAST, BY TECHNOLOGY, 2019-2035 (USD Billions)


  139. South Africa Market SIZE ESTIMATES & FORECAST, BY END USE, 2019-2035 (USD Billions)


  140. South Africa Market SIZE ESTIMATES & FORECAST, BY DEPLOYMENT TYPE, 2019-2035 (USD Billions)


  141. South Africa Market SIZE ESTIMATES & FORECAST, BY REGIONAL, 2019-2035 (USD Billions)


  142. Rest of MEA Market SIZE ESTIMATES & FORECAST, BY APPLICATION, 2019-2035 (USD Billions)


  143. Rest of MEA Market SIZE ESTIMATES & FORECAST, BY TECHNOLOGY, 2019-2035 (USD Billions)


  144. Rest of MEA Market SIZE ESTIMATES & FORECAST, BY END USE, 2019-2035 (USD Billions)


  145. Rest of MEA Market SIZE ESTIMATES & FORECAST, BY DEPLOYMENT TYPE, 2019-2035 (USD Billions)


  146. Rest of MEA Market SIZE ESTIMATES & FORECAST, BY REGIONAL, 2019-2035 (USD Billions)


  147. PRODUCT LAUNCH/PRODUCT DEVELOPMENT/APPROVAL


  148. ACQUISITION/PARTNERSHIP


LIST Of figures


  1. MARKET SYNOPSIS


  2. NORTH AMERICA MARKET ANALYSIS


  3. US MARKET ANALYSIS BY APPLICATION


  4. US MARKET ANALYSIS BY TECHNOLOGY


  5. US MARKET ANALYSIS BY END USE


  6. US MARKET ANALYSIS BY DEPLOYMENT TYPE


  7. US MARKET ANALYSIS BY REGIONAL


  8. CANADA MARKET ANALYSIS BY APPLICATION


  9. CANADA MARKET ANALYSIS BY TECHNOLOGY


  10. CANADA MARKET ANALYSIS BY END USE


  11. CANADA MARKET ANALYSIS BY DEPLOYMENT TYPE


  12. CANADA MARKET ANALYSIS BY REGIONAL


  13. EUROPE MARKET ANALYSIS


  14. GERMANY MARKET ANALYSIS BY APPLICATION


  15. GERMANY MARKET ANALYSIS BY TECHNOLOGY


  16. GERMANY MARKET ANALYSIS BY END USE


  17. GERMANY MARKET ANALYSIS BY DEPLOYMENT TYPE


  18. GERMANY MARKET ANALYSIS BY REGIONAL


  19. UK MARKET ANALYSIS BY APPLICATION


  20. UK MARKET ANALYSIS BY TECHNOLOGY


  21. UK MARKET ANALYSIS BY END USE


  22. UK MARKET ANALYSIS BY DEPLOYMENT TYPE


  23. UK MARKET ANALYSIS BY REGIONAL


  24. FRANCE MARKET ANALYSIS BY APPLICATION


  25. FRANCE MARKET ANALYSIS BY TECHNOLOGY


  26. FRANCE MARKET ANALYSIS BY END USE


  27. FRANCE MARKET ANALYSIS BY DEPLOYMENT TYPE


  28. FRANCE MARKET ANALYSIS BY REGIONAL


  29. RUSSIA MARKET ANALYSIS BY APPLICATION


  30. RUSSIA MARKET ANALYSIS BY TECHNOLOGY


  31. RUSSIA MARKET ANALYSIS BY END USE


  32. RUSSIA MARKET ANALYSIS BY DEPLOYMENT TYPE


  33. RUSSIA MARKET ANALYSIS BY REGIONAL


  34. ITALY MARKET ANALYSIS BY APPLICATION


  35. ITALY MARKET ANALYSIS BY TECHNOLOGY


  36. ITALY MARKET ANALYSIS BY END USE


  37. ITALY MARKET ANALYSIS BY DEPLOYMENT TYPE


  38. ITALY MARKET ANALYSIS BY REGIONAL


  39. SPAIN MARKET ANALYSIS BY APPLICATION


  40. SPAIN MARKET ANALYSIS BY TECHNOLOGY


  41. SPAIN MARKET ANALYSIS BY END USE


  42. SPAIN MARKET ANALYSIS BY DEPLOYMENT TYPE


  43. SPAIN MARKET ANALYSIS BY REGIONAL


  44. REST OF EUROPE MARKET ANALYSIS BY APPLICATION


  45. REST OF EUROPE MARKET ANALYSIS BY TECHNOLOGY


  46. REST OF EUROPE MARKET ANALYSIS BY END USE


  47. REST OF EUROPE MARKET ANALYSIS BY DEPLOYMENT TYPE


  48. REST OF EUROPE MARKET ANALYSIS BY REGIONAL


  49. APAC MARKET ANALYSIS


  50. CHINA MARKET ANALYSIS BY APPLICATION


  51. CHINA MARKET ANALYSIS BY TECHNOLOGY


  52. CHINA MARKET ANALYSIS BY END USE


  53. CHINA MARKET ANALYSIS BY DEPLOYMENT TYPE


  54. CHINA MARKET ANALYSIS BY REGIONAL


  55. INDIA MARKET ANALYSIS BY APPLICATION


  56. INDIA MARKET ANALYSIS BY TECHNOLOGY


  57. INDIA MARKET ANALYSIS BY END USE


  58. INDIA MARKET ANALYSIS BY DEPLOYMENT TYPE


  59. INDIA MARKET ANALYSIS BY REGIONAL


  60. JAPAN MARKET ANALYSIS BY APPLICATION


  61. JAPAN MARKET ANALYSIS BY TECHNOLOGY


  62. JAPAN MARKET ANALYSIS BY END USE


  63. JAPAN MARKET ANALYSIS BY DEPLOYMENT TYPE


  64. JAPAN MARKET ANALYSIS BY REGIONAL


  65. SOUTH KOREA MARKET ANALYSIS BY APPLICATION


  66. SOUTH KOREA MARKET ANALYSIS BY TECHNOLOGY


  67. SOUTH KOREA MARKET ANALYSIS BY END USE


  68. SOUTH KOREA MARKET ANALYSIS BY DEPLOYMENT TYPE


  69. SOUTH KOREA MARKET ANALYSIS BY REGIONAL


  70. MALAYSIA MARKET ANALYSIS BY APPLICATION


  71. MALAYSIA MARKET ANALYSIS BY TECHNOLOGY


  72. MALAYSIA MARKET ANALYSIS BY END USE


  73. MALAYSIA MARKET ANALYSIS BY DEPLOYMENT TYPE


  74. MALAYSIA MARKET ANALYSIS BY REGIONAL


  75. THAILAND MARKET ANALYSIS BY APPLICATION


  76. THAILAND MARKET ANALYSIS BY TECHNOLOGY


  77. THAILAND MARKET ANALYSIS BY END USE


  78. THAILAND MARKET ANALYSIS BY DEPLOYMENT TYPE


  79. THAILAND MARKET ANALYSIS BY REGIONAL


  80. INDONESIA MARKET ANALYSIS BY APPLICATION


  81. INDONESIA MARKET ANALYSIS BY TECHNOLOGY


  82. INDONESIA MARKET ANALYSIS BY END USE


  83. INDONESIA MARKET ANALYSIS BY DEPLOYMENT TYPE


  84. INDONESIA MARKET ANALYSIS BY REGIONAL


  85. REST OF APAC MARKET ANALYSIS BY APPLICATION


  86. REST OF APAC MARKET ANALYSIS BY TECHNOLOGY


  87. REST OF APAC MARKET ANALYSIS BY END USE


  88. REST OF APAC MARKET ANALYSIS BY DEPLOYMENT TYPE


  89. REST OF APAC MARKET ANALYSIS BY REGIONAL


  90. SOUTH AMERICA MARKET ANALYSIS


  91. BRAZIL MARKET ANALYSIS BY APPLICATION


  92. BRAZIL MARKET ANALYSIS BY TECHNOLOGY


  93. BRAZIL MARKET ANALYSIS BY END USE


  94. BRAZIL MARKET ANALYSIS BY DEPLOYMENT TYPE


  95. BRAZIL MARKET ANALYSIS BY REGIONAL


  96. MEXICO MARKET ANALYSIS BY APPLICATION


  97. MEXICO MARKET ANALYSIS BY TECHNOLOGY


  98. MEXICO MARKET ANALYSIS BY END USE


  99. MEXICO MARKET ANALYSIS BY DEPLOYMENT TYPE


  100. MEXICO MARKET ANALYSIS BY REGIONAL


  101. ARGENTINA MARKET ANALYSIS BY APPLICATION


  102. ARGENTINA MARKET ANALYSIS BY TECHNOLOGY


  103. ARGENTINA MARKET ANALYSIS BY END USE


  104. ARGENTINA MARKET ANALYSIS BY DEPLOYMENT TYPE


  105. ARGENTINA MARKET ANALYSIS BY REGIONAL


  106. REST OF SOUTH AMERICA MARKET ANALYSIS BY APPLICATION


  107. REST OF SOUTH AMERICA MARKET ANALYSIS BY TECHNOLOGY


  108. REST OF SOUTH AMERICA MARKET ANALYSIS BY END USE


  109. REST OF SOUTH AMERICA MARKET ANALYSIS BY DEPLOYMENT TYPE


  110. REST OF SOUTH AMERICA MARKET ANALYSIS BY REGIONAL


  111. MEA MARKET ANALYSIS


  112. GCC COUNTRIES MARKET ANALYSIS BY APPLICATION


  113. GCC COUNTRIES MARKET ANALYSIS BY TECHNOLOGY


  114. GCC COUNTRIES MARKET ANALYSIS BY END USE


  115. GCC COUNTRIES MARKET ANALYSIS BY DEPLOYMENT TYPE


  116. GCC COUNTRIES MARKET ANALYSIS BY REGIONAL


  117. SOUTH AFRICA MARKET ANALYSIS BY APPLICATION


  118. SOUTH AFRICA MARKET ANALYSIS BY TECHNOLOGY


  119. SOUTH AFRICA MARKET ANALYSIS BY END USE


  120. SOUTH AFRICA MARKET ANALYSIS BY DEPLOYMENT TYPE


  121. SOUTH AFRICA MARKET ANALYSIS BY REGIONAL


  122. REST OF MEA MARKET ANALYSIS BY APPLICATION


  123. REST OF MEA MARKET ANALYSIS BY TECHNOLOGY


  124. REST OF MEA MARKET ANALYSIS BY END USE


  125. REST OF MEA MARKET ANALYSIS BY DEPLOYMENT TYPE


  126. REST OF MEA MARKET ANALYSIS BY REGIONAL


  127. KEY BUYING CRITERIA OF Digital Twin Market


  128. RESEARCH PROCESS OF MRFR


  129. DRO ANALYSIS OF Digital Twin Market


  130. DRIVERS IMPACT ANALYSIS: Digital Twin Market


  131. RESTRAINTS IMPACT ANALYSIS: Digital Twin Market


  132. SUPPLY / VALUE CHAIN: Digital Twin Market


  133. Digital Twin Market, BY APPLICATION, 2025 (% SHARE)


  134. Digital Twin Market, BY APPLICATION, 2019 TO 2035 (USD Billions)


  135. Digital Twin Market, BY TECHNOLOGY, 2025 (% SHARE)


  136. Digital Twin Market, BY TECHNOLOGY, 2019 TO 2035 (USD Billions)


  137. Digital Twin Market, BY END USE, 2025 (% SHARE)


  138. Digital Twin Market, BY END USE, 2019 TO 2035 (USD Billions)


  139. Digital Twin Market, BY DEPLOYMENT TYPE, 2025 (% SHARE)


  140. Digital Twin Market, BY DEPLOYMENT TYPE, 2019 TO 2035 (USD Billions)


  141. Digital Twin Market, BY REGIONAL, 2025 (% SHARE)


  142. Digital Twin Market, BY REGIONAL, 2019 TO 2035 (USD Billions)


  143. BENCHMARKING OF MAJOR COMPETITORS


Leading companies partner with us for data-driven Insights.

clients

Kindly complete the form below to receive a free sample of this Report

We do not share your information with anyone. However, we may send you emails based on your report interest from time to time. You may contact us at any time to opt-out.

Tailored for You
  • Dedicated Research on any specifics segment or region.
  • Focused Research on specific players in the market.
  • Custom Report based only on your requirements.
  • Flexibility to add or subtract any chapter in the study.
  • Historic data from 2014 and forecasts outlook till 2040.
  • Flexibility of providing data/insights in formats (PDF, PPT, Excel).
  • Provide cross segmentation in applicable scenario/markets.
report-img
ChatGPT Summarize Gemini Summarize Perplexity AI Summarize Grok AI Summarize Copilot Summarize