• Cat-intel
  • MedIntelliX
  • Resources
  • About Us
  • Request Free Sample ×

    Kindly complete the form below to receive a free sample of this Report

    Leading companies partner with us for data-driven Insights

    clients tt-cursor

    IR Spectroscopy Market

    ID: MRFR/SEM/8946-CR
    100 Pages
    Ankit Gupta
    May 2023

    IR Spectroscopy Market Research Report Information By Technology (Near-Infrared Spectroscopy, Mid-Infrared Spectroscopy, and Far-Infrared Spectroscopy), By Product (Benchtop, Portable, Hyphenated, and Others), By Vertical (Healthcare, Pharmaceuticals, Chemicals, Research, Food & Beverage, and Others), And By Region (North America, Europe, Asia-Pacific, And Rest Of The World) –Market Forecast Till 2032

    Share:
    Download PDF ×

    We do not share your information with anyone. However, we may send you emails based on your report interest from time to time. You may contact us at any time to opt-out.

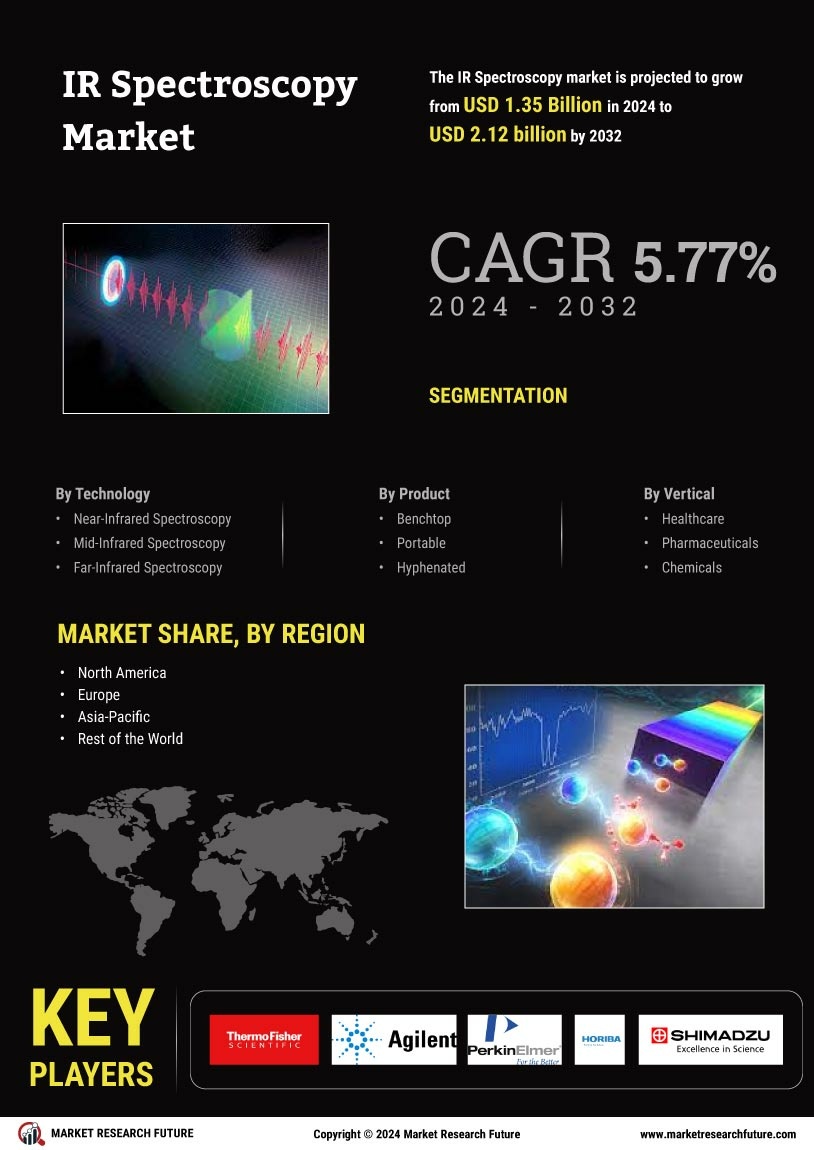
    IR Spectroscopy Market Research Report - Global Forecast till 2032 Infographic
    Purchase Options
    $ 4,950.0
    $ 5,950.0
    $ 7,250.0
    Table of Contents

    IR Spectroscopy Market Summary

    As per Market Research Future Analysis, the Global IR Spectroscopy Market was valued at USD 1.27 billion in 2023 and is projected to reach USD 2.12 billion by 2032, growing at a CAGR of 5.77% from 2024 to 2032. Key drivers include rising investments in pharmaceuticals and healthcare, technological advancements, and increasing demand for quality control in food production. The market is significantly influenced by the growth of dairy operations and food processing plants globally, alongside the need for high standards in food quality. North America leads the market due to its advanced technology and infrastructure, while the Asia-Pacific region is expected to grow rapidly due to industrial expansion.

    Key Market Trends & Highlights

    Key trends driving the IR Spectroscopy market include technological advancements and increasing investments in healthcare.

    • IR Spectroscopy market size in 2023: USD 1.27 billion.
    • Projected market size by 2032: USD 2.12 billion.
    • Mid-Infrared Spectroscopy accounted for 51.6% of market revenue in 2022.
    • Pharmaceutical vertical generated 55% of market share in 2022.

    Market Size & Forecast

    2023 Market Size USD 1.27 billion
    2024 Market Size USD 1.35 billion
    2032 Market Size USD 2.12 billion
    CAGR (2024-2032) 5.77%

    Major Players

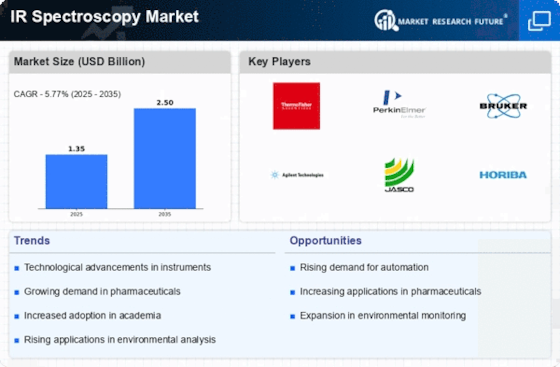
    Major players include Thermo Fisher Scientific Inc., Agilent Technologies Inc., PerkinElmer Inc., Horiba Limited, Shimadzu Corporation, and Bruker Corporation.

    IR Spectroscopy Market Trends

      • Growing pharma and healthcare investments are driving the market growth

    Market CAGR for IR Spectroscopy is driven by rising pharma and healthcare investments. Technological developments in the healthcare & pharmaceutical industries to stimulate R&D in these industries, as well as an increase in the number of medical facilities and clinical research to serve the needs of patients and medical staff, contribute to the market expansion. The Asian market is a hub for various industries, driving demand for IR spectroscopes for testing and monitoring. In addition, developing portable spectroscopes that will be aided in on-field applications is another element predicted to give growth prospects for the IR spectroscopy market.

    Based on their chemical makeup, IR Spectroscopy technology can recognize and distinguish items. As a result, it is used to process control, enforce quality standards, and avoid adulteration in preparing both plant- and animal-based goods. It is possible to calculate the amounts of lipids, proteins, carbs, and water in animal samples using IR spectroscopy.

    Additionally, the growth of dairy operations and food processing plants globally is opening up huge potential for the producers of IR spectroscopy. Food processing, fruit processing, oil production, milk and cheese production, and the production of meat products are just a few industries that use IR spectroscopy. Growing public interest in food production and quality has developed, primarily due to dietary changes. Demand for IR Spectroscopy is fueled by the need for high standards for quality and process control in food production, which in turn demands for the right analytical techniques to analyze food.

    Pharmaceutical discovery research is now being conducted in North America and Europe. As a result, it is anticipated that IR Spectroscopy will become more popular in these areas. Since the United States has the largest pharmaceutical market in the world and many medications are produced there, there is a demand for IR Spectroscopy. Additionally, the FDA performs regulatory approval for a variety of food goods; consequently, many food product manufacturers use IR Spectroscopy to check for contaminants, which aids in maintaining quality standards.

    Globally, various industries are being impacted by the COVID-19 industries like food and beverage, medicine, energy, electronics, semiconductor, and chemicals, have all experienced substantial disruptions as a result of the outbreak. As they are the main sources of supply and demand for IR spectroscopy solutions, the rise in industrial activities is having an impact on the development of the worldwide IR spectroscopy market. The production, supply, and sales of electronic components needed for the production of IR spectroscopy have been hampered by the factory closures, travel restrictions, trade bans, and border lockdowns implemented to combat and contain the outbreak.

    However, the post-pandemic situation revives the market, and a significant increase in demand for IR spectroscopy is seen.

    For instance, The WHO reported in May 2022  that approximately 11% of drugs sold in emerging nations are fake, which causes 144,000 fatalities per year. NIR spectroscopy is one of the methods that many regulatory organizations, including the U.S.-FDA, Ministry of Health, NDA, and Health Canada, utilize to evaluate pharmaceutical authentication. The multitude of applications, flexibility, adaptability, and the expanding application of NIR spectroscopy in providing chemical and physical information all contribute to the industry's expansion. Thus, driving the IR Spectroscopy market revenue.

    The increasing demand for advanced analytical techniques in various industries is driving the growth of the IR spectroscopy market, as it provides critical insights into molecular structures and compositions.

    U.S. Department of Commerce

    IR Spectroscopy Market Drivers

    Market Growth Projections

    The Global IR Spectroscopy Market Industry is poised for substantial growth, with projections indicating a market size of 1.35 USD Billion in 2024 and an anticipated increase to 2.51 USD Billion by 2035. The compound annual growth rate of 5.79% from 2025 to 2035 underscores the market's potential as various industries increasingly adopt IR spectroscopy for analytical purposes. This growth trajectory is supported by advancements in technology, expanding applications across diverse sectors, and heightened awareness of quality and safety standards. As the market evolves, it is likely to attract investments and innovations that further enhance its capabilities and applications.

    Growing Focus on Environmental Monitoring

    The Global IR Spectroscopy Market Industry is increasingly influenced by the growing emphasis on environmental monitoring and sustainability. IR spectroscopy plays a crucial role in detecting pollutants and analyzing environmental samples, which is essential for regulatory compliance and public health. Governments worldwide are implementing stricter environmental regulations, thereby increasing the demand for analytical techniques that can provide accurate and reliable data. As industries strive to minimize their environmental impact, the adoption of IR spectroscopy for monitoring air, water, and soil quality is likely to rise. This trend suggests a promising outlook for the market, particularly as environmental concerns continue to gain prominence.

    Technological Advancements in Spectroscopy

    Technological innovations significantly influence the Global IR Spectroscopy Market Industry, enhancing the capabilities and applications of IR spectroscopy. Recent advancements include the development of portable and miniaturized spectrometers, which allow for in-field analysis and real-time data acquisition. These innovations facilitate the use of IR spectroscopy in various sectors, including environmental monitoring and food safety. As these technologies evolve, they are expected to drive market growth, with projections indicating a market size of 2.51 USD Billion by 2035. The integration of artificial intelligence and machine learning into IR spectroscopy systems further enhances data interpretation, potentially revolutionizing analytical practices.

    Rising Demand in Pharmaceutical Applications

    The Global IR Spectroscopy Market Industry experiences a notable surge in demand driven by its extensive applications in the pharmaceutical sector. IR spectroscopy is pivotal for drug formulation, quality control, and stability testing. For instance, the ability to identify functional groups and molecular structures enhances the efficiency of drug development processes. As the pharmaceutical industry continues to expand, with an estimated market value of 1.35 USD Billion in 2024, the reliance on IR spectroscopy for analytical purposes is likely to grow. This trend indicates a robust future for IR spectroscopy, particularly as regulatory standards for drug safety and efficacy become increasingly stringent.

    Expansion of Research and Development Activities

    Research and development activities are pivotal in propelling the Global IR Spectroscopy Market Industry forward. Academic institutions and research organizations are increasingly utilizing IR spectroscopy for various scientific investigations, including material science, nanotechnology, and biochemistry. The continuous pursuit of innovation in these fields necessitates advanced analytical techniques, with IR spectroscopy being a preferred choice due to its versatility and precision. As R&D investments grow, particularly in emerging economies, the market is expected to witness substantial growth. The anticipated compound annual growth rate of 5.79% from 2025 to 2035 reflects the increasing integration of IR spectroscopy in cutting-edge research.

    Increased Adoption in Food and Beverage Industry

    The Global IR Spectroscopy Market Industry is experiencing heightened adoption within the food and beverage sector, driven by the need for quality assurance and safety testing. IR spectroscopy provides rapid and non-destructive analysis of food products, enabling the detection of contaminants and the assessment of composition. With consumers becoming more health-conscious and regulatory bodies enforcing stringent safety standards, food manufacturers are increasingly relying on IR spectroscopy for quality control. This trend is expected to contribute to market growth, as the food and beverage industry continues to evolve and adapt to changing consumer preferences and regulatory requirements.

    Market Segment Insights

    IR Spectroscopy Technology Insights

    The IR Spectroscopy Market segmentation, based on Technology, includes Near-Infrared Spectroscopy, Mid-Infrared Spectroscopy, and Far-Infrared Spectroscopy. Mid-Infrared Spectroscopy dominated the market, accounting for 51.6% of market revenue (USD 0.6 billion) in 2022. MIR is an influential tool to detect and scan materials, whether solid or liquid, as it is highly sensitive. It is beneficial in the food industry to detect contaminants, if any.

    Figure 1: IR Spectroscopy Market, by Technology, 2022 & 2032 (USD billion)

    Source: Secondary Research, Primary Research, MRFR Database, and Analyst Review

    IR Spectroscopy Product Insights

    The IR Spectroscopy Market segmentation, based on Product, includes Benchtop, Portable, Hyphenated, and Others. The Benchtop category dominated the market, accounting for 61.6% in 2022. It is widely used in chemical industries to determine elements' chemical and physical properties.

    IR Spectroscopy Vertical Insights

    The IR Spectroscopy Market segmentation, based on Vertical, includes healthcare, Pharmaceuticals, Chemicals, Research, Food & Beverage, and Others. The Pharmaceutical Vertical generated the highest revenue, accounting for 55% of the market share in 2022. Increasing investment in healthcare and pharmaceutical industries will contribute to the IR spectroscopy market growth.

    Get more detailed insights about IR Spectroscopy Market Research Report - Global Forecast till 2032

    Regional Insights

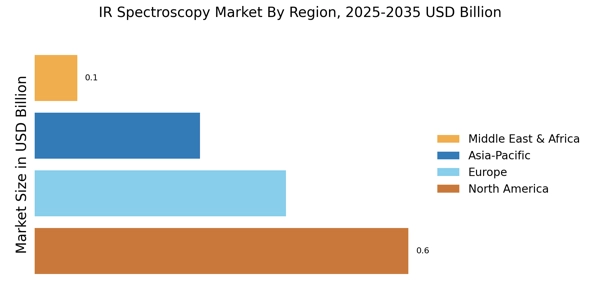
    By Region, the research provides market insights into North America, Europe, Asia-Pacific, and the Rest of the World. The North American IR spectroscopy market region contributed the highest market revenue in 2022, primarily due to upgraded Technology in this Region and infrastructural development. In addition, Governmental supportive policies help the market to flourish further.

    Further, the major countries studied in the market report are The U.S., Canada, German, France, the UK, Italy, Spain, China, Japan, India, Australia, South Korea, and Brazil.

    Figure 2: IR Spectroscopy Market Share by Region 2022 (%)

    IR Spectroscopy Market Share by Region 2022

    Source: Secondary Research, Primary Research, MRFR Database, and Analyst Review

    Europe’s IR Spectroscopy market accounts for the second-largest market share due to advanced infrastructure and highly regulated industries that require IR spectroscopy. Further, the German IR Spectroscopy market held the largest market share, and the UK IR Spectroscopy market is the fastest-growing market in the European Region.

    The Asia-Pacific IR Spectroscopy Market is expected to grow faster during the projected timeframe for IR spectroscopy. This is due to the industrial growth of industries like food and beverage, pharmaceutical, and others. Moreover, China’s IR Spectroscopy market and Japan’s IR Spectroscopy market are leading areas for IR spectroscopy in the Asia-Pacific region.

    For instance, Spectroscopy Corp (PSC) and Bio-Rad Laboratories collaborated in 2019,  IR and Raman Library, respectively, and Identification software from Bio-Rad. Strategic collaboration was done to improve the key companies’ customer reach.

    Key Players and Competitive Insights

    Leading market players are investing heavily in research and development to introduce new innovative solutions, which will help the IR Spectroscopy market to expand. Market participants are also undertaking strategic approaches, whether organic or inorganic, to expand their international presence, with important market developments including introducing new product lines, agreements, mergers and acquisitions, capex, and strategic partnerships with other organizations. To survive and grow in a hyper-competitive market, the IR Spectroscopy industry must offer cost-effective as well as sustainable options.

    Manufacturing locally to reduce operational expenses is one of the key business tactics used by industries in the global IR Spectroscopy industry to benefit customers and capture market share. IR Spectroscopy industry has offered significant advantages to the healthcare and pharma industries.

    Major players in the IR Spectroscopy market, including Thermo Fisher Scientific Inc., Agilent Technologies Inc., PerkinElmer Inc., Horiba Limited, Shimadzu Corporation, Metrohm, Bruker Corporation, Hitachi High-Technologies Corporation, Jasco, Newport Corporation, Oxford Instruments, Sartorius AG, and Teledyne Princeton Instruments, and others, are attempting to increase market share by heavily investing in research and development to upgrade their Technology and offer affordable solutions.

    Bruker Corp. creates, produces, and sells scientific tools and analytical solutions that let customers explore. Gunther Laukien created the business in 1961, with its main office in Billerica, Massachusetts. It operates in the Bruker Scientific Instruments (BSI), Bruker Energy, and Supercon Technologies (BEST) sectors. In September 2020, Canopy Biosciences, LLC, which specializes in advanced multiplex biomarker scanning for immunology and cell therapy, was purchased by Bruker Corporation. With this acquisition, Bruker could offer more fluorescence-based scanning and multi-omics imaging products.

    Since its founding in Kyoto in 1875, Shimadzu Corporation has provided cutting-edge products to clients worldwide. "Contributing to Society through Science and Technology" is Shimadzu's corporate philosophy. Over the past years, the company has accelerated and advanced its Technology, especially in MS technology. In June 2020, with RIKEN Innovation Company Ltd., Shimadzu Corporation developed new enterprises based on RIKEN research findings on brain and five sense assessment.

    Key Companies in the IR Spectroscopy Market market include

    Industry Developments

    • Q2 2024: Bruker Launches New INVENIO X FTIR Spectrometer for Advanced Research Applications Bruker announced the launch of its INVENIO X FTIR spectrometer, designed for advanced research in materials science, chemistry, and life sciences. The new instrument features enhanced sensitivity and modularity for a wide range of IR spectroscopy applications.
    • Q2 2024: Agilent Technologies Introduces Cary 630 FTIR Spectrometer with Enhanced Software Capabilities Agilent Technologies launched an updated version of its Cary 630 FTIR spectrometer, featuring new software tools for improved data analysis and compliance with regulatory standards in pharmaceutical and chemical industries.
    • Q1 2024: PerkinElmer Expands IR Spectroscopy Portfolio with New Spectrum Two+ FTIR System PerkinElmer introduced the Spectrum Two+ FTIR system, targeting quality control and academic laboratories. The new system offers improved performance and user-friendly operation for routine IR spectroscopy analysis.
    • Q2 2024: Shimadzu Launches IRSpirit-X Series FTIR Spectrophotometers for Enhanced Laboratory Productivity Shimadzu announced the release of the IRSpirit-X series FTIR spectrophotometers, designed to provide high sensitivity and compact design for pharmaceutical, food, and environmental testing laboratories.
    • Q1 2024: Thermo Fisher Scientific Unveils Nicolet Summit PRO FTIR Spectrometer for Advanced Analytical Workflows Thermo Fisher Scientific launched the Nicolet Summit PRO FTIR spectrometer, offering advanced automation and connectivity features to streamline analytical workflows in research and industrial laboratories.
    • Q2 2024: Oxford Instruments Announces Partnership with Bruker for Integrated IR Spectroscopy Solutions Oxford Instruments and Bruker entered a partnership to develop integrated IR spectroscopy solutions, combining Oxford’s cryogenic technology with Bruker’s FTIR platforms for enhanced materials characterization.
    • Q1 2024: JASCO Launches New FT/IR-4X Spectrometer for Routine and Research Applications JASCO introduced the FT/IR-4X spectrometer, designed for both routine quality control and advanced research, featuring improved sensitivity and user interface.
    • Q2 2024: HORIBA Scientific Expands IR Spectroscopy Portfolio with New LabRAM Soleil FTIR Module HORIBA Scientific launched the LabRAM Soleil FTIR module, enabling combined Raman and FTIR spectroscopy for comprehensive molecular analysis in academic and industrial research.
    • Q1 2024: Bruker Acquires IRsweep AG to Expand Quantum Cascade Laser-Based IR Spectroscopy Offerings Bruker announced the acquisition of IRsweep AG, a Swiss company specializing in quantum cascade laser-based IR spectroscopy, to enhance its portfolio of advanced IR analytical solutions.
    • Q2 2024: PerkinElmer Opens New Center of Excellence for Molecular Spectroscopy in Singapore PerkinElmer inaugurated a new Center of Excellence in Singapore, focused on molecular spectroscopy research and customer training, including IR spectroscopy technologies.

    Future Outlook

    IR Spectroscopy Market Future Outlook

    The IR Spectroscopy Market is projected to grow at a 5.79% CAGR from 2024 to 2035, driven by advancements in analytical techniques and increasing demand in pharmaceuticals.

    New opportunities lie in:

    • Develop portable IR spectroscopy devices for field analysis in environmental monitoring.
    • Invest in AI-driven data analysis tools to enhance spectral interpretation efficiency.
    • Expand applications in food safety testing to meet regulatory standards and consumer demand.

    By 2035, the IR Spectroscopy Market is expected to achieve substantial growth, reflecting its critical role in diverse industries.

    Market Segmentation

    IR Spectroscopy Product Outlook

    • Benchtop
    • Portable
    • Hyphenated
    • Others

    IR Spectroscopy Regional Outlook

    • US
    • Canada

    IR Spectroscopy Vertical Outlook

    • Healthcare
    • Pharmaceuticals
    • Chemicals
    • Research
    • Food & Beverage
    • Others

    IR Spectroscopy Technology Outlook

    • Near-Infrared Spectroscopy
    • Mid-Infrared Spectroscopy
    • Far-Infrared Spectroscopy

     IR Spectroscopy Vertical Outlook

    • Healthcare
    • Pharmaceuticals
    • Chemicals
    • Research
    • Food & Beverage
    • Others

    Report Scope

    Report Attribute/Metric Details
    Market Size 2023 USD 1.27 Billion
    Market Size 2024 USD 1.35 Billion
    Market Size 2032 USD 2.12 Billion
    Compound Annual Growth Rate (CAGR) 5.77% (2024-2032)
    Base Year 2023
    Market Forecast Period 2024-2032
    Historical Data 2019- 2021
    Market Forecast Units Value (USD Billion)
    Report Coverage Revenue Forecast, Market Competitive Landscape, Growth Factors, and Trends
    Segments Covered Technology, Product, Vertical, and Region
    Geographies Covered North America, Europe, Asia Pacific, and the Rest of the World
    Countries Covered The U.S., Canada, German, France, the UK, Italy, Spain, China, Japan, India, Australia, South Korea, and Brazil
    Key Companies Profiled Thermo Fisher Scientific Inc., Agilent Technologies Inc., PerkinElmer Inc. Horiba Limited, Shimadzu Corporation, Metrohm, Bruker Corporation Hitachi High-Technologies Corporation, Jasco, Newport Corporation, Oxford Instruments, Sartorius AG, and Teledyne Princeton Instruments.
    Key Market Opportunities Technical restrictions on IR spectroscopy and the high cost of IR spectrometers
    Key Market Dynamics Rising pharma and healthcare investments, as well as ongoing IR spectroscopy developments

    Market Highlights

    Author
    Ankit Gupta
    Senior Research Analyst

    Ankit Gupta is an analyst in market research industry in ICT and SEMI industry. With post-graduation in "Telecom and Marketing Management" and graduation in "Electronics and Telecommunication" vertical he is well versed with recent development in ICT industry as a whole. Having worked on more than 150+ reports including consultation for fortune 500 companies such as Microsoft and Rio Tinto in identifying solutions with respect to business problems his opinions are inclined towards mixture of technical and managerial aspects.

    Leave a Comment

    FAQs

    How much is the IR Spectroscopy market?

    The IR Spectroscopy Market size was valued at USD 1.27 Billion in 2023.

    What is the growth rate of the IR Spectroscopy market?

    The global IR Spectroscopy market is anticipated to grow at a CAGR of 5.77% during the forecast period of  2024-2032.

    Which Region holds the largest market share in the IR Spectroscopy market?

    North American area holds the largest share of the IR Spectroscopy Market.

    Who are the key players in the IR Spectroscopy market?

    The key players in the market are Thermo Fisher Scientific Inc., Agilent Technologies Inc., PerkinElmer Inc., Horiba Limited, Shimadzu Corporation, Metrohm, Bruker Corporation, Hitachi High-Technologies Corporation, Jasco, Newport Corporation, Oxford Instruments, Sartorius AG, and Teledyne Princeton Instruments.

    Which Technology led the IR Spectroscopy market?

    Mid-infrared Spectroscopy technology dominated the IR Spectroscopy market in 2022.

    Which Product had the largest market share in the IR Spectroscopy market?

    The Benchtop category had the largest share of the global market.

    1. Executive Summary
    2. Market Introduction
      1. Market Definition
      2. Scope of the Study
      3. Markets
    3. Structure
    4. Research Methodology
      1. Research Process
    5. Secondary Research
      1. Primary Research
      2. Forecast Model
      3. List of Assumptions
    6. Market Dynamics
      1. Introduction
      2. Drivers
        1. Rising R&D investments in healthcare
    7. & pharmaceuticals industry
      1. Rapid technological advancements
    8. in IR spectroscopy
      1. Restraints
        1. Technical limitations
    9. of IR spectroscopy
      1. Easy Availability of low-cost used IR spectroscopy
    10. devices
      1. Opportunities
        1. Adoption of NIR spectroscopy
    11. in seed quality detection
      1. Rising demand of advanced spectroscopy
    12. devices for biological research
      1. Challenge
        1. High
    13. Cost
      1. Porter’s Five Forces Analysis
        1. Threat
    14. of New Entrants
      1. Bargaining Power of Suppliers
    15. Threat of Substitutes
      1. Bargaining Power of Buyers
    16. Intensity of Rivalry
      1. Value Chain/Supply Chain Analysis
    17. Global IR Spectroscopy Market, by Technology
      1. Introduction
    18. Near-Infrared Spectroscopy
      1. Market Estimates & Forecast, 2024–2032
      2. Mid-Infrared Spectroscopy
        1. Market Estimates &
    19. Forecast, 2024–2032
      1. Far-Infrared Spectroscopy
    20. Market Estimates & Forecast, 2024–2032
    21. Global IR Spectroscopy
    22. Market, by Product Type
      1. Introduction
      2. Benchtop
        1. Market Estimates & Forecast, 2024–2032
      3. Portable
        1. Market Estimates & Forecast, 2024–2032
    23. Hyphenated
      1. Market Estimates & Forecast, 2024–2032
      2. Others
        1. Market Estimates & Forecast, 2024–2032
    24. Global IR Spectroscopy Market, by Vertical
      1. Introduction
      2. Healthcare
        1. Market Estimates & Forecast, 2024–2032
      3. Pharmaceuticals
        1. Market Estimates & Forecast,
      4. Chemicals
        1. Market Estimates &
    25. Forecast, 2024–2032
      1. Research
        1. Market Estimates
    26. & Forecast, 2024–2032
      1. Food & Beverage
    27. Market Estimates & Forecast, 2024–2032
      1. Others
        1. Market Estimates & Forecast, 2024–2032
    28. Global IR Spectroscopy
    29. Market, by Region
      1. Introduction
      2. North America
        1. Market Estimates & Forecast, by Country, 2024–2032
    30. Market Estimates & Forecast, by Technology, 2024–2032
    31. Market Estimates & Forecast, by Product Type, 2024–2032
    32. Market Estimates & Forecast, by Vertical, 2024–2032
    33. US
      1. Market Estimates & Forecast, by Technology, 2024–2032
        1. Market Estimates & Forecast, by Product Type, 2024–2032
        2. Canada
    34. Type, 2024–2032
      1. Market Estimates & Forecast, by Vertical,
        1. Mexico
    35. Forecast, by Technology, 2024–2032
      1. Market Estimates &
    36. Forecast, by Product Type, 2024–2032
      1. Market Estimates
    37. & Forecast, by Vertical, 2024–2032
      1. Europe
    38. Market Estimates & Forecast, by Country, 2024–2032
      1. Market
    39. Estimates & Forecast, by Technology, 2024–2032
      1. Market
    40. Estimates & Forecast, by Product Type, 2024–2032
      1. Market
    41. Estimates & Forecast, by Vertical, 2024–2032
      1. UK
        1. Market Estimates & Forecast, by Technology, 2024–2032
        2. Germany
    42. Type, 2024–2032
      1. Market Estimates & Forecast, by Vertical,
        1. France
    43. Forecast, by Technology, 2024–2032
      1. Market Estimates &
    44. Forecast, by Product Type, 2024–2032
      1. Market Estimates
    45. & Forecast, by Vertical, 2024–2032
      1. Italy
    46. Market Estimates & Forecast, by Technology, 2024–2032
    47. Market Estimates & Forecast, by Product Type, 2024–2032
    48. Market Estimates & Forecast, by Vertical, 2024–2032
    49. Rest of Europe
      1. Market Estimates & Forecast, by Technology,
        1. Market Estimates & Forecast, by Product
    50. Type, 2024–2032
      1. Market Estimates & Forecast, by Vertical,
      2. Asia-Pacific
        1. Market Estimates
    51. & Forecast, by Country, 2024–2032
      1. Market Estimates &
    52. Forecast, by Technology, 2024–2032
      1. Market Estimates &
    53. Forecast, by Product Type, 2024–2032
      1. Market Estimates &
    54. Forecast, by Vertical, 2024–2032
      1. China
    55. Market Estimates & Forecast, by Technology, 2024–2032
    56. Market Estimates & Forecast, by Product Type, 2024–2032
    57. Market Estimates & Forecast, by Vertical, 2024–2032
    58. Japan
      1. Market Estimates & Forecast, by Technology, 2024–2032
        1. Market Estimates & Forecast, by Product Type, 2024–2032
        2. India
    59. Type, 2024–2032
      1. Market Estimates & Forecast, by Vertical,
        1. Rest of Asia-Pacific
    60. Estimates & Forecast, by Technology, 2024–2032
      1. Market
    61. Estimates & Forecast, by Product Type, 2024–2032
      1. Market
    62. Estimates & Forecast, by Vertical, 2024–2032
      1. Rest of the
    63. World
      1. Market Estimates & Forecast, by, Country, 2024–2032
        1. Market Estimates & Forecast, by Technology, 2024–2032
        2. Market Estimates & Forecast, by Product Type, 2024–2032
        3. Market Estimates & Forecast, by Vertical, 2024–2032
        4. Middle East & Africa
    64. Forecast, by Technology, 2024–2032
      1. Market Estimates &
    65. Forecast, by Product Type, 2024–2032
      1. Market Estimates
    66. & Forecast, by Vertical, 2024–2032
      1. South America
        1. Market Estimates & Forecast, by Technology, 2024–2032
    67. Competitive Landscape
      1. Competitor Strategy Dashboard
    68. Competitive Benchmarking
      1. Vendor Share Analysis
    69. Company
    70. Profiles
      1. Shimadzu Corporation
        1. Company Overview
        2. Product Type/Business Segment Overview
        3. Financial
    71. Updates
      1. Key Developments
        1. SWOT Analysis
        2. Key Strategies
      2. Agilent Technologies, Inc.
        1. Company Overview
        2. Product Type/Business Segment Overview
        3. Financial Updates
        4. Key Developments
    72. SWOT Analysis
      1. Key Strategies
      2. Bruker Corporation
        1. Company Overview
        2. Product Type/Business Segment
    73. Overview
      1. Financial Updates
        1. Key Developments
        2. SWOT Analysis
        3. Key Strategies
    74. Horiba Limited
      1. Company Overview
        1. Product Type/Business
    75. Segment Overview
      1. Financial Updates
        1. Key Developments
        2. SWOT Analysis
        3. Key Strategies
    76. PerkinElmer, Inc.
      1. Company Overview
        1. Product
    77. Type/Business Segment Overview
      1. Financial Updates
    78. Key Developments
      1. SWOT Analysis
        1. Key Strategies
      2. Thermo Fisher Scientific
        1. Company Overview
        2. Product Type/Business Segment Overview
        3. Financial Updates
        4. Key Developments
        5. SWOT Analysis
    79. Key Strategies
      1. Hitachi High-Technologies Corporation
    80. Company Overview
      1. Product Type/Business Segment Overview
        1. Financial Updates
        2. Key Developments
    81. SWOT Analysis
      1. Key Strategies
      2. Sartorius AG
        1. Company Overview
        2. Product Type/Business Segment
    82. Overview
      1. Financial Updates
        1. Key Developments
        2. SWOT Analysis
        3. Key Strategies
    83. Teledyne Princeton Instruments
      1. Company Overview
    84. Product Type/Business Segment Overview
      1. Financial Updates
        1. Key Developments
        2. SWOT Analysis
        3. Key
    85. Strategies
      1. Oxford Instruments
        1. Company Overview
        2. Product Type/Business Segment Overview
        3. Financial
    86. Updates
      1. Key Developments
        1. SWOT Analysis
        2. Key Strategies
      2. Metrohm
        1. Company
    87. Overview
      1. Product Type/Business Segment Overview
    88. Financial Updates
      1. Key Developments
        1. SWOT
    89. Analysis
      1. Key Strategies
    90. North America: IR Spectroscopy Market, by Country, 2024–2032
    91. Europe: IR Spectroscopy Market, by Country, 2024–2032
    92. IR Spectroscopy Market, by Country, 2024–2032
    93. IR Spectroscopy Market, by Country, 2024–2032
    94. IR Spectroscopy Market, by Country, 2024–2032
    95. IR Spectroscopy Market, by Technology, 2024–2032
    96. IR Spectroscopy Market, by Product Type, 2024–2032
    97. America: IR Spectroscopy Market, by Vertical, 2024–2032
    98. Europe: IR Spectroscopy Market, by Country, 2024–2032
    99. IR Spectroscopy Market, by Technology, 2024–2032
    100. IR Spectroscopy Market, by Product Type, 2024–2032
    101. IR Spectroscopy Market, by Vertical, 2024–2032
    102. IR Spectroscopy Market, by Country, 2024–2032
    103. IR Spectroscopy Market, by Technology, 2024–2032
    104. IR Spectroscopy Market, by Product Type, 2024–2032
    105. IR Spectroscopy Market, by Vertical, 2024–2032
    106. & Africa: IR Spectroscopy Market, by Country, 2024–2032
    107. Middle East & Africa: IR Spectroscopy Market, by Technology, 2024–2032
    108. by Vertical, 2024–2032
    109. by Country, 2024–2032
    110. by Technology, 2024–2032
    111. Market, by Product Type, 2024–2032
    112. Market, by Vertical, 2024–2032
    113. Market Segmentation
    114. Porter’s Five Forces Analysis of the Global IR Spectroscopy Market
    115. Share of the Global IR Spectroscopy Market in 2023, by country (in %)
    116. Global IR Spectroscopy Market, 2024–2032
    117. Global IR Spectroscopy Market by Industry, 2024–2032
    118. IR Spectroscopy Market Size, by Technology, 2023
    119. Global IR Spectroscopy Market, by Technology, 2024–2032
    120. Global IR Spectroscopy Market Size, by Product Type, 2023
    121. Share of the Global IR Spectroscopy Market, by Product Type, 2024–2032

    IR Spectroscopy Market Segmentation

    Market Segmentation Overview

    • Detailed segmentation data will be available in the full report
    • Comprehensive analysis by multiple parameters
    • Regional and country-level breakdowns
    • Market size forecasts by segment
    IR Spectroscopy Market Research Report - Global Forecast till 2032 Infographic
    Free Sample Request

    Kindly complete the form below to receive a free sample of this Report

    Customer Strories

    “I am very pleased with how market segments have been defined in a relevant way for my purposes (such as "Portable Freezers & refrigerators" and "last-mile"). In general the report is well structured. Thanks very much for your efforts.”

    Victoria Milne Founder
    Case Study

    Chemicals and Materials