Digestible Sensors Market Segmentation
Digestible Sensors Market By Product (USD Billion, 2025-2035)
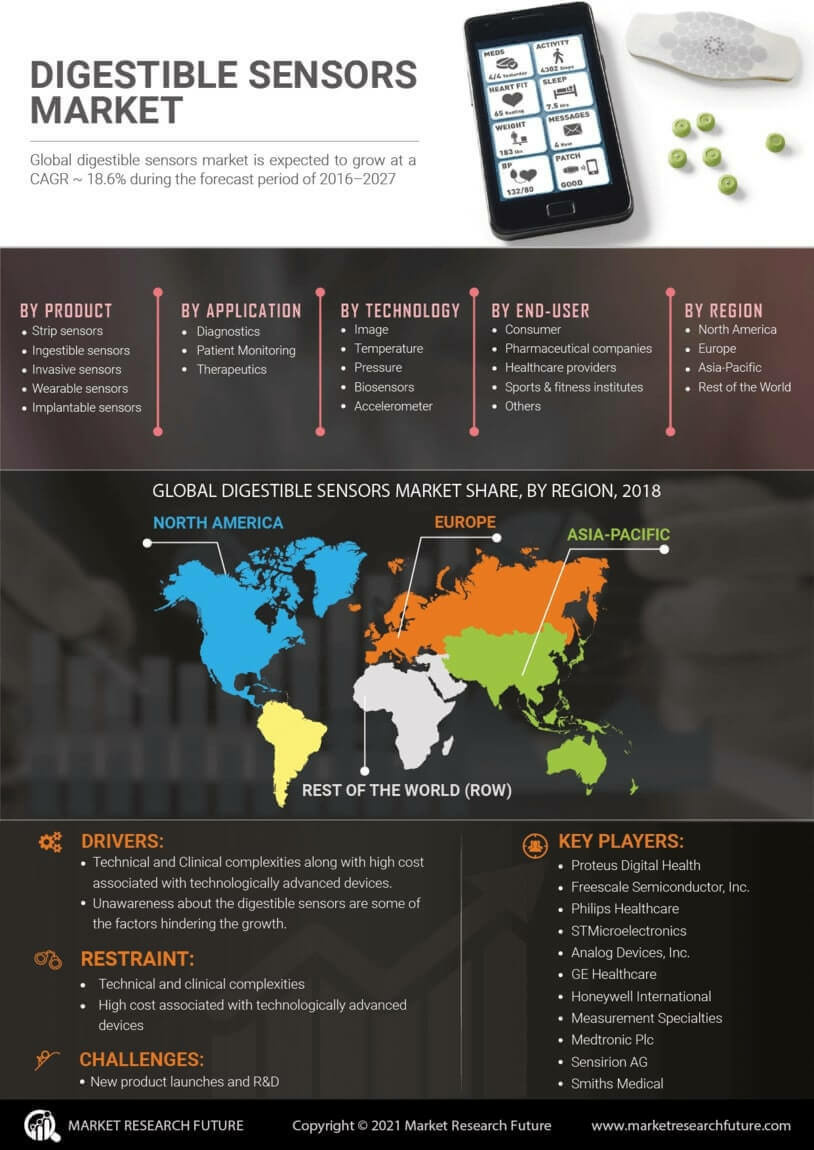
- Strip sensors
- Wearable sensors
- Implantable sensors
- Invasive sensors
- Ingestible sensors
Digestible Sensors Market By Application (USD Billion, 2025-2035)
- Therapeutics
- Diagnostics
- Patient monitoring
Digestible Sensors Market By Technology (USD Billion, 2025-2035)
- Sensor
- Accelerometer
- Temperature
- Image
- Pressure
Digestible Sensors Market By End-Users (USD Billion, 2025-2035)
- Sports and fitness
- Consumer
- Digestible Sensors Market
- Digestible Sensors Market providers