ID: MRFR/CnM/9378-HCR | August 2022 | Region: Global | 100 Pages
TABLE OF CONTENTS
1 Executive Summary
2 Scope of the Report
2.1 Market Definition
2.2 Scope of the Study
2.3 List of Assumptions
2.4 Markets Structure
3 Market Research Methodology
3.1 Research Process
3.2 Primary Research
3.3 Secondary Research
3.4 Market Size Estimation
3.5 Forecast Model
4 Market Dynamics of Global Crude-to-chemicals Market
4.1 Introduction
4.2 Drivers
4.3 Restraints
4.4 Opportunities
4.5 Challenges
5 Market Factor Analysis
5.1 Supply Chain Analysis
5.1.1 Raw Form Suppliers
5.1.2 Manufacturers/Service Providers of Crude-to-chemicals
5.1.3 Distributors/Retailers/Wholesalers/E-Commerce Merchants
5.1.4 End-Use Industries
5.2 Porterβs Five Forces Model
5.2.1 Threat of New Entrants
5.2.2 Intensity of Competitive Rivalry
5.2.3 Threat of Substitutes
5.2.4 Bargaining Power of Suppliers
5.2.5 Bargaining Power of Buyers
5.3 Pricing Analysis
5.4 Impact of Covid-19 on the global crude-to-chemicals market
6 Global Crude-to-chemicals Market, by Technology
6.1 Introduction
6.2 Steam Cracking Technology
6.2.1 Market Estimates & Forecast, 2019β2030
6.2.2 Market Estimates & Forecast, by Region, 2019β2030
6.3 De-asphalting Technology
6.3.1 Market Estimates & Forecast, 2019β2030
6.3.2 Market Estimates & Forecast, by Region, 2019β2030
6.4 Hydrocracking Technology
6.4.1 Market Estimates & Forecast, 2019β2030
6.4.2 Market Estimates & Forecast, by Region, 2019β2030
7 Global Crude-to-chemicals Market, by Application
7.1 Introduction
7.2 Adhesives & Sealants
7.2.1 Market Estimates & Forecast, 2019β2030
7.2.2 Market Estimates & Forecast, by Region, 2019β2030
7.3 Polymers
7.3.1 Market Estimates & Forecast, 2019β2030
7.3.2 Market Estimates & Forecast, by Region, 2019β2030
7.4 Paints & Coatings
7.4.1 Market Estimates & Forecast, 2019β2030
7.4.2 Market Estimates & Forecast, by Region, 2019β2030
7.5 Dyes
7.5.1 Market Estimates & Forecast, 2019β2030
7.5.2 Market Estimates & Forecast, by Region, 2019β2030
7.6 Surfactants
7.6.1 Market Estimates & Forecast, 2019β2030
7.6.2 Market Estimates & Forecast, by Region, 2019β2030
7.7 Rubber
7.7.1 Market Estimates & Forecast, 2019β2030
7.7.2 Market Estimates & Forecast, by Region, 2019β2030
7.8 Solvent
7.8.1 Market Estimates & Forecast, 2019β2030
7.8.2 Market Estimates & Forecast, by Region, 2019β2030
7.9 Others
7.9.1 Market Estimates & Forecast, 2019β2030
7.9.2 Market Estimates & Forecast, by Region, 2019β2030
8 Global Crude-to-chemicals Market, by End-Use Industry
8.1 Introduction
8.2 Automotive & Transportation
8.2.1 Market Estimates & Forecast, 2019β2030
8.2.2 Market Estimates & Forecast, by Region, 2019β2030
8.3 Building & Construction
8.3.1 Market Estimates & Forecast, 2019β2030
8.3.2 Market Estimates & Forecast, by Region, 2019β2030
8.4 Electrical & Electronics
8.4.1 Market Estimates & Forecast, 2019β2030
8.4.2 Market Estimates & Forecast, by Region, 2019β2030
8.5 Healthcare
8.5.1 Market Estimates & Forecast, 2019β2030
8.5.2 Market Estimates & Forecast, by Region, 2019β2030
8.6 Others
8.6.1 Market Estimates & Forecast, 2019β2030
8.6.2 Market Estimates & Forecast, by Region, 2019β2030
9 Global Crude-to-chemicals Market, by Region
9.1 Introduction
9.2 North America
9.2.1 Market Estimates & Forecast, 2019β2030
9.2.2 Market Estimates & Forecast, by Technology, 2019β2030
9.2.3 Market Estimates & Forecast, by Application, 2019β2030
9.2.4 Market Estimates & Forecast, by End-Use Industry, 2019β2030
9.2.5 US
9.2.5.1 Market Estimates & Forecast, 2019β2030
9.2.5.2 Market Estimates & Forecast, by Technology, 2019β2030
9.2.5.3 Market Estimates & Forecast, by Application, 2019β2030
9.2.5.4 Market Estimates & Forecast, by End-Use Industry, 2019β2030
9.2.6 Canada
9.2.6.1 Market Estimates & Forecast, 2019β2030
9.2.6.2 Market Estimates & Forecast, by Technology, 2019β2030
9.2.6.3 Market Estimates & Forecast, by Application, 2019β2030
9.2.6.4 Market Estimates & Forecast, by End-Use Industry, 2019β2030
9.3 Europe
9.3.1 Market Estimates & Forecast, 2019β2030
9.3.2 Market Estimates & Forecast, by Technology, 2019β2030
9.3.3 Market Estimates & Forecast, by Application, 2019β2030
9.3.4 Market Estimates & Forecast, by End-Use Industry, 2019β2030
9.3.5 Germany
9.3.5.1 Market Estimates & Forecast, 2019β2030
9.3.5.2 Market Estimates & Forecast, by Technology, 2019β2030
9.3.5.3 Market Estimates & Forecast, by Application, 2019β2030
9.3.5.4 Market Estimates & Forecast, by End-Use Industry, 2019β2030
9.3.6 France
9.3.6.1 Market Estimates & Forecast, 2019β2030
9.3.6.2 Market Estimates & Forecast, by Technology, 2019β2030
9.3.6.3 Market Estimates & Forecast, by Application, 2019β2030
9.3.6.4 Market Estimates & Forecast, by End-Use Industry, 2019β2030
9.3.7 Italy
9.3.7.1 Market Estimates & Forecast, 2019β2030
9.3.7.2 Market Estimates & Forecast, by Technology, 2019β2030
9.3.7.3 Market Estimates & Forecast, by Application, 2019β2030
9.3.7.4 Market Estimates & Forecast, by End-Use Industry, 2019β2030
9.3.8 Spain
9.3.8.1 Market Estimates & Forecast, 2019β2030
9.3.8.2 Market Estimates & Forecast, by Technology, 2019β2030
9.3.8.3 Market Estimates & Forecast, by Application, 2019β2030
9.3.8.4 Market Estimates & Forecast, by End-Use Industry, 2019β2030
9.3.9 UK
9.3.9.1 Market Estimates & Forecast, 2019β2030
9.3.9.2 Market Estimates & Forecast, by Technology, 2019β2030
9.3.9.3 Market Estimates & Forecast, by Application, 2019β2030
9.3.9.4 Market Estimates & Forecast, by End-Use Industry, 2019β2030
9.3.10 Russia
9.3.10.1 Market Estimates & Forecast, 2019β2030
9.3.10.2 Market Estimates & Forecast, by Technology, 2019β2030
9.3.10.3 Market Estimates & Forecast, by Application, 2019β2030
9.3.10.4 Market Estimates & Forecast, by End-Use Industry, 2019β2030
9.3.11 Rest of Europe
9.3.11.1 Market Estimates & Forecast, 2019β2030
9.3.11.2 Market Estimates & Forecast, by Technology, 2019β2030
9.3.11.3 Market Estimates & Forecast, by Application, 2019β2030
9.3.11.4 Market Estimates & Forecast, by End-Use Industry, 2019β2030
9.4 Asia-Pacific
9.4.1 Market Estimates & Forecast, 2019β2030
9.4.2 Market Estimates & Forecast, by Technology, 2019β2030
9.4.3 Market Estimates & Forecast, by Application, 2019β2030
9.4.4 Market Estimates & Forecast, by End-Use Industry, 2019β2030
9.4.5 China
9.4.5.1 Market Estimates & Forecast, 2019β2030
9.4.5.2 Market Estimates & Forecast, by Technology, 2019β2030
9.4.5.3 Market Estimates & Forecast, by Application, 2019β2030
9.4.5.4 Market Estimates & Forecast, by End-Use Industry, 2019β2030
9.4.6 India
9.4.6.1 Market Estimates & Forecast, 2019β2030
9.4.6.2 Market Estimates & Forecast, by Technology, 2019β2030
9.4.6.3 Market Estimates & Forecast, by Application, 2019β2030
9.4.6.4 Market Estimates & Forecast, by End-Use Industry, 2019β2030
9.4.7 Japan
9.4.7.1 Market Estimates & Forecast, 2019β2030
9.4.7.2 Market Estimates & Forecast, by Technology, 2019β2030
9.4.7.3 Market Estimates & Forecast, by Application, 2019β2030
9.4.7.4 Market Estimates & Forecast, by End-Use Industry, 2019β2030
9.4.8 South Korea
9.4.8.1 Market Estimates & Forecast, 2019β2030
9.4.8.2 Market Estimates & Forecast, by Technology, 2019β2030
9.4.8.3 Market Estimates & Forecast, by Application, 2019β2030
9.4.8.4 Market Estimates & Forecast, by End-Use Industry, 2019β2030
9.4.9 Australia & New Zealand
9.4.9.1 Market Estimates & Forecast, 2019β2030
9.4.9.2 Market Estimates & Forecast, by Application, 2019β2030
9.4.9.3 Market Estimates & Forecast, by End-Use Industry, 2019β2030
9.4.10 Rest of Asia-Pacific
9.4.10.1 Market Estimates & Forecast, 2019β2030
9.4.10.2 Market Estimates & Forecast, by Application, 2019β2030
9.4.10.3 Market Estimates & Forecast, by End-Use Industry, 2019β2030
9.5 Middle East & Africa
9.5.1 Market Estimates & Forecast, 2019β2030
9.5.2 Market Estimates & Forecast, by Technology, 2019β2030
9.5.3 Market Estimates & Forecast, by Application, 2019β2030
9.5.4 Market Estimates & Forecast, by End-Use Industry, 2019β2030
9.5.5 Turkey
9.5.5.1 Market Estimates & Forecast, 2019β2030
9.5.5.2 Market Estimates & Forecast, by Technology, 2019β2030
9.5.5.3 Market Estimates & Forecast, by Application, 2019β2030
9.5.5.4 Market Estimates & Forecast, by End-Use Industry, 2019β2030
9.5.6 South Africa
9.5.6.1 Market Estimates & Forecast, 2019β2030
9.5.6.2 Market Estimates & Forecast, by Technology, 2019β2030
9.5.6.3 Market Estimates & Forecast, by Application, 2019β2030
9.5.6.4 Market Estimates & Forecast, by End-Use Industry, 2019β2030
9.5.7 GCC
9.5.7.1 Market Estimates & Forecast, 2019β2030
9.5.7.2 Market Estimates & Forecast, by Technology, 2019β2030
9.5.7.3 Market Estimates & Forecast, by Application, 2019β2030
9.5.7.4 Market Estimates & Forecast, by End-Use Industry, 2019β2030
9.5.8 Rest of the Middle East & Africa
9.5.8.1 Market Estimates & Forecast, 2019β2030
9.5.8.2 Market Estimates & Forecast, by Technology, 2019β2030
9.5.8.3 Market Estimates & Forecast, by Application, 2019β2030
9.5.8.4 Market Estimates & Forecast, by End-Use Industry, 2019β2030
9.6 Latin America
9.6.1 Market Estimates & Forecast, 2019β2030
9.6.2 Market Estimates & Forecast, by Technology, 2019β2030
9.6.3 Market Estimates & Forecast, by Application, 2019β2030
9.6.4 Market Estimates & Forecast, by End-Use Industry, 2019β2030
9.6.5 Brazil
9.6.5.1 Market Estimates & Forecast, 2019β2030
9.6.5.2 Market Estimates & Forecast, by Technology, 2019β2030
9.6.5.3 Market Estimates & Forecast, by Application, 2019β2030
9.6.5.4 Market Estimates & Forecast, by End-Use Industry, 2019β2030
9.6.6 Argentina
9.6.6.1 Market Estimates & Forecast, 2019β2030
9.6.6.2 Market Estimates & Forecast, by Technology, 2019β2030
9.6.6.3 Market Estimates & Forecast, by Application, 2019β2030
9.6.6.4 Market Estimates & Forecast, by End-Use Industry, 2019β2030
9.6.7 Mexico
9.6.7.1 Market Estimates & Forecast, 2019β2030
9.6.7.2 Market Estimates & Forecast, by Technology, 2019β2030
9.6.7.3 Market Estimates & Forecast, by Application, 2019β2030
9.6.7.4 Market Estimates & Forecast, by End-Use Industry, 2019β2030
9.6.8 Rest of Latin America
9.6.8.1 Market Estimates & Forecast, 2019β2030
9.6.8.2 Market Estimates & Forecast, by Technology, 2019β2030
9.6.8.3 Market Estimates & Forecast, by Application, 2019β2030
9.6.8.4 Market Estimates & Forecast, by End-Use Industry, 2019β2030
10 Competitive Landscape
10.1 Introduction
10.2 Market Key Strategies
10.3 Competitive Benchmarking
10.4 Key Development Analysis (Expansions/Mergers & Acquisitions/Joint Ventures/ Developments/Agreements/Investments)
11 Company Profiles
11.1 Saudi Aramco
11.1.1 Company Overview
11.1.2 Financial Overview
11.1.3 Products/Services Offered
11.1.4 Key Developments
11.1.5 SWOT Analysis
11.1.6 Key Strategies
11.2 Sinopec
11.3 Hengli Petrochemical
11.4 Shell
11.5 ExxonMobil
11.6 Reliance Industries
11.7 Total
11.8 Others
12 Appendix
β
LIST OF TABLES
Table 1: Global Crude-to-chemicals Market, by Region, 2019β2030
Table 2: North America: Crude-to-chemicals Market, by Country, 2019β2030
Table 3: Europe: Crude-to-chemicals Market, by Country, 2019β2030
Table 4: Asia-Pacific: Crude-to-chemicals Market, by Country, 2019β2030
Table 5: Middle East & Africa: Crude-to-chemicals Market, by Country, 2019β2030
Table 6: Latin America: Crude-to-chemicals Market, by Country, 2019β2030
Table 7: Global Crude-to-chemicals Market, by Region, 2019β2030
Table 8: North America: Crude-to-chemicals Market, by Country, 2019β2030
Table 9: Europe: Crude-to-chemicals Market, by Country, 2019β2030
Table 10: Asia-Pacific: Crude-to-chemicals Market, by Country, 2019β2030
Table 11: Middle East & Africa: Crude-to-chemicals Market, by Country, 2019β2030
Table 12: Latin America: Crude-to-chemicals Market, by Country, 2019β2030
Table 13: Global Crude-to-chemicalsType Market, by Region, 2019β2030
Table 14: North America: Crude-to-chemicalsType Market, by Country, 2019β2030
Table 15: Europe: Crude-to-chemicalsType Market, by Country, 2019β2030
Table 16: Asia-Pacific: Crude-to-chemicalsType Market, by Country, 2019β2030
Table 17: Middle East & Africa: Crude-to-chemicalsType Market, by Country, 2019β2030
Table 18: Latin America: Crude-to-chemicalsType Market, by Country, 2019β2030
Table 19: Global Crude-to-chemicals Application Market, by Region, 2019β2030
Table 20: North America: Crude-to-chemicals Application Market, by Country, 2019β2030
Table 21: Europe: Crude-to-chemicals Application Market, by Country, 2019β2030
Table 22: Asia-Pacific: Crude-to-chemicals Application Market, by Country, 2019β2030
Table 23: Middle East & Africa: Crude-to-chemicals Application Market, by Country, 2019β2030
Table 24: Latin America: Crude-to-chemicals Application Market, by Country, 2019β2030
Table 25: Global Crude-to-chemicals Type Market, by Region, 2019β2030
Table 26: Global Crude-to-chemicals Application Market, by Region, 2019β2030
Table 27: North America: Crude-to-chemicals Market, by Country, 2019β2030
Table 28: North America: Crude-to-chemicals Market, by Source 2019β2030
Table 29: North America: Crude-to-chemicals Market, by Application, 2019β2030
Table 30: North America: Crude-to-chemicals Market, by End-Use Industry, 2019β2030
Table 31: Europe: Crude-to-chemicals Market, by Country, 2019β2030
Table 32: Europe: Crude-to-chemicals Market, by Application, 2019β2030
Table 33: Europe: Crude-to-chemicals Market, by End-Use Industry, 2019β2030
Table 34: Asia-Pacific: Crude-to-chemicals Market, by Country, 2019β2030
Table 35: Asia-Pacific: Crude-to-chemicals Market, by Application, 2019β2030
Table 36: Asia-Pacific: Crude-to-chemicals Market, by End-Use Industry, 2019β2030
Table 37: Middle East & Africa: Crude-to-chemicals Market, by Country, 2019β2030
Table 38: Middle East & Africa: Crude-to-chemicals Market, by Application, 2019β2030
Table 39: Middle East & Africa: Crude-to-chemicals Market, by End-Use Industry, 2019β2030
Table 40: Latin America: Crude-to-chemicals Market, by Country, 2019β2030
Table 41: Latin America: Crude-to-chemicals Market, by Application, 2019β2030
Table 42: Latin America: Crude-to-chemicals Market, by End-Use Industry, 2019β2030
LIST OF FIGURES
FIGURE 1 Global Crude-to-chemicals Market Segmentation
FIGURE 2 Forecast Research Methodology
FIGURE 3 Porterβs Five Forces Analysis of Global Crude-to-chemicals Market
FIGURE 4 Value Chain/Supply Chain of Global Crude-to-chemicals Market
FIGURE 5 Share of Global Crude-to-chemicals Market, by Country, 2020 (%)
FIGURE 6 Global Crude-to-chemicals Market, 2019β2030
FIGURE 7 Global Crude-to-chemicals Market Size, by Application, 2019β2030
FIGURE 8 Share of Global Crude-to-chemicals Market, by Application, 2020 (%)
FIGURE 9 Global Crude-to-chemicals Market Size, by End-Use Industry, 2019β2030
FIGURE 10 Share of Global Crude-to-chemicals Market, by End-Use Industry, 2020 (%)
$800 Billion
7.34%
Asia-Pacific
2022β2030
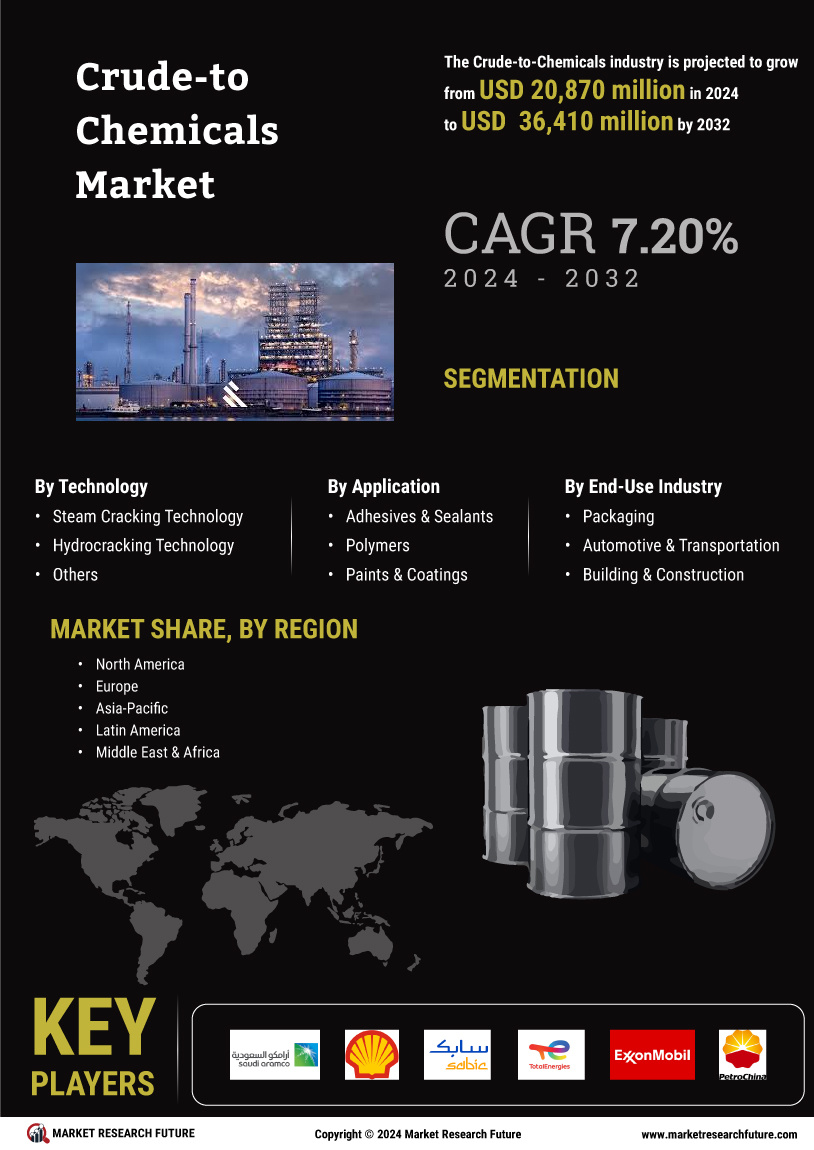
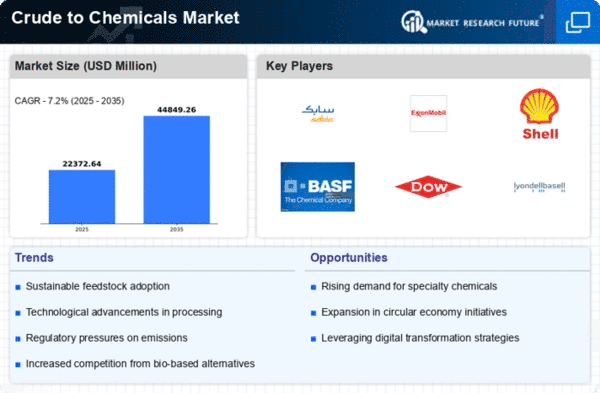
The global crude-to-chemicals market size is projected to be worth USD 800 billion by 2030, registering a CAGR of 7.34% during the forecast period (2022–2030).
Crude-to-chemicals continues to be a powerful market with a strong trend of high interest to all integrated refineries and chemicals producers in majorly China, the Middle East, and Eastern Europe. This is reinforced by many factors, most notably the forecasts which predict a slowing of transportation fuels growth approaching due to hybrid and electric vehicles, while growth in chemicals is expected to increase as populations and middle class wealth continue to rise, leading to increasing demand for packaging, consumer goods, and automobiles.
COVID-19 Impact on the Crude-to-chemicals Market:
The rapid spread of COVID-19 is causing significant disruption to a wide range of industries across the globe. Some of the major crude-to-chemicals end-users include the automotive & transportation, building & construction, and electrical & electronics industries. As these industries come under essential services, the impact of COVID-19 was not as worse as other industries.
In 2020, the COVID-19 pandemic had no significant impact on the fertilizers industry as most countries consider the fertilizers industry and related agricultural businesses essential. The outbreak of COVID-19 has significantly impacted the chemicals & materials supply chains, mining operations, international trade, and manufacturing processes across the world. As a result of a lockdown across geographies, the production facilities have faced disruptions. The market players have had to shut production facilities or operate the facilities below the optimal production capacities to prevent the spread of COVID-19. Plastics, the most well-known group of goods made out of crude-to-chemicals, and have outperformed all other bulk materials in terms of demand (such as steel, aluminum, or cement). More than half of ammonia is turned to urea, which is primarily utilized as a fertilizer to raise agricultural yields and food production worldwide. The industry value pool fell in 2019 due to major capacity increases and slower demand growth. The pandemic, which began in 2020, has accelerated this decline. The impact of the novel coronavirus on crude-to-chemicals demand was uneven throughout value chains, with sharp drops in automotive and construction applications. Other value chains, such as polyurethanes (used for flexible and rigid foam panels, seals, and gaskets), showed a fall in demand. In contrast, polyethylene players (which make products such as plastic containers for milk, motor oil, and shampoos) remained robust. On the other hand, several chemical manufacturers modified their existing factories to satisfy the rising demand for isopropyl alcohol and ethanol.
Market Dynamics
Crude-to-chemicals are used as raw materials in the manufacturing of plastics in the. The polyethylene that is produced from ethylene can be hard, soft, and pliable. Soft and pliable polyethylene is commonly used as a raw material for flexible plastic products. However, hard polyethylene is used as a material for rigid plastic products. With the increase in demand for plastics, the demand for ethylene is expected to increase in the coming years, consequently boosting the demand for crude-to-chemicals.
Crude-to-chemicals, when released into the environment by the means of refining pricess, have a significant negative impact. These materials are usually olefins, aromatic compounds, alcohols, or hydrocarbon chains. Although crude-to-chemicals are used as raw materials in innumerable products, they are hazardous to the ecosystem. Aromatic compounds present in the crude-to-chemicals are the major source of environmental pollutants that may be introduced into the environment through industrial waste products, natural oil seeps, emissions, accidental spills from oil tankers, oil storage and coal tar processing waste, and petrochemical industrial effluents.
The crude-to-chemical manufacturers across the globe are adopting novel technologies, such as coal to olefins (CTO), methanol to olefin (MTO), and shale gas technology, for producing olefins, instead of using valuable products such as naphtha as a raw material. CTO technology uses low-cost feedstock such as coal, which is a residue of the crude oil refining process, to derive olefins such as ethylene or propylene. MTO technology uses methanol, which is either derived from natural gas or coal, to produce olefins. Thus, the use of new technologies is projected to create lucrative opportunities for the manufacturers of crude-to-chemicals during the forecast period.
The brent crude oil prices have risen notably between 2016–2021. Over the last 25 years, a sharp increase and decrease in prices have periodically affected the global crude oil market. Fluctuating crude oil prices have affected the production of crude-to-chemicals, which is estimated to be the major challenge for the manufacturers operating in the global crude-to-chemicals market during the forecast period.
Segmentation
By Technology
By Application
By End-use Industry
Regional Analysis
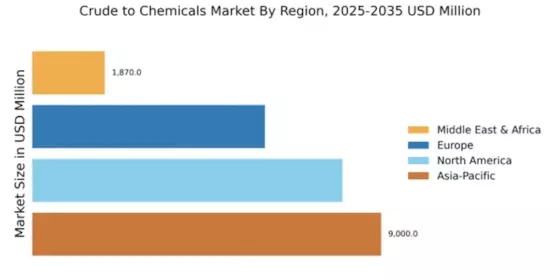
The Asia-Pacific market accounted for the largest share, by value and volume, followed by the North America and Europe markets in 2021. The market in Asia-Pacific offers opportunities for growth to manufacturers and is slated to register the highest CAGR. This growth can be mainly attributed to the increase in government investments, expansion of production capacity, a collaboration of key players in the region, and high demand from end-use industries. Further, China emerged as one of the largest producers and consumers of crude-to-chemicals. China’s investment has been majorly focused on crude-to-chemicals production and on-purpose propylene processes.
North America accounted for the second-largest market. The growth in the North America crude-to-chemicals market is mainly attributed to the shale gas discoveries in the US and Canada, which has significantly increased the supply of natural gas liquids, transforming North America into a low-cost region for the production of chemicals. Furthermore, a large number of global companies are planning to expand and build new facilities in the region. The growth in Europe can be mostly attributed to technological advancements, a well-developed crude-to-chemical industry, and a large number of sophisticated refineries.
Competitive Landscape
The global crude-to-chemicals market is expected to showcase healthy growth throughout the forecast period. The global market represents strong numbers in terms of consumption and is expected to grow year on year. The global crude-to-chemicals market is highly fragmented, with a majority presence of tier-1 players.
Some of the key players operating in the global crude-to-chemicals market are Saudi Arabian Oil Co., Shell Global, Indian Oil Corporation Ltd., ExxonMobil, Sinopec, Hengli Petrochemical, Reliance Industries, and Total.
Some of the key developments include:
Report Overview:
The crude-to-chemicals market is segmented by technology, application, end-use industry, and region in the report. In terms of insights, this report has focused on various levels of analysis such as market dynamics, value chain analysis, Porter's five forces, competitive landscape, and company profiles—all of which comprise and discuss views on the global crude-to-chemicals emerging and fast-growing segments, regions, and countries.
Objectives of the Study
Intended Audience
Report Attribute/Metric | Details |
---|---|
Market Size | 2030: USD 800 Billion |
CAGR | 7.34% CAGR (2022-2030) |
Base Year | 2021 |
Forecast Period | 2022-2030 |
Historical Data | 2019 |
Forecast Units | Value (USD Million) & Volume (Million Tons) |
Report Coverage | Revenue Forecast, Competitive Landscape, Growth Factors, and Trends |
Segments Covered | Technology, Application, and End-use Industry |
Geographies Covered | North America, Europe, Asia-Pacific, Latin America, and the Middle East and Africa |
Key Vendors | Saudi Arabian Oil Co., Shell Global, Indian Oil Corporation Ltd., ExxonMobil, Sinopec, Hengli Petrochemical, Reliance Industries, and Total |
Key Market Opportunities | Adoption of Novel Technologies |
Key Market Drivers | β’ Increasing Use of Polymers in the Automotive Industry β’ Growing Demand for Paints & Coatings |
Frequently Asked Questions (FAQ) :
The global crude-to-chemicals market would register a growth of 7.34%.
The atutomotive & transportation industry will play a prominent role in taking the market forward.
Increasing environmental concerns could restrain the market.
Asia-Pacific would enjoy the upper hand in the crude-to-chemicals market.
China, as the largest consumer, would set the trend.