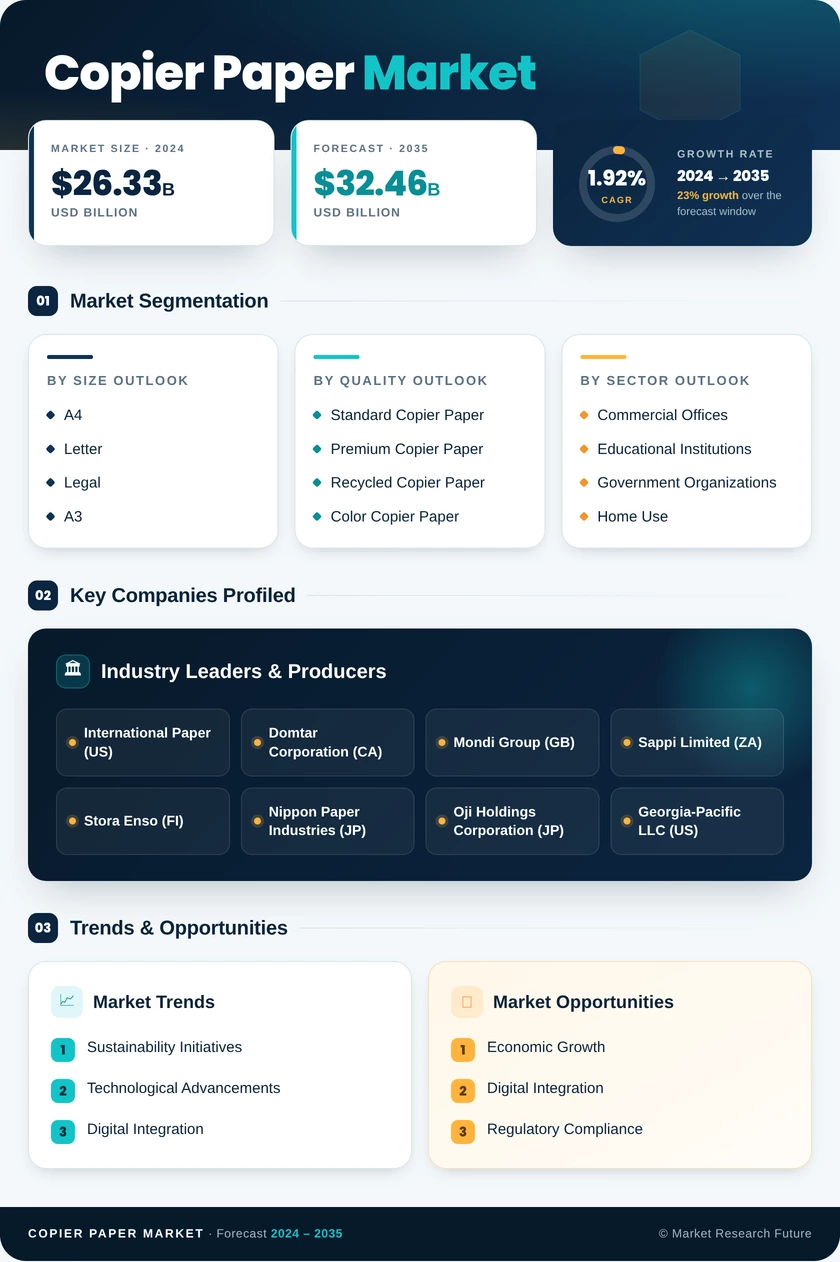
Copier Paper Market (2026 - 2035)

ID: MRFR/PCM/30306-HCR 111 Pages Snehal Singh Last Updated: October 24, 2026
Copier Paper Market Research Report Information By Paper Size (A4, A3, Letter, and Legal/Folio), By Raw Material (Virgin Wood Pulp and Recycled Fibre), By End User (Corporate and Commercial Offices, Educational Institutions, Government and Public Sector, Home and SOHO, and Print-for-Pay / Copy Shops), and By Distribution Channel (B2B/Wholesale, Stationery/Retail Stores, and Online Retail and E-procurement) – Forecast Till 2035
Copier Paper Market
Market Size
Forecast Period2026-2035
CAGR (2026-2035)1.73%
2025 Market SizeUSD 18,940 Million
2035 Market SizeUSD 22,483 Million
Key Players
International Paper
Sylvamo
Asia Pulp & Paper
Mondi
Stora Enso
UPM
Opportunities
  • De-Inked Pulp Capacity in Regulated Markets
  • Middle East and Africa Distribution Gap
  • Subscription Replenishment and Consumption Data Monetisation
  1. 1 Market Summary | |
    1. 1.1 Study Assumptions & Market Definition | |
    2. 1.2 Scope of the Study | |
    3. 1.3 Research Methodology | |
  2. 2 Key Report Takeaways | |
    1. 2.1 By Paper Size | |
    2. 2.2 By Raw Material | |
    3. 2.3 By End User | |
    4. 2.4 By Distribution Channel | |
    5. 2.5 By Region | |
  3. 3 Market Size and Forecast (2021–2035) | |
    1. 3.1 Historical Market Size (2021–2024) | |
    2. 3.2 Base Year Assessment (2025) | |
    3. 3.3 Forecast Market Size (2026–2035) | |
    4. 3.4 Year-over-Year Growth Analysis | |
  4. 4 Driver Impact Analysis | |
    1. 4.1 Institutional and Examination Printing Mandates | |
    2. 4.2 Sustainable Procurement Rules Favouring Certified Fibre | |
    3. 4.3 Emerging-Market Office and SME Formation | |
    4. 4.4 Government Archival and Notarisation Requirements | |
    5. 4.5 E-Procurement Platform Penetration | |
    6. 4.6 Managed Print Service Fleet Expansion | |
    7. 4.7 ISO 216 Convergence in Cross-Border Documentation | |
  5. 5 Restraints Impact Analysis | |
    1. 5.1 Corporate Digitisation and Paperless Workflows | |
    2. 5.2 Pulp and Energy Input Cost Volatility | |
    3. 5.3 Capacity Closures and Supply Rationalisation | |
    4. 5.4 Fibre Traceability Compliance Cost | |
    5. 5.5 Freight Economics on Low Value-Density Cargo | |
  6. 6 Opportunities | |
    1. 6.1 De-Inked Pulp Capacity in Regulated Markets | |
    2. 6.2 Middle East and Africa Distribution Gap | |
    3. 6.3 Subscription Replenishment and Consumption Data Monetisation | |
    4. 6.4 Lightweight Grade Engineering as a Cost Hedge | |
    5. 6.5 Certification Premium Capture in Public Tenders | |
  7. 7 Regional Market Share and Country-Level Analysis | |
    1. 7.1 North America | | |
      1. 7.1.1 United States | | |
      2. 7.1.2 Canada | | |
      3. 7.1.3 Mexico | |
    2. 7.2 Europe | | |
      1. 7.2.1 Germany | | |
      2. 7.2.2 United Kingdom | | |
      3. 7.2.3 France | | |
      4. 7.2.4 Italy | | |
      5. 7.2.5 Russia | | |
      6. 7.2.6 Rest of Europe | |
    3. 7.3 Asia-Pacific | | |
      1. 7.3.1 China | | |
      2. 7.3.2 India | | |
      3. 7.3.3 Japan | | |
      4. 7.3.4 South Korea | | |
      5. 7.3.5 Indonesia | | |
      6. 7.3.6 Rest of Asia-Pacific | |
    4. 7.4 South America | | |
      1. 7.4.1 Brazil | | |
      2. 7.4.2 Argentina | | |
      3. 7.4.3 Rest of South America | |
    5. 7.5 Middle East and Africa | | |
      1. 7.5.1 Saudi Arabia | | |
      2. 7.5.2 United Arab Emirates | | |
      3. 7.5.3 Turkey | | |
      4. 7.5.4 Rest of Middle East | | |
      5. 7.5.5 South Africa | | |
      6. 7.5.6 Egypt | | |
      7. 7.5.7 Nigeria | | |
      8. 7.5.8 Rest of Africa | |
  8. 8 Future Outlook (2026–2035) | |
    1. 8.1 Machine-Level Intelligence Replaces Chemistry Innovation | |
    2. 8.2 Dual-Sourcing Becomes the Default Procurement Posture | |
    3. 8.3 Consolidation Concentrates Around Decarbonisation Capital | |
    4. 8.4 Certification Data Becomes Infrastructure | |
  9. 9 Segmentation Analysis | |
    1. 9.1 By Paper Size | | |
      1. 9.1.1 A4 | | |
      2. 9.1.2 A3 | | |
      3. 9.1.3 Letter | | |
      4. 9.1.4 Legal/Folio | |
    2. 9.2 By Raw Material | | |
      1. 9.2.1 Virgin Wood Pulp | | |
      2. 9.2.2 Recycled Fibre | |
    3. 9.3 By End User | | |
      1. 9.3.1 Corporate and Commercial Offices | | |
      2. 9.3.2 Educational Institutions | | |
      3. 9.3.3 Government and Public Sector | | |
      4. 9.3.4 Home and SOHO | | |
      5. 9.3.5 Print-for-Pay / Copy Shops | |
    4. 9.4 By Distribution Channel | | |
      1. 9.4.1 Stationery/Retail Stores | | |
      2. 9.4.2 B2B/Wholesale | | |
      3. 9.4.3 Online Retail and E-procurement | |
  10. 10 Competitive Landscape | |
    1. 10.1 Market Concentration Analysis (2025) | |
    2. 10.2 Competitive Benchmarking Matrix | |
    3. 10.3 Company Profiles | | |
      1. 10.3.1 International Paper | | |
      2. 10.3.2 Sylvamo | | |
      3. 10.3.3 Asia Pulp & Paper (Sinar Mas) | | |
      4. 10.3.4 Mondi | | |
      5. 10.3.5 Stora Enso | | |
      6. 10.3.6 UPM | | |
      7. 10.3.7 Oji Holdings | | |
      8. 10.3.8 Nippon Paper Industries | | |
      9. 10.3.9 Suzano | | |
      10. 10.3.10 The Navigator Company | | |
      11. 10.3.11 Double A | |
  11. 11 Recent News and Developments | |
  12. 12 Report Scope and Methodology | |
    1. 12.1 Study Period & Base Year | |
    2. 12.2 Data Sources & Validation | |
    3. 12.3 Abbreviations | |
  13. 13 Detailed Sources and Citations | |
  14. 14 Frequently Asked Questions | | LIST OF TABLES | |
  15. TABLE 1 Global Copier Paper Market Size & Forecast (USD Million), 2021–2035 | |
  16. TABLE 2 Global Copier Paper Market – Year-over-Year Growth Analysis, 2021–2035 | |
  17. TABLE 3 Driver Impact Analysis Matrix, 2026–2035 | |
  18. TABLE 4 Restraint Impact Analysis Matrix, 2026–2035 | |
  19. TABLE 5 Global Copier Paper Market Size, by Region (USD Million), 2021–2035 | |
  20. TABLE 6 North America Copier Paper Market Size, by Country (USD Million), 2021–2035 | |
  21. TABLE 7 Europe Copier Paper Market Size, by Country (USD Million), 2021–2035 | |
  22. TABLE 8 Asia-Pacific Copier Paper Market Size, by Country (USD Million), 2021–2035 | |
  23. TABLE 9 South America Copier Paper Market Size, by Country (USD Million), 2021–2035 | |
  24. TABLE 10 Middle East and Africa Copier Paper Market Size, by Country (USD Million), 2021–2035 | |
  25. TABLE 11 Global Copier Paper Market Size, by Paper Size (USD Million), 2021–2035 | |
  26. TABLE 12 Global Copier Paper Market Size, by Raw Material (USD Million), 2021–2035 | |
  27. TABLE 13 Global Copier Paper Market Size, by End User (USD Million), 2021–2035 | |
  28. TABLE 14 Global Copier Paper Market Size, by Distribution Channel (USD Million), 2021–2035 | |
  29. TABLE 15 North America Copier Paper Market Size, by Paper Size and Raw Material, 2021–2035 | |
  30. TABLE 16 Europe Copier Paper Market Size, by End User and Distribution Channel, 2021–2035 | |
  31. TABLE 17 Asia-Pacific Copier Paper Market Size, by Paper Size and End User, 2021–2035 | |
  32. TABLE 18 Competitive Benchmarking Matrix, 2025 | |
  33. TABLE 19 Company Profiles – Key Players | |
  34. TABLE 20 Recent Developments & Strategic Announcements, 2023–2025 | |
  35. TABLE 21 Report Scope & Methodology Summary | |
  36. TABLE 22 Detailed Sources and Citations Index | | LIST OF FIGURES | |
  37. FIGURE 1 Market Dynamics Overview – Drivers, Restraints and Opportunities | |
  38. FIGURE 2 Industry Value Chain Analysis | |
  39. FIGURE 3 Porter's Five Forces Analysis | |
  40. FIGURE 4 Global Market Size Trend and Forecast (USD Million), 2021–2035 | |
  41. FIGURE 5 Year-over-Year Growth Trajectory, 2022–2035 | |
  42. FIGURE 6 Market Share by Paper Size, 2025 | |
  43. FIGURE 7 Market Share by Raw Material, 2025 | |
  44. FIGURE 8 Market Share by End User, 2025 | |
  45. FIGURE 9 Market Share by Distribution Channel, 2025 | |
  46. FIGURE 10 Regional Share Distribution, 2025 | |
  47. FIGURE 11 Regional CAGR Comparison, 2026–2035 | |
  48. FIGURE 12 Country-Level Demand Heat Map | |
  49. FIGURE 13 Competitive Landscape Positioning Matrix | |
  50. FIGURE 14 Top-Five Producer Share Concentration Trend

Segmentation Quick Reference

DimensionSub-SegmentsDominant SegmentFastest Growing Segment
By Paper SizeA4; A3; Letter; Legal/FolioA4 (64.1% share, 2025)A3 (2.28% CAGR, 2026–2035)
By Raw MaterialVirgin Wood Pulp; Recycled FibreVirgin Wood Pulp (58.3% share, 2025)Recycled Fibre (2.66% CAGR, 2026–2035)
By End UserCorporate and Commercial Offices; Educational Institutions; Government and Public Sector; Home and SOHO; Print-for-Pay / Copy ShopsCorporate and Commercial Offices (36.6% share, 2025)Print-for-Pay / Copy Shops (2.61% CAGR, 2026–2035)
By Distribution ChannelStationery/Retail Stores; B2B/Wholesale; Online Retail and E-procurementB2B/Wholesale (39.4% share, 2025)Stationery/Retail Stores (2.45% CAGR, 2026–2035)


Market Segmentation Overview

By Paper Size

Sub-SegmentKey Trend
A4ISO 216 alignment locks in multinational archival and contractual use
A3Design, technical drawing and educational chart output lifts volume.
LetterNorth American convention persists but erodes among exporters.
Legal/FolioCourt filings and deed registration sustain niche demand.


A4 leads this dimension at 64.1% share because mill trim widths and printer feed mechanisms are both engineered around it, making any switch costly on two fronts at once. A3 grows fastest at 2.28%, pulled by design studios and technical documentation where lay-flat sheet size matters more than unit cost. Letter volume stays material in North America, though firms filing overseas customs paperwork increasingly standardise on the international format to avoid duplicate templates. Legal/Folio remains procedurally locked to court and notarial requirements.

By Raw Material

Sub-SegmentKey Trend
Virgin Wood PulpArchival permanence specification sustains legal and premium demand
Recycled FibreDe-inked pulp investment closes the brightness and runnability gap.


Virgin Wood Pulp holds 58.3% because legal firms and national archives write permanence requirements directly into specifications, and no recycled grade yet matches multi-decade ageing performance under those tests. Recycled Fibre is the faster mover at 2.66%, propelled by public procurement thresholds that make certified recycled content a bid qualifier rather than a preference. Integrated producers deliberately run both, so buyers can toggle between cost stability and emissions targets without changing supplier.

By End User

Sub-SegmentKey Trend
Corporate and Commercial OfficesIn-house fleet rationalisation pushes non-core jobs outward
Educational InstitutionsExamination and assessment formats resist online-only delivery.
Government and Public SectorStatutory archives and notarised records anchor steady intake.
Home and SOHORemote work redistributes volume but through employer portals.
Print-for-Pay / Copy ShopsEnterprise outsourcing converts internal jobs into external orders.


Corporate and Commercial Offices dominate at 36.6%, yet the same rationalisation that trims their in-house device count is precisely what makes Print-for-Pay / Copy Shops the fastest-growing sub-segment at 2.61% — volume does not disappear; it relocates. Educational Institutions provide the most digitisation-resistant block because examination integrity rules require physical scripts. Government and Public Sector intake tracks statutory retention schedules rather than budget cycles, which keeps it counter-cyclical against corporate spending swings.

By Distribution Channel

Sub-SegmentKey Trend
Stationery/Retail StoresOn-demand ream purchasing by freelancers and micro-enterprises
B2B/WholesaleContracted call-offs bundled with allied consumables
Online Retail and E-procurementContract pricing tiers delivered at parcel scale.


B2B/Wholesale controls 39.4% by locking institutional accounts into predictable monthly call-offs and widening basket size with toner and allied supplies. Stationery/Retail Stores grow fastest at 2.45% because start-up formation creates buyers who need one ream this week, not a pallet this quarter — a demand shape wholesale networks handle poorly. Online Retail and E-procurement sits between the two, using subscription replenishment to give small accounts contract-grade pricing while smoothing order flow back to mills.




Download PDF ×

We do not share your information with anyone. However, we may send you emails based on your report interest from time to time. You may contact us at any time to opt-out.