ID: MRFR/ICT/7079-HCR | February 2021 | Region: Global | 141 Pages
Table of Contents
1. EXECUTIVE SUMMARY
1.1. Market Attractiveness Analysis
1.1.1. Global Contract Management Market, by Component
1.1.2. Global Contract Management Market, by Deployment
1.1.3. Global Contract Management Market, by Organization Size
1.1.4. Global Contract Management Market, by Vertical
1.1.5. Global Contract Management Market, by Region
2. MARKET INTRODUCTION
2.1. Definition
2.2. Scope of the Study
2.3. Market Structure
3. RESEARCH METHODOLOGY
3.1. Research Process
3.2. Primary Research
3.3. Secondary Research
3.4. Market Size Estimation
3.5. Forecast Model
3.6. List of Assumptions
4. MARKET DYNAMICS
4.1. Introduction
4.2. Drivers
4.2.1. Growing Need to Maintain Compliance with Dynamic Regulatory directives
4.2.2. High Return on Investment
4.3. Restraints
4.3.1. Reluctance among end-user
4.4. Opportunities
4.4.1. Use of advance technologies like Blockchain and Artificial Intelligence (AI)
4.5. Challenge
4.5.1. Security and data privacy concern
5. MARKET FACTOR ANALYSIS
5.1. Value Chain Analysis/Supply Chain Analysis
5.2. Porterβs Five Forces Model
5.2.1. Bargaining Power of Suppliers
5.2.2. Bargaining Power of Buyers
5.2.3. Threat of New Entrants
5.2.4. Threat of Substitutes
5.2.5. Intensity of Rivalry
6. GLOBAL CONTRACT MANAGEMENT MARKET, BY COMPONENT
6.1. Introduction
6.2. Solution
6.3. Services
6.3.1. Support & Maintenance Services
6.3.2. Implementation & Integration Services
7. GLOBAL CONTRACT MANAGEMENT MARKET, BY DEPLOYMENT
7.1. Introduction
7.2. On-Premise
7.3. Cloud
8. GLOBAL CONTRACT MANAGEMENT MARKET, BY ORGANIZATION SIZE
8.1. Introduction
8.2. Small & Medium Enterprise
8.3. Large Enterprise
9. GLOBAL CONTRACT MANAGEMENT MARKET, BY VERTICAL
9.1. Introduction
9.2. Healthcare
9.3. Manufacturing
9.4. IT & Telecommunication
9.5. Consumer Goods
9.6. Education
9.7. BFSI
9.8. Others
10. GLOBAL CONTRACT MANAGEMENT MARKET, BY REGION
10.1. Introduction
10.2. North America
10.2.1. US
10.2.2. Canada
10.2.3. Mexico
10.3. Europe
10.3.1. Germany
10.3.2. France
10.3.3. UK
10.3.4. Rest of Europe
10.4. Asia-Pacific
10.4.1. China
10.4.2. India
10.4.3. Rest of Asia-Pacific
10.5. Middle East & Africa
10.6. South America
11. COMPETITIVE LANDSCAPE
11.1. Introduction
11.2. Competitive Analysis
12. COMPANY PROFILES
12.1. Icertis
12.1.1. Company Overview
12.1.2. Financial Overview
12.1.3. Products Offered
12.1.4. Key Developments
12.1.5. SWOT Analysis
12.1.6. Key Strategies
12.2. IBM
12.2.1. Company Overview
12.2.2. Financial Overview
12.2.3. Products Offered
12.2.4. Key Developments
12.2.5. SWOT Analysis
12.2.6. Key Strategies
12.3. SAP
12.3.1. Company Overview
12.3.2. Financial Overview
12.3.3. Products Offered
12.3.4. Key Developments
12.3.5. SWOT Analysis
12.3.6. Key Strategies
12.4. Zycus Inc.
12.4.1. Company Overview
12.4.2. Financial Overview
12.4.3. Products Offered
12.4.4. Key Developments
12.4.5. SWOT Analysis
12.4.6. Key Strategies
12.5. SecureDocs, Inc.
12.5.1. Company Overview
12.5.2. Financial Overview
12.5.3. Products Offered
12.5.4. Key Developments
12.5.5. SWOT Analysis
12.5.6. Key Strategies
12.6. Apttus Corporation
12.6.1. Company Overview
12.6.2. Financial Overview
12.6.3. Products Offered
12.6.4. Key Developments
12.6.5. SWOT Analysis
12.6.6. Key Strategies
12.7. Concord
12.7.1. Company Overview
12.7.2. Financial Overview
12.7.3. Products Offered
12.7.4. Key Developments
12.7.5. SWOT Analysis
12.7.6. Key Strategies
12.8. SpringCM
12.8.1. Company Overview
12.8.2. Financial Overview
12.8.3. Products Offered
12.8.4. Key Developments
12.8.5. SWOT Analysis
12.8.6. Key Strategies
12.9. Contract Logix LLC.
12.9.1. Company Overview
12.9.2. Financial Overview
12.9.3. Products Offered
12.9.4. Key Developments
12.9.5. SWOT Analysis
12.9.6. Key Strategies
12.10. Trackado
12.10.1. Company Overview
12.10.2. Financial Overview
12.10.3. Products Offered
12.10.4. Key Developments
12.10.5. SWOT Analysis
12.10.6. Key Strategies
12.11. GEP
12.11.1. Company Overview
12.11.2. Financial Overview
12.11.3. Products Offered
12.11.4. Key Developments
12.11.5. SWOT Analysis
12.11.6. Key Strategies
12.12. CobbleStone Software
12.12.1. Company Overview
12.12.2. Financial Overview
12.12.3. Products Offered
12.12.4. Key Developments
12.12.5. SWOT Analysis
12.12.6. Key Strategies
12.13. Determine
12.13.1. Company Overview
12.13.2. Financial Overview
12.13.3. Products Offered
12.13.4. Key Developments
12.13.5. SWOT Analysis
12.13.6. Key Strategies
12.14. Ultria
12.14.1. Company Overview
12.14.2. Financial Overview
12.14.3. Products Offered
12.14.4. Key Developments
12.14.5. SWOT Analysis
12.14.6. Key Strategies
12.15. ConvergePoint Inc.
12.15.1. Company Overview
12.15.2. Financial Overview
12.15.3. Products Offered
12.15.4. Key Developments
12.15.5. SWOT Analysis
12.15.6. Key Strategies
13. APPENDIX
13.1.1. Discussion Blueprint
NOTE:
This table of content is tentative and subject to change as the research progresses.
In section 12, only the top 15 companies will be profiled. Each company will be profiled based on the Market Overview, Financials, Product Portfolio, Business Strategies, and Recent Developments parameters.
Please note: The financial details of the company cannot be provided if the information is not available in the public domain and or from reliable sources.
LIST OF TABLES
TABLE 1 LIST OF ASSUMPTIONS
TABLE 2 GLOBAL CONTRACT MANAGEMENT MARKET, BY COMPONENT, 2020β2027 (USD MILLION)
TABLE 3 GLOBAL CONTRACT MANAGEMENT MARKET, BY DEPLOYMENT, 2020β2027 (USD MILLION)
TABLE 3 GLOBAL CONTRACT MANAGEMENT MARKET, BY ORGANIZATION SIZE, 2020β2027 (USD MILLION)
TABLE 4 GLOBAL CONTRACT MANAGEMENT MARKET, BY VERTICAL, 2020β2027 (USD MILLION)
TABLE 5 GLOBAL CONTRACT MANAGEMENT MARKET, BY REGION, 2020β2027 (USD MILLION)
TABLE 6 NORTH AMERICA: CONTRACT MANAGEMENT MARKET, BY COUNTRY, 2020β2027 (USD MILLION)
TABLE 7 NORTH AMERICA: CONTRACT MANAGEMENT MARKET, BY COMPONENT, 2020β2027 (USD MILLION)
TABLE 8 NORTH AMERICA: CONTRACT MANAGEMENT MARKET, BY DEPLOYMENT, 2020β2027 (USD MILLION)
TABLE 9 NORTH AMERICA: CONTRACT MANAGEMENT MARKET, BY ORGANIZATION SIZE, 2020β2027 (USD MILLION)
TABLE 10 NORTH AMERICA: CONTRACT MANAGEMENT MARKET, BY VERTICAL, 2020β2027 (USD MILLION)
TABLE 11 US: CONTRACT MANAGEMENT MARKET, BY COMPONENT, 2020β2027 (USD MILLION)
TABLE 13 US: CONTRACT MANAGEMENT MARKET, BY DEPLOYMENT, 2020β2027 (USD MILLION)
TABLE 14 US: CONTRACT MANAGEMENT MARKET, BY ORGANIZATION SIZE, 2020β2027 (USD MILLION)
TABLE 15 US: CONTRACT MANAGEMENT MARKET, BY VERTICAL, 2020β2027 (USD MILLION)
TABLE 16 CANADA: CONTRACT MANAGEMENT MARKET, BY COMPONENT, 2020β2027 (USD MILLION)
TABLE 17 CANADA: CONTRACT MANAGEMENT MARKET, BY DEPLOYMENT, 2020β2027 (USD MILLION)
TABLE 18 CANADA: CONTRACT MANAGEMENT MARKET, BY ORGANIZATION SIZE, 2020β2027 (USD MILLION)
TABLE 19 CANADA: CONTRACT MANAGEMENT MARKET, BY VERTICAL, 2020β2027 (USD MILLION)
TABLE 20 MEXICO: CONTRACT MANAGEMENT MARKET, BY COMPONENT, 2020β2027 (USD MILLION)
TABLE 21 GLOBAL CONTRACT MANAGEMENT MARKET, BY DEPLOYMENT, 2020β2027 (USD MILLION)
TABLE 22 MEXICO: CONTRACT MANAGEMENT MARKET, BY ORGANIZATION SIZE, 2020β2027 (USD MILLION)
TABLE 23 MEXICO: CONTRACT MANAGEMENT MARKET, BY VERTICAL, 2020β2027 (USD MILLION)
TABLE 24 EUROPE: CONTRACT MANAGEMENT MARKET, BY COUNTRY, 2020β2027 (USD MILLION)
TABLE 25 EUROPE: CONTRACT MANAGEMENT MARKET, BY COMPONENT, 2020β2027 (USD MILLION)
TABLE 26 EUROPE: CONTRACT MANAGEMENT MARKET, BY DEPLOYMENT, 2020β2027 (USD MILLION)
TABLE 27 EUROPE: CONTRACT MANAGEMENT MARKET, BY ORGANIZATION SIZE, 2020β2027 (USD MILLION)
TABLE 28 EUROPE: CONTRACT MANAGEMENT MARKET, BY VERTICAL, 2020β2027 (USD MILLION)
TABLE 29 UK: CONTRACT MANAGEMENT MARKET, BY COMPONENT, 2020β2027 (USD MILLION)
TABLE 30 UK: CONTRACT MANAGEMENT MARKET, BY DEPLOYMENT, 2020β2027 (USD MILLION)
TABLE 31 UK: CONTRACT MANAGEMENT MARKET, BY ORGANIZATION SIZE, 2020β2027 (USD MILLION)
TABLE 32 UK: CONTRACT MANAGEMENT MARKET, BY VERTICAL, 2020β2027 (USD MILLION)
TABLE 33 GERMANY: CONTRACT MANAGEMENT MARKET, BY COMPONENT, 2020β2027 (USD MILLION)
TABLE 34 GERMANY: CONTRACT MANAGEMENT MARKET, BY DEPLOYMENT, 2020β2027 (USD MILLION)
TABLE 35 GERMANY: CONTRACT MANAGEMENT MARKET, BY ORGANIZATION SIZE, 2020β2027 (USD MILLION)
TABLE 36 GERMANY: CONTRACT MANAGEMENT MARKET, BY VERTICAL, 2020β2027 (USD MILLION)
TABLE 37 FRANCE: CONTRACT MANAGEMENT MARKET, BY COMPONENT, 2020β2027 (USD MILLION)
TABLE 38 FRANCE: CONTRACT MANAGEMENT MARKET, BY DEPLOYMENT, 2020β2027 (USD MILLION)
TABLE 39 FRANCE: CONTRACT MANAGEMENT MARKET, BY ORGANIZATION SIZE, 2020β2027 (USD MILLION)
TABLE 40 FRANCE: CONTRACT MANAGEMENT MARKET, BY VERTICAL, 2020β2027 (USD MILLION)
TABLE 41 REST OF EUROPE: CONTRACT MANAGEMENT MARKET, BY COMPONENT, 2020β2027 (USD MILLION)
TABLE 42 REST OF EUROPE: CONTRACT MANAGEMENT MARKET, BY DEPLOYMENT, 2020β2027 (USD MILLION)
TABLE 43 REST OF EUROPE: CONTRACT MANAGEMENT MARKET, BY ORGANIZATION SIZE, 2020β2027 (USD MILLION)
TABLE 44 REST OF EUROPE: CONTRACT MANAGEMENT MARKET, BY VERTICAL, 2020β2027 (USD MILLION)
TABLE 45 ASIA-PACIFIC: CONTRACT MANAGEMENT MARKET, BY COUNTRY, 2020β2027 (USD MILLION)
TABLE 46 ASIA-PACIFIC: CONTRACT MANAGEMENT MARKET, BY DEPLOYMENT, 2020β2027 (USD MILLION)
TABLE 47 ASIA-PACIFIC: CONTRACT MANAGEMENT MARKET, BY COMPONENT, 2020β2027 (USD MILLION)
TABLE 48 ASIA-PACIFIC: CONTRACT MANAGEMENT MARKET, BY ORGANIZATION SIZE, 2020β2027 (USD MILLION)
TABLE 49 ASIA-PACIFIC: CONTRACT MANAGEMENT MARKET, BY VERTICAL, 2020β2027 (USD MILLION)
TABLE 50 CHINA: CONTRACT MANAGEMENT MARKET, BY COMPONENT, 2020β2027 (USD MILLION)
TABLE 51 CHINA: CONTRACT MANAGEMENT MARKET, BY DEPLOYMENT, 2020β2027 (USD MILLION)
TABLE 52 CHINA: CONTRACT MANAGEMENT MARKET, BY ORGANIZATION SIZE, 2020β2027 (USD MILLION)
TABLE 53 CHINA: CONTRACT MANAGEMENT MARKET, BY VERTICAL, 2020β2027 (USD MILLION)
TABLE 54 INDIA: CONTRACT MANAGEMENT MARKET, BY COMPONENT, 2020β2027 (USD MILLION)
TABLE 55 INDIA: CONTRACT MANAGEMENT MARKET, BY DEPLOYMENT, 2020β2027 (USD MILLION)
TABLE 56 INDIA: CONTRACT MANAGEMENT MARKET, BY ORGANIZATION SIZE, 2020β2027 (USD MILLION)
TABLE 57 INDIA: CONTRACT MANAGEMENT MARKET, BY VERTICAL, 2020β2027 (USD MILLION)
TABLE 58 JAPAN: CONTRACT MANAGEMENT MARKET, BY COMPONENT, 2020β2027 (USD MILLION)
TABLE 59 JAPAN: CONTRACT MANAGEMENT MARKET, BY DEPLOYMENT, 2020β2027 (USD MILLION)
TABLE 60: JAPAN: CONTRACT MANAGEMENT MARKET, BY ORGANIZATION SIZE, 2020β2027 (USD MILLION)
TABLE 61: JAPAN: CONTRACT MANAGEMENT MARKET, BY VERTICAL, 2020β2027 (USD MILLION)
TABLE 62: REST OF ASIA-PACIFIC: CONTRACT MANAGEMENT MARKET, BY COMPONENT, 2020β2027 (USD MILLION)
TABLE 63: REST OF ASIA-PACIFIC: CONTRACT MANAGEMENT MARKET, BY DEPLOYMENT, 2020β2027 (USD MILLION)
TABLE 64: REST OF ASIA-PACIFIC: CONTRACT MANAGEMENT MARKET, BY ORGANIZATION SIZE, 2020β2027 (USD MILLION)
TABLE 65: REST OF ASIA-PACIFIC: CONTRACT MANAGEMENT MARKET, BY VERTICAL, 2020β2027 (USD MILLION)
TABLE 66: MIDDLE EAST AND AFRICA: CONTRACT MANAGEMENT MARKET, BY COMPONENT, 2020β2027 (USD MILLION)
TABLE 67: MIDDLE EAST AND AFRICA: CONTRACT MANAGEMENT MARKET, BY DEPLOYMENT, 2020β2027 (USD MILLION)
TABLE 68: MIDDLE EAST AND AFRICA: CONTRACT MANAGEMENT MARKET, BY ORGANIZATION SIZE, 2020β2027 (USD MILLION)
TABLE 69: MIDDLE EAST AND AFRICA: CONTRACT MANAGEMENT MARKET, BY VERTICAL, 2020β2027 (USD MILLION)
TABLE 70: SOUTH AMERICA: CONTRACT MANAGEMENT MARKET, BY COMPONENT, 2020β2027 (USD MILLION)
TABLE 71: SOUTH AMERICA: CONTRACT MANAGEMENT MARKET, BY DEPLOYMENT, 2020β2027 (USD MILLION)
TABLE 72: SOUTH AMERICA: CONTRACT MANAGEMENT MARKET, BY ORGANIZATION SIZE, 2020β2027 (USD MILLION)
TABLE 73: SOUTH AMERICA: CONTRACT MANAGEMENT MARKET, BY VERTICAL, 2020β2027 (USD MILLION)
β
LIST OF FIGURES
FIGURE 1 MARKET SYNOPSIS
FIGURE 2 RESEARCH PROCESS OF MRFR
FIGURE 3 TOP DOWN & BOTTOM-UP APPROACH
FIGURE 4 GLOBAL CONTRACT MANAGEMENT MARKET, BY COMPONENT, 2020β2027 (USD MILLION)
FIGURE 5 GLOBAL CONTRACT MANAGEMENT MARKET, BY DEPLOYMENT, 2020β2027 (USD MILLION)
FIGURE 6 GLOBAL CONTRACT MANAGEMENT MARKET, BY ORGANIZATION SIZE, 2020β2027 (USD MILLION)
FIGURE 7 GLOBAL CONTRACT MANAGEMENT MARKET, BY VERTICAL, 2020β2027 (USD MILLION)
FIGURE 8 GLOBAL CONTRACT MANAGEMENT MARKET, BY REGION, 2020β2027 (USD MILLION)
FIGURE 9 GLOBAL CONTRACT MANAGEMENT MARKET, BY REGION, 2020β2027 (USD MILLION)
FIGURE 10 NORTH AMERICA: CONTRACT MANAGEMENT MARKET, BY COUNTRY, 2020β2027 (USD MILLION)
FIGURE 11 NORTH AMERICA: CONTRACT MANAGEMENT MARKET, BY COMPONENT, 2020β2027 (USD MILLION)
FIGURE 12 NORTH AMERICA: CONTRACT MANAGEMENT MARKET, BY COMPONENT, 2020β2027 (USD MILLION)
FIGURE 13 NORTH AMERICA: CONTRACT MANAGEMENT MARKET, BY ORGANIZATION SIZE, 2020β2027 (USD MILLION)
FIGURE 14 NORTH AMERICA: CONTRACT MANAGEMENT MARKET, BY VERTICAL, 2020β2027 (USD MILLION)
FIGURE 15 EUROPE: CONTRACT MANAGEMENT MARKET, BY COUNTRY, 2020β2027 (USD MILLION)
FIGURE 16 EUROPE: CONTRACT MANAGEMENT MARKET, BY COMPONENT, 2020β2027 (USD MILLION)
FIGURE 17 EUROPE: CONTRACT MANAGEMENT MARKET, BY DEPLOYMENT, 2020β2027 (USD MILLION)
FIGURE 18 EUROPE: CONTRACT MANAGEMENT MARKET, BY ORGANIZATION SIZE, 2020β2027 (USD MILLION)
FIGURE 19 EUROPE: CONTRACT MANAGEMENT MARKET, BY VERTICAL, 2020β2027 (USD MILLION)
FIGURE 20 ASIA-PACIFIC: CONTRACT MANAGEMENT MARKET, BY COUNTRY, 2020β2027 (USD MILLION)
FIGURE 21 ASIA-PACIFIC: CONTRACT MANAGEMENT MARKET, BY COMPONENT, 2020β2027 (USD MILLION)
FIGURE 22 ASIA-PACIFIC: CONTRACT MANAGEMENT MARKET, BY COMPONENT, 2020β2027 (USD MILLION)
FIGURE 23 ASIA-PACIFIC: CONTRACT MANAGEMENT MARKET, BY ORGANIZATION SIZE, 2020β2027 (USD MILLION)
FIGURE 24 ASIA-PACIFIC: CONTRACT MANAGEMENT MARKET, BY VERTICAL, 2020β2027 (USD MILLION)
FIGURE 25 MIDDLE EAST & AFRICA: CONTRACT MANAGEMENT MARKET, BY COMPONENT, 2020β2027 (USD MILLION)
FIGURE 26 MIDDLE EAST AND AFRICA: CONTRACT MANAGEMENT MARKET, BY COMPONENT, 2020β2027 (USD MILLION)
FIGURE 27 MIDDLE EAST & AFRICA: CONTRACT MANAGEMENT MARKET, BY ORGANIZATION SIZE, 2020β2027 (USD MILLION)
FIGURE 28 MIDDLE EAST & AFRICA: CONTRACT MANAGEMENT MARKET, BY VERTICAL, 2020β2027 (USD MILLION)
FIGURE 29 SOUTH AMERICA: CONTRACT MANAGEMENT MARKET, BY COMPONENT, 2020β2027 (USD MILLION)
FIGURE 30 SOUTH AMERICA: CONTRACT MANAGEMENT MARKET, BY DEPLOYMENT, 2020β2027 (USD MILLION)
FIGURE 31 SOUTH AMERICA: CONTRACT MANAGEMENT MARKET, BY ORGANIZATION SIZE, 2020β2027 (USD MILLION)
FIGURE 32 SOUTH AMERICA: CONTRACT MANAGEMENT MARKET, BY VERTICAL, 2020β2027 (USD MILLION)
Contract Management Market Overview:
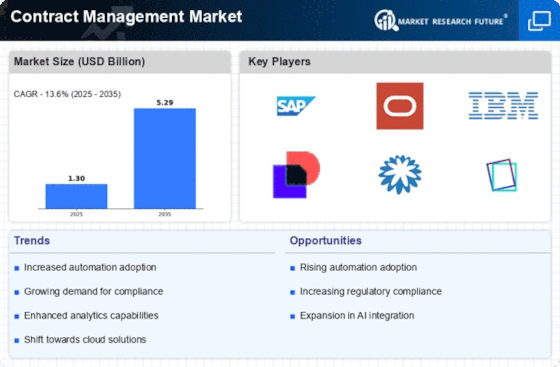
The Contract Management Market Size will grow by 12.3%. Contract management software is a crucial part of any large scale enterprise. The contract operation is complex. Also, Reviewing, analyzing, validating and authenticating contracts is a time-consuming process. Many organisations are rapidly adopting digital technologies. The efficiency in the organisation is growing due to digital transformation. Contract management software is one such technology that will enhance organizational effectiveness. Even small and medium-size organizations are rapidly adopting I he contracts management.
Dealing with contracts includes risk. However, with contract management, the risks can be eliminated. The business outcomes are favourable with the use of contract management software. Renewing contacts, restructuring and making changes are possible with this software. Cloud-based contact management software is witnessing massive demand in the forecast period. The adoption of cloud technologies is in reusing the adoption of contract management technologies. The legal, sales, procurement segment of the contract management market is facing exceptional demand. Contract Management Market Forecast the value will reach 6.5 billion.
Contract Management Market Covid Analysis:
The outbreak of covid 19 is causing plenty of disruptions in the contract management Industry. There are few difficulties for the market during this period. The production of the market is declining. Also, the deployment of contract management is slowing down in enterprises. The lockdowns and government restrictions are hampering the deployment rate of the market. Similar to other markets the demand rate is constantly declining.
However, the deployment and adoption rate of the market is increasing this year. The market operations are resuming as the spread of disease is reducing. Large enterprises are deploying the contract management system in central systems. It helps the work from home employees to access the contract management software. Post covid 19 the production rate will surge. Also, the demand for the market will be high during 2025.
Market Dynamics:
Crucial Market Drivers:
The investment of industries is increasing in new-gen technologies. Advanced enterprise software is raising productivity. Also, the deployment of contract management technology will escalate in upcoming years. The high investments in this technology are the crucial driver for the market. Some of the benefits of these technologies are better sales, revenue and enhanced customer experience. All these benefits are an asset to any enterprise. Due to this wide range of benefits, the investment rate will grow higher. The powerful regions with high spending power such as North America will allocate high investment in the forecast period. It contributes to the top demand rate for the contract management business. The contract management software includes cloud and AI.
It is advancement for the market. These two factors enhance the overall market scenario. Moreover, the need for verified contracts is high in industries. The contract reviewed by human hands is prone to mistakes and errors. Also, the amount of unauthentic contacts damages the reputation of the market. The revenue losses pose a major challenge to the industries. However, with contract management software there is no room for mistakes. The need to manage varied contracts is another crucial driver. The contract in various industries varies. Contact management is exceptional to handle any contract.
Also, it will lead to plenty of expansion possibilities for the market. The demands from the SMEs will Contract Management Market Growth opportunities. Also, the amount of SMEs globally is growing rapidly. The future of the market depends on the demand from SME’s. The small and medium-sized enterprise has plenty of contract management operations. Most of the SME’s are suffering from poor contract management. There is no appropriate resource to handle the contracts. However, with contract management software the tasks in SME can run smoothly.
Most of the SME’s are struck with traditional systems and software. It hinders them to adopt contract management technology. The resistance of SME's to adopt new technologies is the restraining factor. The demand rate can decrease for the contract management market in upcoming years. Also, the market exposure rate is affected due to this.
The benefits and uses of contract management are wide. However, less awareness about the technology makes it insignificant in the global market. Most SME’s are aware of the existence of such technology. It can decline the demand rate in the forecast period. The development of the market can become stagnate due to these factors.
The features in the technology such as AI and machine learning are some of the drivers for the market. Further, high demand from SMEs is another demand driving factor for the market. The less adoption of new technologies in SME’s is a restraining factor for the market. Also, a lack of awareness can lead to drawbacks in the market.
Also, the investments in this region are high. Even SMEs have a massive demand for contract management software. Most SMEs are equipped with new technologies that lead to easier adoption. The BFSI, healthcare, legal, enterprise and other sectors have much demand for the market.
Contract Management Market Segment Overview:
By Component:
By Deployment Type:
By Organization Size:
By Business Function:
By Vertical:
By Region:
Contract Management Market Competitive Landscape:
The competition in the contract management market is less. However, the entry of key players can increase competition in the forecast period. Technological advancements are a key strategy in the competitive landscape. The acquisition, expansion and part ships in the market are higher. Launch of new contract management solution is possible doing this period.
Contract Management Market Regional Analysis:
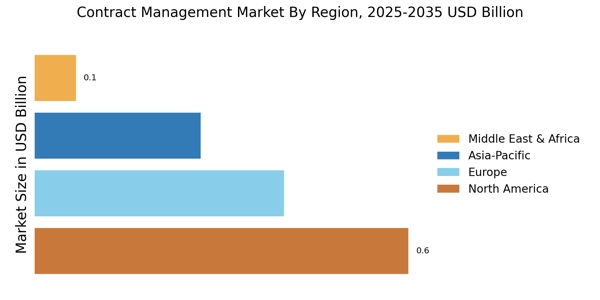
North America will lead the other regions with high contract management market shares. The investments in research and development are higher in this region. It will lead to attractive developments in technology. The adoption rate of contract management software is also higher. The revenue rates of the market will reach the maximum amount in the forecast period.
Most of the enterprises in this region are the aware amount the benefits of the technology. Also, it is a region with high large enterprises dealing with massive contracts. The need and demand for contract management are higher. Asia pacific will experience the fastest growth rate. The adoption of the technology will enhance in the forecast period. The demand for SMEs is the crucial diver for the market. The transformation from traditional systems to advanced technologies is surging market growth.
The key players of the contract magenta market are
Recent Developments:
The leading players of the contract management market are acquiring Solutions Company. It is a collaboration that will increase contract creation and design capabilities of the market.
The key players in the US are developing new contract management solutions. Simple and automated technology will help in connection management.
Microsoft is a partnership with Icertis. I will lead to more development in the market.
Report Overview:
Frequently Asked Questions (FAQ) :
By 2025, the market is projected to earn revenues worth USD 6.5 Bn, which can be attributed to the accelerating demand for efficient contract lifecycle management.
Among solution and service, the service segment is poised to expand at a faster growth pace.
The healthcare segment is prognosticated to mark a higher CAGR across the review period.
Icertis, SAP, Zycus Inc., IBM, and SecureDocs, Inc. are a few of the key players in the market. These players are poised to resort to product launches and advancing technologies for growth.
The deployment based segments of the market are on-premise and cloud-based.