Content Intelligence Market

ID: MRFR/ICT/6910-HCR
100 Pages
Apoorva Priyadarshi
Last Updated: June 23, 2026
Content Intelligence Market Size, Share and Research Report By Component (Solution, Services), By Deployment Mode (Cloud, On-Premise, Hybrid), By Organization Size (SMEs, Large Enterprises) and By Regional (North America, Europe, Asia Pacific, Rest of the World) - Industry Forecast to 2035.
Download PDF ×

We do not share your information with anyone. However, we may send you emails based on your report interest from time to time. You may contact us at any time to opt-out.

  1. 1 Market Overview |
    1. 1.1 Study Assumptions & Market Definition |
    2. 1.2 Scope of the Study |
    3. 1.3 Research Methodology
  2. 2 Market Summary & Key Takeaways
  3. 3 Market Dynamics |
    1. 3.1 Market Drivers Analysis | |
      1. 3.1.1 Demand for Personalized, Data-Driven Content at Scale | |
      2. 3.1.2 AI/ML Integration Across Martech Stacks | |
      3. 3.1.3 Omnichannel Video and Social Content Explosion | |
      4. 3.1.4 WCAG
    2. 3.0 Accessibility Mandates | |
      1. 3.1.5 Small Language Models Reducing Inference Costs | |
      2. 3.1.6 Synthetic Audience Data and Zero-Party Targeting |
    3. 3.2 Market Restraints Analysis | |
      1. 3.2.1 GDPR/DMA Compliance Costs | |
      2. 3.2.2 Content-AI Talent Shortage | |
      3. 3.2.3 GPU/ASIC Supply-Chain Bottlenecks | |
      4. 3.2.4 Hallucination-Driven Brand Liability | |
      5. 3.2.5 Integration Complexity with Legacy CMS |
    4. 3.3 Market Opportunity Analysis | |
      1. 3.3.1 Generative AI for Multilingual Content Scaling | |
      2. 3.3.2 Content Intelligence in Regulated Verticals | |
      3. 3.3.3 Outcome-Based Pricing Models | |
      4. 3.3.4 Emerging Market Digitization in Africa and Southeast Asia | |
      5. 3.3.5 Data Monetization Through Content Analytics |
    5. 3.4 Industry Value Chain Analysis |
    6. 3.5 Porter's Five Forces Analysis
  4. 4 Global Content Intelligence Market Size & Forecast (2021–2035) |
    1. 4.1 Historical Market Size (2021–2025) |
    2. 4.2 Current & Forecast Market Size (2026–2035) |
    3. 4.3 Market Size by Revenue (USD Billion) |
    4. 4.4 Year-over-Year Growth Analysis
  5. 5 Segmentation Analysis |
    1. 5.1 By Component | |
      1. 5.1.1 Solution | |
      2. 5.1.2 Service |
    2. 5.2 By Deployment | |
      1. 5.2.1 Cloud | |
      2. 5.2.2 On-Premise | |
      3. 5.2.3 Hybrid |
    3. 5.3 By Organization Size | |
      1. 5.3.1 SMEs | |
      2. 5.3.2 Large Enterprises |
    4. 5.4 By End-User Vertical | |
      1. 5.4.1 Media and Entertainment | |
      2. 5.4.2 Government and Public Sector | |
      3. 5.4.3 Healthcare and Life Sciences | |
      4. 5.4.4 BFSI | |
      5. 5.4.5 Retail and E-Commerce
  6. 6 Regional Analysis |
    1. 6.1 North America | |
      1. 6.1.1 United States | |
      2. 6.1.2 Canada | |
      3. 6.1.3 Mexico |
    2. 6.2 Europe | |
      1. 6.2.1 Germany | |
      2. 6.2.2 United Kingdom | |
      3. 6.2.3 France | |
      4. 6.2.4 Italy | |
      5. 6.2.5 Spain | |
      6. 6.2.6 Nordic Countries | |
      7. 6.2.7 Russia | |
      8. 6.2.8 Rest of Europe |
    3. 6.3 Asia-Pacific | |
      1. 6.3.1 China | |
      2. 6.3.2 India | |
      3. 6.3.3 Japan | |
      4. 6.3.4 South Korea | |
      5. 6.3.5 ASEAN | |
      6. 6.3.6 Rest of Asia-Pacific |
    4. 6.4 South America | |
      1. 6.4.1 Brazil | |
      2. 6.4.2 Argentina | |
      3. 6.4.3 Rest of South America |
    5. 6.5 Middle East & Africa | |
      1. 6.5.1 Saudi Arabia | |
      2. 6.5.2 UAE | |
      3. 6.5.3 South Africa | |
      4. 6.5.4 Egypt | |
      5. 6.5.5 Rest of MEA
  7. 7 Competitive Landscape |
    1. 7.1 Market Share Analysis (2026) |
    2. 7.2 Competitive Benchmarking Matrix |
    3. 7.3 Company Profiles | |
      1. 7.3.1 Adobe Inc. | |
      2. 7.3.2 OpenText Corporation | |
      3. 7.3.3 Ceralytics | |
      4. 7.3.4 Contently | |
      5. 7.3.5 Conductor | |
      6. 7.3.6 PathFactory | |
      7. 7.3.7 Acrolinx | |
      8. 7.3.8 Knotch | |
      9. 7.3.9 Siteimprove | |
      10. 7.3.10 Veritone
  8. 8 Future Outlook & Strategic Recommendations (2026–2035) |
    1. 8.1 Agentic AI and Autonomous Content Operations |
    2. 8.2 Platform Economics and Ecosystem Lock-In |
    3. 8.3 Sustainability and ESG Content Reporting |
    4. 8.4 Hyper-Personalization Through Synthetic and Zero-Party Data
  9. 9 Recent Developments & News
  10. 10 Frequently Asked Questions (FAQs)
  11. 11 Report Scope & Methodology |
    1. 11.1 Study Period & Base Year |
    2. 11.2 Data Sources & Citations |
    3. 11.3 Abbreviations
  12. 12 LIST OF TABLES |
  13. TABLE 1 Global Content Intelligence Market Size & Forecast, by Revenue (USD Billion), 2021–2035 |
  14. TABLE 2 Global Content Intelligence Market – Year-over-Year Growth Analysis, 2021–2035 |
  15. TABLE 3 Global Content Intelligence Market Size, by Component, 2021–2035 (USD Billion) |
  16. TABLE 4 Global Content Intelligence Market Size, by Deployment, 2021–2035 (USD Billion) |
  17. TABLE 5 Global Content Intelligence Market Size, by Organization Size, 2021–2035 (USD Billion) |
  18. TABLE 6 Global Content Intelligence Market Size, by End-User Vertical, 2021–2035 (USD Billion) |
  19. TABLE 7 Global Content Intelligence Market Size, by Region, 2021–2035 (USD Billion) |
  20. TABLE 8 North America Content Intelligence Market Size, by Country, 2021–2035 (USD Billion) |
  21. TABLE 9 Europe Content Intelligence Market Size, by Country, 2021–2035 (USD Billion) |
  22. TABLE 10 Asia-Pacific Content Intelligence Market Size, by Country, 2021–2035 (USD Billion) |
  23. TABLE 11 South America Content Intelligence Market Size, by Country, 2021–2035 (USD Billion) |
  24. TABLE 12 Middle East & Africa Content Intelligence Market Size, by Country, 2021–2035 (USD Billion) |
  25. TABLE 13 Competitive Benchmarking Matrix – Global Content Intelligence Market, 2026 |
  26. TABLE 14 Company Profiles – Key Players, Global Content Intelligence Market |
  27. TABLE 15 Recent Developments & Strategic Announcements, 2023–2025 |
  28. TABLE 16 North America Content Intelligence Market Size, by Component, 2021–2035 (USD Billion) |
  29. TABLE 17 North America Content Intelligence Market Size, by Deployment, 2021–2035 (USD Billion) |
  30. TABLE 18 North America Content Intelligence Market Size, by Organization Size, 2021–2035 (USD Billion) |
  31. TABLE 19 North America Content Intelligence Market Size, by End-User Vertical, 2021–2035 (USD Billion) |
  32. TABLE 20 Europe Content Intelligence Market Size, by Component, 2021–2035 (USD Billion) |
  33. TABLE 21 Europe Content Intelligence Market Size, by Deployment, 2021–2035 (USD Billion) |
  34. TABLE 22 Europe Content Intelligence Market Size, by Organization Size, 2021–2035 (USD Billion) |
  35. TABLE 23 Europe Content Intelligence Market Size, by End-User Vertical, 2021–2035 (USD Billion) |
  36. TABLE 24 Asia-Pacific Content Intelligence Market Size, by Component, 2021–2035 (USD Billion) |
  37. TABLE 25 Asia-Pacific Content Intelligence Market Size, by Deployment, 2021–2035 (USD Billion) |
  38. TABLE 26 Asia-Pacific Content Intelligence Market Size, by Organization Size, 2021–2035 (USD Billion) |
  39. TABLE 27 Asia-Pacific Content Intelligence Market Size, by End-User Vertical, 2021–2035 (USD Billion) |
  40. TABLE 28 South America Content Intelligence Market Size, by Component, 2021–2035 (USD Billion) |
  41. TABLE 29 South America Content Intelligence Market Size, by Deployment, 2021–2035 (USD Billion) |
  42. TABLE 30 South America Content Intelligence Market Size, by Organization Size, 2021–2035 (USD Billion) |
  43. TABLE 31 South America Content Intelligence Market Size, by End-User Vertical, 2021–2035 (USD Billion) |
  44. TABLE 32 Middle East & Africa Content Intelligence Market Size, by Component, 2021–2035 (USD Billion) |
  45. TABLE 33 Middle East & Africa Content Intelligence Market Size, by Deployment, 2021–2035 (USD Billion) |
  46. TABLE 34 Middle East & Africa Content Intelligence Market Size, by Organization Size, 2021–2035 (USD Billion) |
  47. TABLE 35 Middle East & Africa Content Intelligence Market Size, by End-User Vertical, 2021–2035 (USD Billion) |
  48. TABLE 36 United States Content Intelligence Market Size, by Component, 2021–2035 (USD Billion) |
  49. TABLE 37 United States Content Intelligence Market Size, by Deployment, 2021–2035 (USD Billion) |
  50. TABLE 38 United States Content Intelligence Market Size, by Organization Size, 2021–2035 (USD Billion) |
  51. TABLE 39 United States Content Intelligence Market Size, by End-User Vertical, 2021–2035 (USD Billion) |
  52. TABLE 40 Canada Content Intelligence Market Size, by Component, 2021–2035 (USD Billion) |
  53. TABLE 41 Canada Content Intelligence Market Size, by Deployment, 2021–2035 (USD Billion) |
  54. TABLE 42 Canada Content Intelligence Market Size, by Organization Size, 2021–2035 (USD Billion) |
  55. TABLE 43 Canada Content Intelligence Market Size, by End-User Vertical, 2021–2035 (USD Billion) |
  56. TABLE 44 Mexico Content Intelligence Market Size, by Component, 2021–2035 (USD Billion) |
  57. TABLE 45 Mexico Content Intelligence Market Size, by Deployment, 2021–2035 (USD Billion) |
  58. TABLE 46 Mexico Content Intelligence Market Size, by Organization Size, 2021–2035 (USD Billion) |
  59. TABLE 47 Mexico Content Intelligence Market Size, by End-User Vertical, 2021–2035 (USD Billion) |
  60. TABLE 48 Germany Content Intelligence Market Size, by Component, 2021–2035 (USD Billion) |
  61. TABLE 49 Germany Content Intelligence Market Size, by Deployment, 2021–2035 (USD Billion) |
  62. TABLE 50 Germany Content Intelligence Market Size, by Organization Size, 2021–2035 (USD Billion) |
  63. TABLE 51 Germany Content Intelligence Market Size, by End-User Vertical, 2021–2035 (USD Billion) |
  64. TABLE 52 United Kingdom Content Intelligence Market Size, by Component, 2021–2035 (USD Billion) |
  65. TABLE 53 United Kingdom Content Intelligence Market Size, by Deployment, 2021–2035 (USD Billion) |
  66. TABLE 54 United Kingdom Content Intelligence Market Size, by Organization Size, 2021–2035 (USD Billion) |
  67. TABLE 55 United Kingdom Content Intelligence Market Size, by End-User Vertical, 2021–2035 (USD Billion) |
  68. TABLE 56 France Content Intelligence Market Size, by Component, 2021–2035 (USD Billion) |
  69. TABLE 57 France Content Intelligence Market Size, by Deployment, 2021–2035 (USD Billion) |
  70. TABLE 58 France Content Intelligence Market Size, by Organization Size, 2021–2035 (USD Billion) |
  71. TABLE 59 France Content Intelligence Market Size, by End-User Vertical, 2021–2035 (USD Billion) |
  72. TABLE 60 Italy Content Intelligence Market Size, by Component, 2021–2035 (USD Billion) |
  73. TABLE 61 Italy Content Intelligence Market Size, by Deployment, 2021–2035 (USD Billion) |
  74. TABLE 62 Italy Content Intelligence Market Size, by Organization Size, 2021–2035 (USD Billion) |
  75. TABLE 63 Italy Content Intelligence Market Size, by End-User Vertical, 2021–2035 (USD Billion) |
  76. TABLE 64 Spain Content Intelligence Market Size, by Component, 2021–2035 (USD Billion) |
  77. TABLE 65 Spain Content Intelligence Market Size, by Deployment, 2021–2035 (USD Billion) |
  78. TABLE 66 Spain Content Intelligence Market Size, by Organization Size, 2021–2035 (USD Billion) |
  79. TABLE 67 Spain Content Intelligence Market Size, by End-User Vertical, 2021–2035 (USD Billion) |
  80. TABLE 68 Nordic Countries Content Intelligence Market Size, by Component, 2021–2035 (USD Billion) |
  81. TABLE 69 Nordic Countries Content Intelligence Market Size, by Deployment, 2021–2035 (USD Billion) |
  82. TABLE 70 Nordic Countries Content Intelligence Market Size, by Organization Size, 2021–2035 (USD Billion) |
  83. TABLE 71 Nordic Countries Content Intelligence Market Size, by End-User Vertical, 2021–2035 (USD Billion) |
  84. TABLE 72 Russia Content Intelligence Market Size, by Component, 2021–2035 (USD Billion) |
  85. TABLE 73 Russia Content Intelligence Market Size, by Deployment, 2021–2035 (USD Billion) |
  86. TABLE 74 Russia Content Intelligence Market Size, by Organization Size, 2021–2035 (USD Billion) |
  87. TABLE 75 Russia Content Intelligence Market Size, by End-User Vertical, 2021–2035 (USD Billion) |
  88. TABLE 76 China Content Intelligence Market Size, by Component, 2021–2035 (USD Billion) |
  89. TABLE 77 China Content Intelligence Market Size, by Deployment, 2021–2035 (USD Billion) |
  90. TABLE 78 China Content Intelligence Market Size, by Organization Size, 2021–2035 (USD Billion) |
  91. TABLE 79 China Content Intelligence Market Size, by End-User Vertical, 2021–2035 (USD Billion) |
  92. TABLE 80 India Content Intelligence Market Size, by Component, 2021–2035 (USD Billion) |
  93. TABLE 81 India Content Intelligence Market Size, by Deployment, 2021–2035 (USD Billion) |
  94. TABLE 82 India Content Intelligence Market Size, by Organization Size, 2021–2035 (USD Billion) |
  95. TABLE 83 India Content Intelligence Market Size, by End-User Vertical, 2021–2035 (USD Billion) |
  96. TABLE 84 Japan Content Intelligence Market Size, by Component, 2021–2035 (USD Billion) |
  97. TABLE 85 Japan Content Intelligence Market Size, by Deployment, 2021–2035 (USD Billion) |
  98. TABLE 86 Japan Content Intelligence Market Size, by Organization Size, 2021–2035 (USD Billion) |
  99. TABLE 87 Japan Content Intelligence Market Size, by End-User Vertical, 2021–2035 (USD Billion) |
  100. TABLE 88 South Korea Content Intelligence Market Size, by Component, 2021–2035 (USD Billion) |
  101. TABLE 89 South Korea Content Intelligence Market Size, by Deployment, 2021–2035 (USD Billion) |
  102. TABLE 90 South Korea Content Intelligence Market Size, by Organization Size, 2021–2035 (USD Billion) |
  103. TABLE 91 South Korea Content Intelligence Market Size, by End-User Vertical, 2021–2035 (USD Billion) |
  104. TABLE 92 ASEAN Content Intelligence Market Size, by Component, 2021–2035 (USD Billion) |
  105. TABLE 93 ASEAN Content Intelligence Market Size, by Deployment, 2021–2035 (USD Billion) |
  106. TABLE 94 ASEAN Content Intelligence Market Size, by Organization Size, 2021–2035 (USD Billion) |
  107. TABLE 95 ASEAN Content Intelligence Market Size, by End-User Vertical, 2021–2035 (USD Billion) |
  108. TABLE 96 Brazil Content Intelligence Market Size, by Component, 2021–2035 (USD Billion) |
  109. TABLE 97 Brazil Content Intelligence Market Size, by Deployment, 2021–2035 (USD Billion) |
  110. TABLE 98 Brazil Content Intelligence Market Size, by Organization Size, 2021–2035 (USD Billion) |
  111. TABLE 99 Brazil Content Intelligence Market Size, by End-User Vertical, 2021–2035 (USD Billion) |
  112. TABLE 100 Argentina Content Intelligence Market Size, by Component, 2021–2035 (USD Billion) |
  113. TABLE 101 Argentina Content Intelligence Market Size, by Deployment, 2021–2035 (USD Billion) |
  114. TABLE 102 Argentina Content Intelligence Market Size, by Organization Size, 2021–2035 (USD Billion) |
  115. TABLE 103 Argentina Content Intelligence Market Size, by End-User Vertical, 2021–2035 (USD Billion) |
  116. TABLE 104 Saudi Arabia Content Intelligence Market Size, by Component, 2021–2035 (USD Billion) |
  117. TABLE 105 Saudi Arabia Content Intelligence Market Size, by Deployment, 2021–2035 (USD Billion) |
  118. TABLE 106 Saudi Arabia Content Intelligence Market Size, by Organization Size, 2021–2035 (USD Billion) |
  119. TABLE 107 Saudi Arabia Content Intelligence Market Size, by End-User Vertical, 2021–2035 (USD Billion) |
  120. TABLE 108 UAE Content Intelligence Market Size, by Component, 2021–2035 (USD Billion) |
  121. TABLE 109 UAE Content Intelligence Market Size, by Deployment, 2021–2035 (USD Billion) |
  122. TABLE 110 UAE Content Intelligence Market Size, by Organization Size, 2021–2035 (USD Billion) |
  123. TABLE 111 UAE Content Intelligence Market Size, by End-User Vertical, 2021–2035 (USD Billion) |
  124. TABLE 112 South Africa Content Intelligence Market Size, by Component, 2021–2035 (USD Billion) |
  125. TABLE 113 South Africa Content Intelligence Market Size, by Deployment, 2021–2035 (USD Billion) |
  126. TABLE 114 South Africa Content Intelligence Market Size, by Organization Size, 2021–2035 (USD Billion) |
  127. TABLE 115 South Africa Content Intelligence Market Size, by End-User Vertical, 2021–2035 (USD Billion) |
  128. TABLE 116 Egypt Content Intelligence Market Size, by Component, 2021–2035 (USD Billion) |
  129. TABLE 117 Egypt Content Intelligence Market Size, by Deployment, 2021–2035 (USD Billion) |
  130. TABLE 118 Egypt Content Intelligence Market Size, by Organization Size, 2021–2035 (USD Billion) |
  131. TABLE 119 Egypt Content Intelligence Market Size, by End-User Vertical, 2021–2035 (USD Billion) |
  132. TABLE 120 Report Scope & Methodology Summary – Global Content Intelligence Market |
  133. TABLE 121 Detailed Sources & Citations – Global Content Intelligence Market
  134. 13 LIST OF FIGURES |
  135. FIGURE 1 Global Content Intelligence Market – Market Dynamics Framework |
  136. FIGURE 2 Global Content Intelligence Market – Porter's Five Forces Analysis |
  137. FIGURE 3 Global Content Intelligence Market – Industry Value Chain Analysis |
  138. FIGURE 4 Global Content Intelligence Market Size (USD Billion), 2021–2035 |
  139. FIGURE 5 Global Content Intelligence Market – Revenue Share by Component, 2026 |
  140. FIGURE 6 Global Content Intelligence Market – Revenue Share by Deployment, 2026 |
  141. FIGURE 7 Global Content Intelligence Market – Revenue Share by Organization Size, 2026 |
  142. FIGURE 8 Global Content Intelligence Market – Revenue Share by End-User Vertical, 2026 |
  143. FIGURE 9 Global Content Intelligence Market – Revenue Share by Region, 2026 |
  144. FIGURE 10 North America Content Intelligence Market – Revenue Share by Country, 2026 |
  145. FIGURE 11 Europe Content Intelligence Market – Revenue Share by Country, 2026 |
  146. FIGURE 12 Asia-Pacific Content Intelligence Market – Revenue Share by Country, 2026 |
  147. FIGURE 13 South America Content Intelligence Market – Revenue Share by Country, 2026 |
  148. FIGURE 14 Middle East & Africa Content Intelligence Market – Revenue Share by Country, 2026 |
  149. FIGURE 15 Global Content Intelligence Market – Competitive Market Share Analysis, 2026 |
  150. FIGURE 16 North America Content Intelligence Market – Revenue Share by Component, 2026 |
  151. FIGURE 17 North America Content Intelligence Market – Revenue Share by Deployment, 2026 |
  152. FIGURE 18 North America Content Intelligence Market – Revenue Share by Organization Size, 2026 |
  153. FIGURE 19 North America Content Intelligence Market – Revenue Share by End-User Vertical, 2026 |
  154. FIGURE 20 Europe Content Intelligence Market – Revenue Share by Component, 2026 |
  155. FIGURE 21 Europe Content Intelligence Market – Revenue Share by Deployment, 2026 |
  156. FIGURE 22 Europe Content Intelligence Market – Revenue Share by Organization Size, 2026 |
  157. FIGURE 23 Europe Content Intelligence Market – Revenue Share by End-User Vertical, 2026 |
  158. FIGURE 24 Asia-Pacific Content Intelligence Market – Revenue Share by Component, 2026 |
  159. FIGURE 25 Asia-Pacific Content Intelligence Market – Revenue Share by Deployment, 2026 |
  160. FIGURE 26 Asia-Pacific Content Intelligence Market – Revenue Share by Organization Size, 2026 |
  161. FIGURE 27 Asia-Pacific Content Intelligence Market – Revenue Share by End-User Vertical, 2026 |
  162. FIGURE 28 South America Content Intelligence Market – Revenue Share by Component, 2026 |
  163. FIGURE 29 South America Content Intelligence Market – Revenue Share by Deployment, 2026 |
  164. FIGURE 30 South America Content Intelligence Market – Revenue Share by Organization Size, 2026 |
  165. FIGURE 31 South America Content Intelligence Market – Revenue Share by End-User Vertical, 2026 |
  166. FIGURE 32 Middle East & Africa Content Intelligence Market – Revenue Share by Component, 2026 |
  167. FIGURE 33 Middle East & Africa Content Intelligence Market – Revenue Share by Deployment, 2026 |
  168. FIGURE 34 Middle East & Africa Content Intelligence Market – Revenue Share by Organization Size, 2026 |
  169. FIGURE 35 Middle East & Africa Content Intelligence Market – Revenue Share by End-User Vertical, 2026 |
  170. FIGURE 36 United States Content Intelligence Market – Revenue Share by Component, 2026 |
  171. FIGURE 37 United States Content Intelligence Market – Revenue Share by Deployment, 2026 |
  172. FIGURE 38 United States Content Intelligence Market – Revenue Share by Organization Size, 2026 |
  173. FIGURE 39 United States Content Intelligence Market – Revenue Share by End-User Vertical, 2026 |
  174. FIGURE 40 Canada Content Intelligence Market – Revenue Share by Component, 2026 |
  175. FIGURE 41 Canada Content Intelligence Market – Revenue Share by Deployment, 2026 |
  176. FIGURE 42 Canada Content Intelligence Market – Revenue Share by Organization Size, 2026 |
  177. FIGURE 43 Canada Content Intelligence Market – Revenue Share by End-User Vertical, 2026 |
  178. FIGURE 44 Mexico Content Intelligence Market – Revenue Share by Component, 2026 |
  179. FIGURE 45 Mexico Content Intelligence Market – Revenue Share by Deployment, 2026 |
  180. FIGURE 46 Mexico Content Intelligence Market – Revenue Share by Organization Size, 2026 |
  181. FIGURE 47 Mexico Content Intelligence Market – Revenue Share by End-User Vertical, 2026 |
  182. FIGURE 48 Germany Content Intelligence Market – Revenue Share by Component, 2026 |
  183. FIGURE 49 Germany Content Intelligence Market – Revenue Share by Deployment, 2026 |
  184. FIGURE 50 Germany Content Intelligence Market – Revenue Share by Organization Size, 2026 |
  185. FIGURE 51 Germany Content Intelligence Market – Revenue Share by End-User Vertical, 2026 |
  186. FIGURE 52 United Kingdom Content Intelligence Market – Revenue Share by Component, 2026 |
  187. FIGURE 53 United Kingdom Content Intelligence Market – Revenue Share by Deployment, 2026 |
  188. FIGURE 54 United Kingdom Content Intelligence Market – Revenue Share by Organization Size, 2026 |
  189. FIGURE 55 United Kingdom Content Intelligence Market – Revenue Share by End-User Vertical, 2026 |
  190. FIGURE 56 France Content Intelligence Market – Revenue Share by Component, 2026 |
  191. FIGURE 57 France Content Intelligence Market – Revenue Share by Deployment, 2026 |
  192. FIGURE 58 France Content Intelligence Market – Revenue Share by Organization Size, 2026 |
  193. FIGURE 59 France Content Intelligence Market – Revenue Share by End-User Vertical, 2026 |
  194. FIGURE 60 Italy Content Intelligence Market – Revenue Share by Component, 2026 |
  195. FIGURE 61 Italy Content Intelligence Market – Revenue Share by Deployment, 2026 |
  196. FIGURE 62 Italy Content Intelligence Market – Revenue Share by Organization Size, 2026 |
  197. FIGURE 63 Italy Content Intelligence Market – Revenue Share by End-User Vertical, 2026 |
  198. FIGURE 64 Spain Content Intelligence Market – Revenue Share by Component, 2026 |
  199. FIGURE 65 Spain Content Intelligence Market – Revenue Share by Deployment, 2026 |
  200. FIGURE 66 Spain Content Intelligence Market – Revenue Share by Organization Size, 2026 |
  201. FIGURE 67 Spain Content Intelligence Market – Revenue Share by End-User Vertical, 2026 |
  202. FIGURE 68 Nordic Countries Content Intelligence Market – Revenue Share by Component, 2026 |
  203. FIGURE 69 Nordic Countries Content Intelligence Market – Revenue Share by Deployment, 2026 |
  204. FIGURE 70 Nordic Countries Content Intelligence Market – Revenue Share by Organization Size, 2026 |
  205. FIGURE 71 Nordic Countries Content Intelligence Market – Revenue Share by End-User Vertical, 2026 |
  206. FIGURE 72 Russia Content Intelligence Market – Revenue Share by Component, 2026 |
  207. FIGURE 73 Russia Content Intelligence Market – Revenue Share by Deployment, 2026 |
  208. FIGURE 74 Russia Content Intelligence Market – Revenue Share by Organization Size, 2026 |
  209. FIGURE 75 Russia Content Intelligence Market – Revenue Share by End-User Vertical, 2026 |
  210. FIGURE 76 China Content Intelligence Market – Revenue Share by Component, 2026 |
  211. FIGURE 77 China Content Intelligence Market – Revenue Share by Deployment, 2026 |
  212. FIGURE 78 China Content Intelligence Market – Revenue Share by Organization Size, 2026 |
  213. FIGURE 79 China Content Intelligence Market – Revenue Share by End-User Vertical, 2026 |
  214. FIGURE 80 India Content Intelligence Market – Revenue Share by Component, 2026 |
  215. FIGURE 81 India Content Intelligence Market – Revenue Share by Deployment, 2026 |
  216. FIGURE 82 India Content Intelligence Market – Revenue Share by Organization Size, 2026 |
  217. FIGURE 83 India Content Intelligence Market – Revenue Share by End-User Vertical, 2026 |
  218. FIGURE 84 Japan Content Intelligence Market – Revenue Share by Component, 2026 |
  219. FIGURE 85 Japan Content Intelligence Market – Revenue Share by Deployment, 2026 |
  220. FIGURE 86 Japan Content Intelligence Market – Revenue Share by Organization Size, 2026 |
  221. FIGURE 87 Japan Content Intelligence Market – Revenue Share by End-User Vertical, 2026 |
  222. FIGURE 88 South Korea Content Intelligence Market – Revenue Share by Component, 2026 |
  223. FIGURE 89 South Korea Content Intelligence Market – Revenue Share by Deployment, 2026 |
  224. FIGURE 90 South Korea Content Intelligence Market – Revenue Share by Organization Size, 2026 |
  225. FIGURE 91 South Korea Content Intelligence Market – Revenue Share by End-User Vertical, 2026 |
  226. FIGURE 92 ASEAN Content Intelligence Market – Revenue Share by Component, 2026 |
  227. FIGURE 93 ASEAN Content Intelligence Market – Revenue Share by Deployment, 2026 |
  228. FIGURE 94 ASEAN Content Intelligence Market – Revenue Share by Organization Size, 2026 |
  229. FIGURE 95 ASEAN Content Intelligence Market – Revenue Share by End-User Vertical, 2026 |
  230. FIGURE 96 Brazil Content Intelligence Market – Revenue Share by Component, 2026 |
  231. FIGURE 97 Brazil Content Intelligence Market – Revenue Share by Deployment, 2026 |
  232. FIGURE 98 Brazil Content Intelligence Market – Revenue Share by Organization Size, 2026 |
  233. FIGURE 99 Brazil Content Intelligence Market – Revenue Share by End-User Vertical, 2026 |
  234. FIGURE 100 Argentina Content Intelligence Market – Revenue Share by Component, 2026 |
  235. FIGURE 101 Argentina Content Intelligence Market – Revenue Share by Deployment, 2026 |
  236. FIGURE 102 Argentina Content Intelligence Market – Revenue Share by Organization Size, 2026 |
  237. FIGURE 103 Argentina Content Intelligence Market – Revenue Share by End-User Vertical, 2026 |
  238. FIGURE 104 Saudi Arabia Content Intelligence Market – Revenue Share by Component, 2026 |
  239. FIGURE 105 Saudi Arabia Content Intelligence Market – Revenue Share by Deployment, 2026 |
  240. FIGURE 106 Saudi Arabia Content Intelligence Market – Revenue Share by Organization Size, 2026 |
  241. FIGURE 107 Saudi Arabia Content Intelligence Market – Revenue Share by End-User Vertical, 2026 |
  242. FIGURE 108 UAE Content Intelligence Market – Revenue Share by Component, 2026 |
  243. FIGURE 109 UAE Content Intelligence Market – Revenue Share by Deployment, 2026 |
  244. FIGURE 110 UAE Content Intelligence Market – Revenue Share by Organization Size, 2026 |
  245. FIGURE 111 UAE Content Intelligence Market – Revenue Share by End-User Vertical, 2026 |
  246. FIGURE 112 South Africa Content Intelligence Market – Revenue Share by Component, 2026 |
  247. FIGURE 113 South Africa Content Intelligence Market – Revenue Share by Deployment, 2026 |
  248. FIGURE 114 South Africa Content Intelligence Market – Revenue Share by Organization Size, 2026 |
  249. FIGURE 115 South Africa Content Intelligence Market – Revenue Share by End-User Vertical, 2026 |
  250. FIGURE 116 Egypt Content Intelligence Market – Revenue Share by Component, 2026 |
  251. FIGURE 117 Egypt Content Intelligence Market – Revenue Share by Deployment, 2026 |
  252. FIGURE 118 Egypt Content Intelligence Market – Revenue Share by Organization Size, 2026 |
  253. FIGURE 119 Egypt Content Intelligence Market – Revenue Share by End-User Vertical, 2026

MARKET SEGMENTATION OVERVIEW

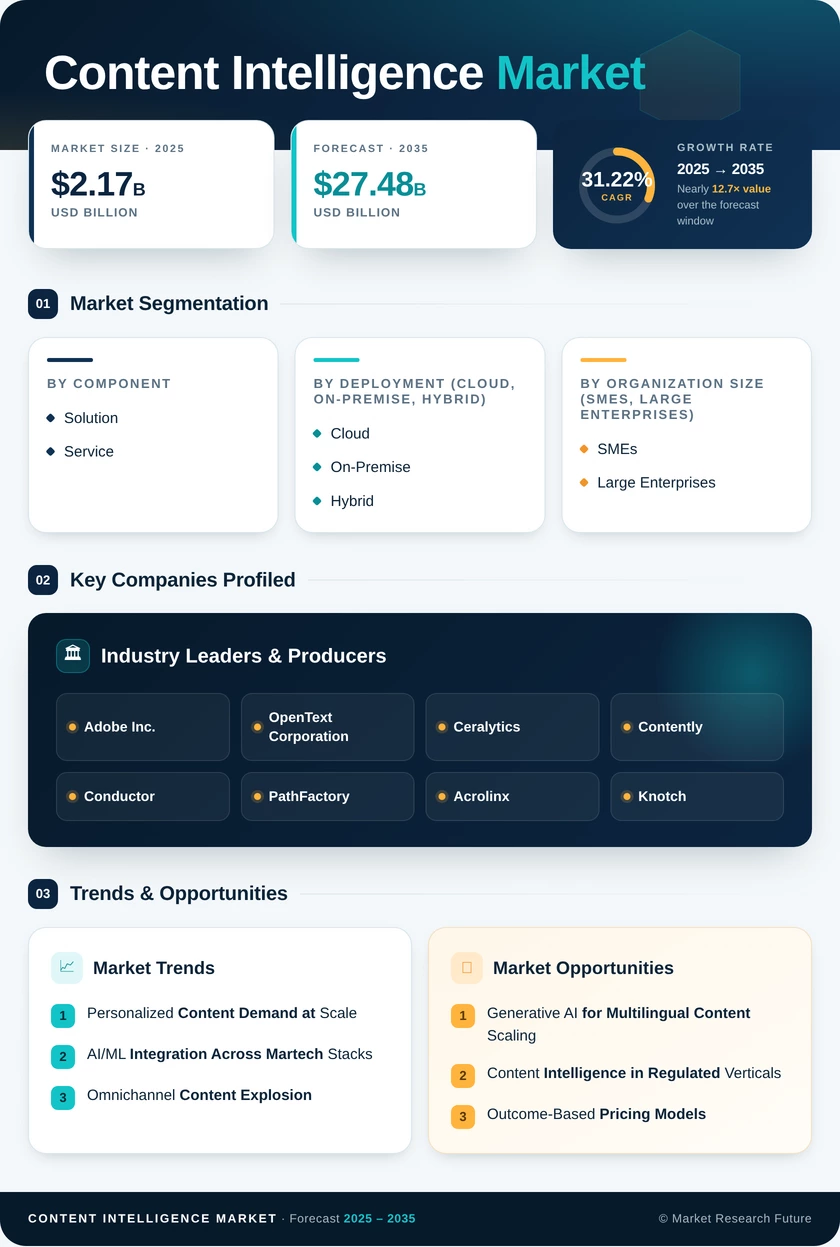
The global Content Intelligence Market is analyzed across four primary segmentation dimensions: Component, Deployment, Organization Size, and End-User Vertical. Each dimension reflects distinct demand drivers, regulatory treatment, and buyer requirements, enabling granular revenue forecasting and strategic positioning for market participants.

By Component

Sub-SegmentKey Trend
SolutionIntegrated AI-powered content tagging, classification, and analytics suites are gaining enterprise traction
ServiceConsulting, implementation, managed optimization, and workflow redesign are accelerating alongside platform adoption


Solutions retained the largest sub-segment (~68.20% share in 2025) as enterprises consolidate point tools into unified platforms combining content creation, NLP-driven personalization engines, and performance analytics. Services (35.87% CAGR) represent the fastest-growing sub-segment as organizations pair software with managed services to achieve 20–30% higher adoption rates and faster time-to-value. Subscription-based service models now anchor vendor revenue strategies, particularly for continuous SEO optimization and content performance tuning engagements.

By Deployment

Sub-SegmentKey Trend
CloudSaaS-first procurement; consumption-based pricing eliminates capital barriers for SMEs and mid-market
On-PremiseDefense, classified healthcare, and highly regulated content workflows requiring local data residency
HybridData sovereignty with elastic scaling; containerized micro-services bridging local and public cloud environments


Cloud deployment dominates (~82.40% share in 2025) due to SaaS scalability and lower upfront investment. Hybrid configurations post the fastest trajectory (39.02% CAGR) as multinational enterprises split sensitive data onto local clusters while routing burst workloads through public clouds. Small, domain-tuned language models performing efficiently on CPU cores make local inference increasingly practical, accelerating hybrid adoption for automated content audit and gap analysis at the edge. On-premise instances retain niche value at USD 0.15 Billion (2025), serving defense and classified healthcare customers requiring complete data isolation.

By Organization Size

Sub-SegmentKey Trend
SMEsAffordable SaaS plans, pre-built workflows, and template libraries enabling enterprise-grade personalization with lean teams
Large EnterprisesComplex compliance requirements, multi-brand orchestration, and cross-department AI governance are driving premium spend


SMEs controlled ~63.10% of 2025 revenue and generated the steepest growth as consumption-based plans let lean teams access AI-powered content tagging and classification capabilities previously reserved for large enterprises. Automated captioning, image generation, and editorial quality checks have become competitive necessities for small businesses. Large Enterprises retain significant spending power at USD 0.80 Billion (2025) but face longer procurement cycles due to compliance review, cross-departmental coordination, and multi-brand governance requirements.

By End-User Vertical

Sub-SegmentKey Trend
Media and EntertainmentContent volume management; audience targeting; multi-platform asset optimization across streaming and social
Government and Public SectorDigital accessibility mandates (WCAG 3.0), citizen engagement; multilingual public communications
Healthcare and Life SciencesRegulatory content compliance; patient communication personalization; clinical trial documentation
BFSIPersonalized financial communications; regulatory-compliant marketing; omnichannel customer engagement
Retail and E-CommerceOmnichannel product content; dynamic merchandising; social commerce content optimization


Media and Entertainment anchors the vertical mix (~27.70% of 2025 revenue) as publishers and studios require content performance intelligence platforms to manage thousands of daily assets across streaming, social, and web properties. Healthcare and Life Sciences registers the fastest growth (34.72% CAGR), driven by compliance-heavy workflows where NLP-based personalization engines must navigate regulatory guardrails while delivering patient-centric communications. Government and Public Sector expands at 30.50% CAGR as WCAG accessibility mandates cascade globally. BFSI contributed USD 0.31 Billion in 2025, leveraging content intelligence for personalized financial communications. Retail and E-Commerce grows at 33.20% CAGR, propelled by omnichannel product content and dynamic merchandising demands.

SEGMENTATION QUICK REFERENCE

DimensionSub-SegmentsDominant Segment (2025)Fastest Growing
ComponentSolution · ServiceSolution (~68.20%)Service (35.87% CAGR)
DeploymentCloud · On-Premise · HybridCloud (~82.40%)Hybrid (39.02% CAGR)
Organization SizeSMEs · Large EnterprisesSMEs (~63.10%)SMEs (leading volume growth)
End-User VerticalMedia & Entertainment · Government & Public Sector · Healthcare & Life Sciences · BFSI · Retail & E-CommerceMedia & Entertainment (~27.70%)Healthcare & Life Sciences (34.72% CAGR)