• Cat-intel
  • MedIntelliX
  • Resources
  • About Us
  • English
    Chinese
    French
    Japanese
    Korean
    German
    Spanish

    Compounding Chemotherapy Market Size

    ID: MRFR/Pharma/8901-CR
    193 Pages
    Rahul Gotadki
    December 2020

    Compounding Chemotherapy Market Research Report Information By Dose (Chemotherapeutic and Non-Chemotherapeutics), By Delivery Method (Gravimetric Automated Compounding Device and Volumetric Automated Compounding Device), By Sterility (Sterile and Non-Sterile), By Technology (With Robotic Arms and Without Robotic Arms), and By Region (North America, Europe, Asia-Pacific, And Rest Of The World) –...

    Share:
    Download PDF ×

    We do not share your information with anyone. However, we may send you emails based on your report interest from time to time. You may contact us at any time to opt-out.

    Compounding Chemotherapy Market Infographic
    $ 4,950.0
    $ 5,950.0
    $ 7,250.0

    Compounding Chemotherapy Size

    Compounding Chemotherapy Market Growth Projections and Opportunities

    The increase in the compounding chemotherapy market is happening because more people are getting cancer, and there are new treatments and technologies being used. Things like robots are now being used to help make these special medicines. Also, governments are doing things to make more people aware of cancer, and there are new systems that make compounding medicines easier. TYPES OF COMPOUNDED MEDICINES When it comes to the dose of these medicines, there are two types: chemotherapeutic and non-chemotherapeutic. Chemotherapeutic medicines, used for treating cancer, are the most common and were worth $277.05 million in 2019. They are expected to grow the fastest, at a rate of 6.38%. The way these medicines are compounded, or put together, can be different too. There are three types: Pharmaceutical Ingredient Alteration (PIA), Currently Unavailable Pharmaceutical Manufacturing (CUPM), and Pharmaceutical Dosage Alteration (PDA). The PIA type is the most common and was worth $178.95 million in 2019. The PDA type is also growing fast, at a rate of 6.45%. The method of delivering these medicines is another thing to consider. There are two ways: gravimetric automated compounding device (weight based) and volumetric automated compounding device (volume based). The weight-based method is the most common and was worth $265.46 million in 2019. The volume-based method is also growing fast, at a rate of 7.31%. LOOKING TO THE FUTURE The compounding chemotherapy market is growing because more people are getting cancer, and there are better and more advanced ways to treat it. The medicines can be customized based on the specific needs of each patient. The most common type of these medicines is for treating cancer (chemotherapeutic), and there are different ways to make and deliver them. As technology improves and more people become aware of cancer, the market for these customized medicines is expected to keep growing in the future. This is good news for people who need these special medicines to get better.

    Compounding Chemotherapy Market Size Graph

    Market Summary

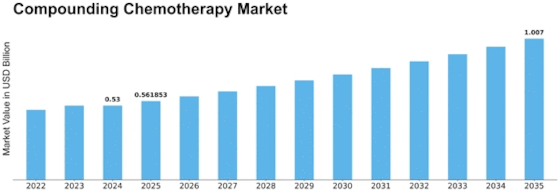
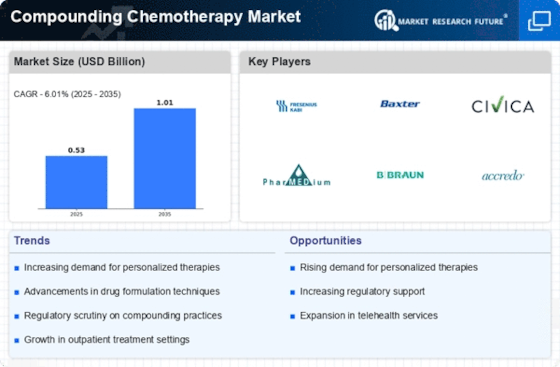
    The Global Compounding Chemotherapy Market is projected to grow from 0.53 USD Billion in 2024 to 1.01 USD Billion by 2035, indicating a robust growth trajectory.

    Key Market Trends & Highlights

    Compounding Chemotherapy Key Trends and Highlights

    • The market is expected to achieve a compound annual growth rate (CAGR) of 5.95 percent from 2025 to 2035.
    • By the end of 2035, the market valuation is anticipated to reach 1.0 USD Billion, reflecting increasing demand.
    • in 2024, the market is valued at 0.53 USD Billion, highlighting its current size and potential for expansion.
    • Growing adoption of personalized medicine due to the rising prevalence of cancer is a major market driver.

    Market Size & Forecast

    2024 Market Size 0.53 (USD Billion)
    2035 Market Size 1.01 (USD Billion)
    CAGR (2025-2035) 6.01%
    Largest Regional Market Share in 2024 south_america)

    Major Players

    Braun Melsungen AG, Pfizer Inc., Baxter, Grifols SA, The Metrix Company, Added Pharma, Equashield, Millers Pharmacy

    Market Trends

    Growing Dermatological Diseases and Increasing Pharmaceutical R&D to market growth

    The Global Compounding Chemotherapy Market is poised for growth as healthcare systems increasingly recognize the necessity of personalized treatment regimens tailored to individual patient needs.

    U.S. Food and Drug Administration (FDA)

    Compounding Chemotherapy Market Market Drivers

    Rising Cancer Incidence

    The Global Compounding Chemotherapy Market Industry is experiencing growth due to the increasing incidence of cancer worldwide. According to the World Health Organization, cancer cases are projected to rise significantly, with an estimated 19.3 million new cases in 2024. This surge necessitates the development of personalized chemotherapy regimens, which compounding pharmacies can provide. The ability to tailor treatments to individual patient needs enhances efficacy and minimizes side effects, thereby driving demand for compounded chemotherapy solutions. As a result, the market is expected to reach 0.53 USD Billion in 2024, reflecting the urgent need for innovative treatment options.

    Market Growth Projections

    The Global Compounding Chemotherapy Market Industry is poised for substantial growth, with projections indicating a market size of 0.53 USD Billion in 2024 and an anticipated increase to 1.0 USD Billion by 2035. This growth trajectory, characterized by a CAGR of 5.95% from 2025 to 2035, reflects the rising demand for personalized cancer treatments and the expanding role of compounding pharmacies in the healthcare landscape. As the industry evolves, it is essential to monitor these trends and their implications for stakeholders, including healthcare providers, patients, and regulatory bodies.

    Patient-Centric Treatment Approaches

    The shift towards patient-centric treatment approaches significantly influences the Global Compounding Chemotherapy Market Industry. Patients are increasingly seeking personalized therapies that cater to their unique health profiles. Compounding pharmacies play a vital role in this trend by offering tailored chemotherapy solutions that address specific patient needs, such as allergies to certain ingredients or dosage adjustments. This focus on individualized care not only improves treatment adherence but also enhances overall patient satisfaction. Consequently, the demand for compounded chemotherapy is expected to rise, contributing to the market's growth trajectory in the coming years.

    Advancements in Pharmaceutical Technology

    Technological advancements in pharmaceutical compounding are pivotal for the Global Compounding Chemotherapy Market Industry. Innovations in drug formulation and delivery systems enable compounding pharmacies to create more effective and safer chemotherapy drugs. For instance, the introduction of automated compounding systems enhances precision and reduces the risk of contamination. These advancements not only improve patient outcomes but also streamline production processes, making compounded chemotherapy more accessible. As the industry evolves, it is anticipated that the market will grow at a CAGR of 5.95% from 2025 to 2035, reaching an estimated 1.0 USD Billion by 2035.

    Collaboration Between Healthcare Providers

    Collaboration among healthcare providers is a driving force in the Global Compounding Chemotherapy Market Industry. Oncologists, pharmacists, and other healthcare professionals are increasingly working together to develop comprehensive treatment plans that incorporate compounded chemotherapy. This interdisciplinary approach ensures that patients receive optimal care tailored to their specific conditions. Such collaborations can lead to improved treatment outcomes and increased awareness of the benefits of compounded therapies. As healthcare systems continue to embrace teamwork, the demand for compounded chemotherapy is likely to grow, further propelling the market forward.

    Regulatory Support for Compounding Pharmacies

    Regulatory frameworks supporting compounding pharmacies are crucial for the Global Compounding Chemotherapy Market Industry. Governments and health authorities are increasingly recognizing the importance of compounded medications in providing personalized care. For example, the U.S. Food and Drug Administration has established guidelines to ensure the safety and efficacy of compounded drugs. This regulatory support fosters a conducive environment for compounding pharmacies to thrive, thereby enhancing the availability of customized chemotherapy options. As regulations evolve, the market is likely to expand, reflecting the growing acceptance of compounded therapies in cancer treatment.

    Market Segment Insights

    Compounding Chemotherapy Dose Insights

    Based on Dose, the Compounding Chemotherapy market segmentation includes Chemotherapeutic and Non-Chemotherapeutics. The Chemotherapeutic segment held the majority share in 2022 in the Compounding Chemotherapy market data. Chemotherapeutic medicines' greater effectiveness is fostering market expansion. Furthermore, this market's development drivers include the aging population and the rise in cancer incidence.

    Compounding Chemotherapy Delivery method Insights

    Based on the delivery method, the Compounding Chemotherapy market segmentation includes Gravimetric Automated Compounding Devices and Volumetric Automated Compounding Devices. The Gravimetric Automated Compounding Device segment dominated the market growth in 2022 and is projected to be the faster-growing segment during the forecast period, 2024-2032. Gravimetric products are simple to use, making them the market leader.

    Compounding Chemotherapy Sterility Insights

    Based on Sterility, the Compounding Chemotherapy market data includes Sterile and Non-Sterile. The Sterile segment dominated the Compounding Chemotherapy market revenue in 2022 and is projected to be the faster-growing segment during the forecast period 2024-2032. High-efficiency injections and infusions must be sterile to meet consumer demand.

    Figure 1: Compounding Chemotherapy Market, by Sterility, 2023 & 2032 (USD Billion) 

    Source: Secondary Research, Primary Research, Market Research Future Database and Analyst Review

    Compounding Chemotherapy Technology Insights

    Based on Technology, the Compounding Chemotherapy market data includes With Robotic Arms and Without Robotic Arms. The With Robotic Arms segment dominated the Compounding Chemotherapy market revenue in 2022 and is projected to be the faster-growing segment during the forecast period, 2024-2032. Additionally, it is projected to have a high CAGR of 6.4 percent. It is because automated machines are more accurate and predictable.

    Get more detailed insights about Compounding Chemotherapy Market Research Report - Forecast till 2032

    Regional Insights

    By region, the study provides market insights into North America, Europe, Asia-Pacific and the Rest of the World. North America Compounding Chemotherapy market accounted for USD 0.18 billion in 2022 with a share of around 45.80% and is expected to exhibit a significant CAGR growth during the study period. Due to the increasing number of cancer cases, growing healthcare expenses, and the pressing demand for sophisticated Chemotherapy, the American Compounding Chemotherapy market has taken the lead and is expanding at a phenomenal rate. 

    The American industry benefits from the broad emphasis on developing contemporary healthcare practices and enhancing cancer-based treatments. The market value is also driven by the growing older population, which is vulnerable to various cancers. According to the Population Reference Bureau, by 2060, there will be 24% more older adults in the United States than there are today. These figures guarantee that compounded Chemotherapy will continue to be in demand in the upcoming years.

    Further, the major countries studied in the market report are The U.S., Canada, Germany, France, the U.K., Italy, Spain, China, Japan, India, Australia, South Korea, and Brazil.

    Figure 2: COMPOUNDING CHEMOTHERAPY MARKET SHARE BY REGION 2022 (%) COMPOUNDING CHEMOTHERAPY MARKET SHARE BY REGION 2022

    Source: Secondary Research, Primary Research, Market Research Future Database and Analyst Review

    Because of the spike in government-sponsored research efforts to find a cure for cancer, which are increasing at an alarming rate, the European Compounding Chemotherapy market is anticipated to occupy second place in terms of revenue throughout the analysis period. The high cost of healthcare, the presence of well-known businesses, and the local healthcare infrastructure quality also influence the area's market size. Moreover, the U.K. Compounding Chemotherapy market held the largest market share, and the Germany Compounding Chemotherapy market was the fastest-growing market in the region.

    The Asia Pacific Compounding Chemotherapy market is anticipated to grow at a significant rate. Compound chemotherapy sales in Asia pacific are segmented into India, China, South Korea, Japan, and Australia. Since governments in many nations support the healthcare sector with funding for active research and development operations, particularly in China and India, the region offers significant growth potential. Additionally, the region's market size is boosted by the sharp increase in cancer incidence, the huge need for efficient medicines, rapidly aging populations, and rising public awareness of cancer and the most recent treatment choices.

    Further, the China Compounding Chemotherapy market held the largest market share, and the India Compounding Chemotherapy market was the fastest-growing market in the region.

    Key Players and Competitive Insights

    Major industry companies are investing a lot of money in R&D to expand their product offerings, which will spur further market expansion for Compounding Chemotherapy. With significant industry changes, including new product launches, mergers and acquisitions, contractual agreements, higher investments, and collaboration with other organizations, market developments are also undertaking various strategic activities to expand their presence. Compounding Chemotherapy industry competitors must provide affordable products to grow and remain in a market that is becoming increasingly competitive.

    Manufacturing locally to cut operational costs is one of the main business methods producers use in the Compounding Chemotherapy industry to benefit customers and increase the market sector. The Compounding Chemotherapy industry has recently given medicine some of the most important advantages. The Compounding Chemotherapy market major player such as Braun Melsungen AG, Pfizer Inc., Baxter, Grifols SA, The Metrix Company, Added Pharma, Equashield, and Millers Pharmacy Company.

    Research Triangle Park, North Carolina, serves as the corporate headquarters for the American biopharmaceutical business G1 Therapeutics, Inc. The business focuses on creating and marketing small-molecule therapies for the treatment of cancer patients. In March 2021, Boehringer Ingelheim and G1 Therapeutics Inc. collaborated to release COSELA (dinaciclib) on the American market. The businesses will now market COSELA after the USFDA gave it the go-ahead. It is said to lower the likelihood of chemotherapy-induced myelosuppression in adults when used with an etoposide/platinum-containing regimen for small-cell lung cancer. Combined with Chemotherapy, it is the only cancer treatment that safeguards the bone marrow.

    The corporate headquarters of the multinational food and beverage processing conglomerate Nestlé S.A. are in Vevey, Vaud, Switzerland. Since 2014, based on revenue and other indicators, it has been the world's largest publicly traded food company. In 2022, Nestle S.A. stated that the company is investigating cutting-edge Technology to create dairy protein-based products without using animals.

    Pfizer Inc. is a worldwide pharmaceutical and biotechnology company with its main office in Manhattan, New York City, on 42nd Street. In March 2021, LORBRENA's indication was expanded to include first-line therapy for patients with anaplastic lymphoma kinase-positive non-small cell lung cancer as a result of the FDA's approval of Pfizer Inc.'s sNDA for LORBRENA. LORBRENA is a third-generation ALK inhibitor created to treat brain metastases and tumor alterations that hasten the development of drug resistance.

    Key Companies in the Compounding Chemotherapy Market market include

    Industry Developments

      • March 2021:The establishment of Revelation Pharma Corp. has been announced by Osceola Capital and seasoned businessman Jacob Beckel to investigate funding and cooperative arrangements in the pharmaceutical compounding sector.

      • April 2019:The list of 43 authorized states maintained by Pentec Health, Inc. now includes California. The business provides advanced in-home clinical services, along with patient-specific compounded sterile medications.

      • May 2019:A contract was reached by Fagron to acquire Central de Drogas, S.A. de C.V., a supplier of raw materials to Mexico's pharmaceutical sector and compounding pharmacies.

    Future Outlook

    Compounding Chemotherapy Market Future Outlook

    The Global Compounding Chemotherapy Market is projected to grow at a 6.01% CAGR from 2025 to 2035, driven by technological advancements, increasing cancer prevalence, and regulatory support.

    New opportunities lie in:

    • Develop personalized chemotherapy formulations to enhance treatment efficacy.
    • Invest in automation technologies to streamline compounding processes.
    • Expand telepharmacy services to improve access to compounded chemotherapy.

    By 2035, the market is expected to achieve robust growth, reflecting advancements in compounding practices and increased demand.

    Market Segmentation

    Compounding Chemotherapy Dose Outlook 

    • Chemotherapeutic
    • Non-Chemotherapeutics

    Compounding Chemotherapy Regional Outlook 

    Asia-Pacific
    • China
    • Japan
    • India
    • Australia
    • South Korea
    • Rest of Asia-Pacific

    Compounding Chemotherapy Sterility Outlook 

    • Sterile
    • Non-Sterile

    Compounding Chemotherapy Technology Outlook 

    • With Robotic Arms
    • Without Robotic Arms

    Compounding Chemotherapy Delivery Method Outlook 

    • Gravimetric Automated Compounding Device
    • Volumetric Automated Compounding Device

    Report Scope

    Report Attribute/Metric Details
    Market Size 2024 USD 0.53 billion
    Market Size 2035 1.01 (Value (USD Billion))
    Compound Annual Growth Rate (CAGR) 6.01% (2025 - 2035)
    Base Year 2024
    Market Forecast Period 2025 - 2035
    Historical Data 2018 - 2021
    Market Forecast Units Value (USD Billion)
    Report Coverage Revenue Forecast, Market Competitive Landscape, Growth Factors, and Trends
    Segments Covered Variety, Form, Distribution Channel and Region
    Geographies Covered North America, Europe, Asia Pacific, and the Rest of the World
    Countries Covered The U.S, Canada, Germany, France, the U.K., Italy, Spain, China, Japan, India, Australia, South Korea, and Brazil
    Key Companies Profiled Braun Melsungen AG, Pfizer Inc., Baxter, Grifols SA, The Metrix Company, Added Pharma, Equashield, Millers Pharmacy.  
    Key Market Opportunities Opioid scarcity
    Key Market Dynamics Technical Advances Cutting-Edge Strategie
    Market Size 2025 0.56 (Value (USD Billion))

    Market Highlights

    Author

    Rahul Gotadki
    Assistant Manager

    She holds an experience of about 6+ years in market research and business consulting, working under the spectrum of information communication technology, telecommunications and semiconductor domains. aarti conceptualizes and implements a scalable business strategy and provides strategic leadership to the clients. her expertise lies in market estimation, competitive intelligence, pipeline analysis, customer assessment, etc.

    Leave a Comment

    Latest Comments

    John Doe
    john@example.com

    This is a great article! Really helped me understand the topic better.

    Posted on July 23, 2025, 10:15 AM
    Jane Smith
    jane@domain.com

    Thanks for sharing this. I’ve bookmarked it for later reference.

    Posted on July 22, 2025, 7:45 PM

    FAQs

    1. Executive Summary
    2. Market Introduction
      1. DEFINITION 21
      2. Scope of the Study 21
      3. RESEARCH OBJECTIVE 21
      4. MARKET STRUCTURE 22
      5. ASSUMPTIONS & LIMITATIONS 23
    3. Research Methodology
      1. DATA MINING 24
      2. SECONDARY RESEARCH 25
      3. PRIMARY RESEARCH 26
      4. BREAKDOWN OF PRIMARY RESPONDENTS 27
      5. FORECASTING TECHNIQUES 28
      6. Research Methodology FOR MARKET SIZE ESTIMATION 29
        1. Bottom-up Approach 30
        2. TOP-DOWN APPROACH 30
      7. DATA TRIANGULATION 31
      8. VALIDATION 31
    4. MARKET DYNAMICS
      1. OVERVIEW 32
      2. DRIVERS 33
        1. TECHNOLOGICAL DEVELOPMENTS AND GROUND-BREAKING TECHNIQUES 33
        2. INCREASE IN DRUGS SHORTAGE COMPRISING CANCER MEDICINES 34
        3. RISE IN AWARENESS AND ADAPTATION OF NEW TECHNOLOGIES AMONG CANCER HOSPITALS 34
        4. RISING PREVALENCE OF CANCER PATIENTS 34
      3. RESTRAINTS 36
        1. DEARTH OF PRACTICED PHARMACISTS AND LAB TECHNICIANS 36
      4. OPPORTUNITIES 36
        1. NEW PRODUCT INNOVATIONS 36
        2. RISE IN PARTNERSHIPS & COLLABORATIONS 36
    5. MARKET FACTOR ANALYSIS
      1. VALUE CHAIN ANALYSIS 37
        1. R&D AND DESIGNING 37
        2. MANUFACTURING 38
        3. DISTRIBUTION & SALES 38
        4. POST SALES SERVICES 38
      2. PORTER’S FIVE FORCES MODEL 38
        1. BARGAINING POWER OF SUPPLIERS 39
        2. BARGAINING POWER OF BUYERS 39
        3. THREAT OF NEW ENTRANTS 39
        4. THREAT OF SUBSTITUTES 40
        5. INTENSITY OF RIVALRY 40
      3. COVID-19 IMPACT ANALYSIS 40
        1. IMPACT ON SUPPLY CHAIN 41
        2. IMPACT ON PRODUCTION 41
        3. IMPACT ON REGIONS 41
        4. DEMAND-SUPPLY GAP ANALYSIS 41
      4. LIST OF POTENTIAL CUSTOMERS 42
    6. GLOBAL COMPOUNDING CHEMOTHERAPY MARKET, BY DOSE
      1. OVERVIEW 45
      2. CHEMOTHERAPEUTIC 46
      3. NON-CHEMOTHERAPEUTICS 46
    7. GLOBAL COMPOUNDING CHEMOTHERAPY MARKET, BY COMPOUNDING TYPE
      1. OVERVIEW 47
      2. PHARMACEUTICAL INGREDIENT ALTERATION (PIA) 48
      3. CURRENTLY UNAVAILABLE PHARMACEUTICAL MANUFACTURING (CUPM) 49
      4. PHARMACEUTICAL DOSAGE ALTERATION (PDA) 50
    8. GLOBAL COMPOUNDING CHEMOTHERAPY MARKET, BY DELIVERY METHOD
      1. OVERVIEW 51
      2. GRAVIMETRIC AUTOMATED COMPOUNDING DEVICE (WEIGHT-BASED) 52
      3. VOLUMETRIC AUTOMATED COMPOUNDING DEVICE (VOLUME-BASED) 53
    9. GLOBAL COMPOUNDING CHEMOTHERAPY MARKET, BY STERILITY
      1. OVERVIEW 54
      2. STERILE 55
      3. NON-STERILE 56
    10. GLOBAL COMPOUNDING CHEMOTHERAPY MARKET, BY TECHNOLOGY
      1. OVERVIEW 57
      2. WITH ROBOTIC ARMS 58
      3. WITHOUT ROBOTIC ARMS 59
    11. GLOBAL COMPOUNDING CHEMOTHERAPY MARKET, BY COMPOUNDER TYPE
      1. OVERVIEW 60
      2. PHARMODUCT 61
      3. EQUASHIELD PRO 61
      4. MEDIMIX 61
      5. INTEGRA 61
      6. OTHERS 61
    12. GLOBAL COMPOUNDING CHEMOTHERAPY MARKET, BY APPLICATION
      1. OVERVIEW 62
      2. BREAST CANCER 63
      3. BLOOD CANCER 64
      4. PROSTATE CANCER 65
      5. GASTROINTESTINAL CANCER 66
      6. RESPIRATORY/LUNG CANCER 66
      7. OTHERS 67
    13. GLOBAL COMPOUNDING CHEMOTHERAPY MARKET, BY REGION
      1. OVERVIEW 68
      2. AMERICAS 69
        1. NORTH AMERICA 73
        2. LATIN AMERICA 82
      3. EUROPE 92
        1. WESTERN EUROPE 96
        2. EASTERN EUROPE 117
      4. ASIA-PACIFIC 121
        1. CHINA 125
        2. JAPAN 127
        3. INDIA 130
        4. AUSTRALIA 133
        5. SOUTH KOREA 136
        6. REST OF ASIA-PACIFIC 139
      5. MIDDLE EAST & AFRICA 142
        1. MIDDLE EAST 145
        2. AFRICA 148
    14. Competitive Landscape
      1. OVERVIEW 151
      2. COMPETITOR DASHBOARD 152
      3. MAJOR GROWTH STRATEGY IN THE GLOBAL COMPOUNDING CHEMOTHERAPY MARKET 153
      4. MARKET SHARE ANALYSIS 153
      5. COMPETITIVE BENCHMARKING 154
      6. THE LEADING PLAYERS IN TERMS OF NUMBER OF DEVELOPMENTS IN THE GLOBAL COMPOUNDING CHEMOTHERAPY MARKET 155
      7. KEY DEVELOPMENTS & GROWTH STRATEGIES 156
      8. KEY DEVELOPMENTS & GROWTH STRATEGIES 156
        1. ACQUISITION 156
        2. COLLABORATION 156
        3. PARTNERSHIP 157
        4. COLLABORATION 157
    15. COMPANY PROFILE
      1. B. BRAUN MELSUNGEN AG 158
        1. COMPANY OVERVIEW 158
        2. FINANCIAL OVERVIEW 158
        3. PRODUCTS/SERVICES OFFERED 159
        4. KEY DEVELOPMENTS 159
        5. SWOT ANALYSIS 160
        6. KEY STRATEGIES 160
      2. PFIZER INC. 161
        1. COMPANY OVERVIEW 161
        2. FINANCIAL OVERVIEW 161
        3. PRODUCTS/SERVICES OFFERED 162
        4. KEY DEVELOPMENTS 162
        5. SWOT ANALYSIS 162
        6. KEY STRATEGIES 163
      3. BAXTER 164
        1. COMPANY OVERVIEW 164
        2. FINANCIAL OVERVIEW 164
        3. PRODUCTS/SERVICES OFFERED 165
        4. KEY DEVELOPMENTS 165
        5. SWOT ANALYSIS 165
        6. KEY STRATEGIES 166
      4. GRIFOLS, S.A. 167
        1. COMPANY OVERVIEW 167
        2. FINANCIAL OVERVIEW 167
        3. PRODUCTS/SERVICES OFFERED 168
        4. KEY DEVELOPMENTS 168
        5. SWOT ANALYSIS 168
        6. KEY STRATEGIES 169
      5. THE METRIX COMPANY 170
        1. COMPANY OVERVIEW 170
        2. FINANCIAL OVERVIEW 170
        3. PRODUCTS/SERVICES OFFERED 170
        4. KEY DEVELOPMENTS 170
        5. SWOT ANALYSIS 171
        6. KEY STRATEGIES 171
      6. ADDED PHARMA 172
        1. COMPANY OVERVIEW 172
        2. FINANCIAL OVERVIEW 172
        3. PRODUCTS/SERVICES OFFERED 172
        4. KEY DEVELOPMENTS 173
        5. SWOT ANALYSIS 173
        6. KEY STRATEGIES 173
      7. EQUASHIELD 174
        1. COMPANY OVERVIEW 174
        2. FINANCIAL OVERVIEW 174
        3. PRODUCTS/SERVICES OFFERED 174
        4. KEY DEVELOPMENTS 174
        5. SWOT ANALYSIS 175
        6. KEY STRATEGIES 175
      8. MILLERS PHARMACY 176
        1. COMPANY OVERVIEW 176
        2. FINANCIAL OVERVIEW 176
        3. PRODUCTS/SERVICES OFFERED 176
        4. KEY DEVELOPMENTS 176
        5. SWOT ANALYSIS 177
        6. KEY STRATEGIES 177
      9. COMECER S.P.A. 178
        1. COMPANY OVERVIEW 178
        2. FINANCIAL OVERVIEW 178
        3. PRODUCTS/SERVICES OFFERED 178
        4. SWOT ANALYSIS 179
        5. KEY STRATEGIES 179
      10. OMNICELL 180
        1. COMPANY OVERVIEW 180
        2. FINANCIAL OVERVIEW 180
        3. PRODUCTS/SERVICES OFFERED 180
        4. SWOT ANALYSIS 181
        5. KEY STRATEGIES 181
      11. ICON GROUP 182
        1. COMPANY OVERVIEW 182
        2. FINANCIAL OVERVIEW 182
        3. PRODUCTS/SERVICES OFFERED 182
        4. KEY DEVELOPMENTS 183
        5. SWOT ANALYSIS 184
        6. KEY STRATEGIES 184
      12. DEDALUS GROUP 185
        1. COMPANY OVERVIEW 185
        2. FINANCIAL OVERVIEW 185
        3. PRODUCTS/SERVICES OFFERED 185
        4. KEY DEVELOPMENTS 185
        5. SWOT ANALYSIS 186
        6. KEY STRATEGIES 186
      13. ARXIUM 187
        1. COMPANY OVERVIEW 187
        2. FINANCIAL OVERVIEW 187
        3. PRODUCTS/SERVICES OFFERED 187
        4. KEY DEVELOPMENTS 187
        5. SWOT ANALYSIS 188
        6. KEY STRATEGIES 188
      14. STERILINE S.R.L. 189
        1. COMPANY OVERVIEW 189
        2. FINANCIAL OVERVIEW 189
        3. PRODUCTS/SERVICES OFFERED 189
        4. KEY DEVELOPMENTS 189
        5. SWOT ANALYSIS 190
        6. KEY STRATEGIES 190
      15. LOCCIONI 191
        1. COMPANY OVERVIEW 191
        2. PRODUCTS/SERVICES OFFERED 191
        3. KEY DEVELOPMENTS 191
        4. SWOT ANALYSIS 192
        5. KEY STRATEGIES 192
    16. APPENDIX
      1. REFERENCES 193
      2. RELATED REPORTS 193
    17. List of Tables and Figures
      1. 17 LIST OF TABLES
      2. TABLE 1 LIST OF ASSUMPTIONS & LIMITATIONS 23
      3. TABLE 2 PRIMARY INTERVIEWS AND INFORMATION GATHERING PROCESS 26
      4. TABLE 3 LIST OF POTENTIAL CUSTOMERS FOR GLOBAL COMPOUNDING CHEMOTHERAPY MARKET 42
      5. TABLE 1 GLOBAL COMPOUNDING CHEMOTHERAPY MARKET, BY DOSE, 2022–2030 (USD MILLION) 45
      6. TABLE 2 GLOBAL COMPOUNDING CHEMOTHERAPY MARKET FOR CHEMOTHERAPEUTIC, BY REGION, 2022–2030 (USD MILLION) 46
      7. TABLE 3 GLOBAL COMPOUNDING CHEMOTHERAPY MARKET FOR NON-CHEMOTHERAPEUTICS, BY REGION, 2022–2030 (USD MILLION) 46
      8. TABLE 4 GLOBAL COMPOUNDING CHEMOTHERAPY MARKET, BY COMPOUNDING TYPE, 2022–2030 (USD MILLION) 48
      9. TABLE 5 GLOBAL COMPOUNDING CHEMOTHERAPY MARKET FOR PHARMACEUTICAL INGREDIENT ALTERATION (PIA), BY REGION, 2022–2030 (USD MILLION) 48
      10. TABLE 6 GLOBAL COMPOUNDING CHEMOTHERAPY MARKET FOR CURRENTLY UNAVAILABLE PHARMACEUTICAL MANUFACTURING, BY REGION, 2022–2030 (USD MILLION) 49
      11. TABLE 7 GLOBAL COMPOUNDING CHEMOTHERAPY MARKET FOR PHARMACEUTICAL DOSAGE ALTERATION, BY REGION, 2022–2030 (USD MILLION) 50
      12. TABLE 8 GLOBAL COMPOUNDING CHEMOTHERAPY MARKET, BY DELIVERY METHOD, 2022–2030 (USD MILLION) 52
      13. TABLE 9 GLOBAL COMPOUNDING CHEMOTHERAPY MARKET FOR GRAVIMETRIC AUTOMATED COMPOUNDING DEVICE, BY REGION, 2022–2030 (USD MILLION) 52
      14. TABLE 10 GLOBAL COMPOUNDING CHEMOTHERAPY MARKET FOR VOLUMETRIC AUTOMATED COMPOUNDING DEVICE, BY REGION, 2022–2030 (USD MILLION) 53
      15. TABLE 11 GLOBAL COMPOUNDING CHEMOTHERAPY MARKET, BY STERILITY, 2022–2030 (USD MILLION) 54
      16. TABLE 12 GLOBAL COMPOUNDING CHEMOTHERAPY MARKET FOR STERILE, BY REGION, 2022–2030 (USD MILLION) 55
      17. TABLE 13 GLOBAL COMPOUNDING CHEMOTHERAPY MARKET FOR NON-STERILE, BY REGION, 2022–2030 (USD MILLION) 56
      18. TABLE 14 GLOBAL COMPOUNDING CHEMOTHERAPY MARKET, BY TECHNOLOGY, 2022–2030 (USD MILLION) 57
      19. TABLE 15 GLOBAL COMPOUNDING CHEMOTHERAPY MARKET FOR WITH ROBOTIC ARMS, BY REGION, 2022–2030 (USD MILLION) 58
      20. TABLE 16 GLOBAL COMPOUNDING CHEMOTHERAPY MARKET FOR WITH ROBOTIC ARMS, BY TYPE, 2022–2030 (USD MILLION) 58
      21. TABLE 17 GLOBAL COMPOUNDING CHEMOTHERAPY MARKET FOR WITHOUT ROBOTIC ARMS, BY REGION, 2022–2030 (USD MILLION) 59
      22. TABLE 18 GLOBAL COMPOUNDING CHEMOTHERAPY MARKET, BY COMPOUNDER TYPE, 2022–2030 (USD MILLION) 60
      23. TABLE 19 GLOBAL COMPOUNDING CHEMOTHERAPY MARKET, BY APPLICATION, 2022–2030 (USD MILLION) 63
      24. TABLE 20 GLOBAL COMPOUNDING CHEMOTHERAPY MARKET FOR BREAST CANCER, BY REGION, 2022–2030 (USD MILLION) 63
      25. TABLE 21 GLOBAL COMPOUNDING CHEMOTHERAPY MARKET FOR BLOOD CANCER, BY REGION, 2022–2030 (USD MILLION) 64
      26. TABLE 22 GLOBAL COMPOUNDING CHEMOTHERAPY MARKET FOR PROSTATE CANCER, BY REGION, 2022–2030 (USD MILLION) 65
      27. TABLE 23 GLOBAL COMPOUNDING CHEMOTHERAPY MARKET FOR GASTROINTESTINAL CANCER, BY REGION, 2022–2030 (USD MILLION) 66
      28. TABLE 24 GLOBAL COMPOUNDING CHEMOTHERAPY MARKET FOR RESPIRATORY/LUNG CANCER, BY REGION, 2022–2030 (USD MILLION) 66
      29. TABLE 25 GLOBAL COMPOUNDING CHEMOTHERAPY MARKET FOR OTHER CANCER APPLICATIONS, BY REGION, 2022–2030 (USD MILLION) 67
      30. TABLE 26 GLOBAL COMPOUNDING CHEMOTHERAPY MARKET, BY REGION, 2022–2030 (USD MILLION) 68
      31. TABLE 27 AMERICAS COMPOUNDING CHEMOTHERAPY MARKET, BY REGION, 2022–2030 (USD MILLION) 69
      32. TABLE 28 AMERICAS COMPOUNDING CHEMOTHERAPY MARKET, BY DOSE, 2022–2030 (USD MILLION) 70
      33. TABLE 29 AMERICAS COMPOUNDING CHEMOTHERAPY MARKET, BY COMPOUNDING TYPE, 2022–2030 (USD MILLION) 70
      34. TABLE 30 AMERICAS COMPOUNDING CHEMOTHERAPY MARKET, BY DELIVERY METHOD, 2022–2030 (USD MILLION) 71
      35. TABLE 31 AMERICAS COMPOUNDING CHEMOTHERAPY MARKET, BY STERILITY, 2022–2030 (USD MILLION) 71
      36. TABLE 32 AMERICAS COMPOUNDING CHEMOTHERAPY MARKET, BY TECHNOLOGY, 2022–2030 (USD MILLION) 71
      37. TABLE 33 AMERICAS COMPOUNDING CHEMOTHERAPY MARKET FOR WITH ROBOTIC ARMS, BY TYPE, 2022–2030 (USD MILLION) 72
      38. TABLE 34 AMERICAS COMPOUNDING CHEMOTHERAPY MARKET, BY COMPOUNDER TYPE, 2022–2030 (USD MILLION) 72
      39. TABLE 35 AMERICAS COMPOUNDING CHEMOTHERAPY MARKET, BY APPLICATION, 2022–2030 (USD MILLION) 72
      40. TABLE 36 NORTH AMERICA COMPOUNDING CHEMOTHERAPY MARKET, BY COUNTRY, 2022–2030 (USD MILLION) 73
      41. TABLE 37 NORTH AMERICA COMPOUNDING CHEMOTHERAPY MARKET, BY DOSE, 2022–2030 (USD MILLION) 73
      42. TABLE 38 NORTH AMERICA COMPOUNDING CHEMOTHERAPY MARKET, BY COMPOUNDING TYPE, 2022–2030 (USD MILLION) 74
      43. TABLE 39 NORTH AMERICA COMPOUNDING CHEMOTHERAPY MARKET, BY DELIVERY METHOD, 2022–2030 (USD MILLION) 74
      44. TABLE 40 NORTH AMERICA COMPOUNDING CHEMOTHERAPY MARKET, BY STERILITY, 2022–2030 (USD MILLION) 74
      45. TABLE 41 NORTH AMERICA COMPOUNDING CHEMOTHERAPY MARKET, BY TECHNOLOGY, 2022–2030 (USD MILLION) 75
      46. TABLE 42 NORTH AMERICA COMPOUNDING CHEMOTHERAPY MARKET FOR WITH ROBOTIC ARMS, BY TYPE, 2022–2030 (USD MILLION) 75
      47. TABLE 43 NORTH AMERICA COMPOUNDING CHEMOTHERAPY MARKET, BY COMPOUNDER TYPE, 2022–2030 (USD MILLION) 75
      48. TABLE 44 NORTH AMERICA COMPOUNDING CHEMOTHERAPY MARKET, BY APPLICATION, 2022–2030 (USD MILLION) 76
      49. TABLE 45 US COMPOUNDING CHEMOTHERAPY MARKET, BY DOSE, 2022–2030 (USD MILLION) 76
      50. TABLE 46 US COMPOUNDING CHEMOTHERAPY MARKET, BY COMPOUNDING TYPE, 2022–2030 (USD MILLION) 77
      51. TABLE 47 US COMPOUNDING CHEMOTHERAPY MARKET, BY DELIVERY METHOD, 2022–2030 (USD MILLION) 77
      52. TABLE 48 US COMPOUNDING CHEMOTHERAPY MARKET, BY STERILITY, 2022–2030 (USD MILLION) 78
      53. TABLE 49 US COMPOUNDING CHEMOTHERAPY MARKET, BY TECHNOLOGY, 2022–2030 (USD MILLION) 78
      54. TABLE 50 US COMPOUNDING CHEMOTHERAPY MARKET FOR WITH ROBOTIC ARMS, BY TYPE, 2022–2030 (USD MILLION) 78
      55. TABLE 51 US COMPOUNDING CHEMOTHERAPY MARKET, BY COMPOUNDER TYPE, 2022–2030 (USD MILLION) 79
      56. TABLE 52 US COMPOUNDING CHEMOTHERAPY MARKET, BY APPLICATION, 2022–2030 (USD MILLION) 79
      57. TABLE 53 CANADA COMPOUNDING CHEMOTHERAPY MARKET, BY DOSE, 2022–2030 (USD MILLION) 79
      58. TABLE 54 CANADA COMPOUNDING CHEMOTHERAPY MARKET, BY COMPOUNDING TYPE, 2022–2030 (USD MILLION) 80
      59. TABLE 55 CANADA COMPOUNDING CHEMOTHERAPY MARKET, BY DELIVERY METHOD, 2022–2030 (USD MILLION) 80
      60. TABLE 56 CANADA COMPOUNDING CHEMOTHERAPY MARKET, BY STERILITY, 2022–2030 (USD MILLION) 80
      61. TABLE 57 CANADA COMPOUNDING CHEMOTHERAPY MARKET, BY TECHNOLOGY, 2022–2030 (USD MILLION) 81
      62. TABLE 58 CANADA COMPOUNDING CHEMOTHERAPY MARKET FOR WITH ROBOTIC ARMS, BY TYPE, 2022–2030 (USD MILLION) 81
      63. TABLE 59 CANADA COMPOUNDING CHEMOTHERAPY MARKET, BY COMPOUNDER TYPE, 2022–2030 (USD MILLION) 81
      64. TABLE 60 CANADA COMPOUNDING CHEMOTHERAPY MARKET, BY APPLICATION, 2022–2030 (USD MILLION) 82
      65. TABLE 61 LATIN AMERICA COMPOUNDING CHEMOTHERAPY MARKET, BY COUNTRY/REGION, 2022–2030 (USD MILLION) 82
      66. TABLE 62 LATIN AMERICA COMPOUNDING CHEMOTHERAPY MARKET, BY DOSE, 2022–2030 (USD MILLION) 82
      67. TABLE 63 LATIN AMERICA COMPOUNDING CHEMOTHERAPY MARKET, BY COMPOUNDING TYPE, 2022–2030 (USD MILLION) 83
      68. TABLE 64 LATIN AMERICA COMPOUNDING CHEMOTHERAPY MARKET, BY DELIVERY METHOD, 2022–2030 (USD MILLION) 83
      69. TABLE 65 LATIN AMERICA COMPOUNDING CHEMOTHERAPY MARKET, BY STERILITY, 2022–2030 (USD MILLION) 83
      70. TABLE 66 LATIN AMERICA COMPOUNDING CHEMOTHERAPY MARKET, BY TECHNOLOGY, 2022–2030 (USD MILLION) 84
      71. TABLE 67 LATIN AMERICA COMPOUNDING CHEMOTHERAPY MARKET FOR WITH ROBOTIC ARMS, BY TYPE, 2022–2030 (USD MILLION) 84
      72. TABLE 68 LATIN AMERICA COMPOUNDING CHEMOTHERAPY MARKET, BY COMPOUNDER TYPE, 2022–2030 (USD MILLION) 84
      73. TABLE 69 LATIN AMERICA COMPOUNDING CHEMOTHERAPY MARKET, BY APPLICATION, 2022–2030 (USD MILLION) 85
      74. TABLE 70 BRAZIL COMPOUNDING CHEMOTHERAPY MARKET, BY DOSE, 2022–2030 (USD MILLION) 85
      75. TABLE 71 BRAZIL COMPOUNDING CHEMOTHERAPY MARKET, BY COMPOUNDING TYPE, 2022–2030 (USD MILLION) 86
      76. TABLE 72 BRAZIL COMPOUNDING CHEMOTHERAPY MARKET, BY DELIVERY METHOD, 2022–2030 (USD MILLION) 86
      77. TABLE 73 BRAZIL COMPOUNDING CHEMOTHERAPY MARKET, BY STERILITY, 2022–2030 (USD MILLION) 86
      78. TABLE 74 BRAZIL COMPOUNDING CHEMOTHERAPY MARKET, BY TECHNOLOGY, 2022–2030 (USD MILLION) 87
      79. TABLE 75 BRAZIL COMPOUNDING CHEMOTHERAPY MARKET FOR WITH ROBOTIC ARMS, BY TYPE, 2022–2030 (USD MILLION) 87
      80. TABLE 76 BRAZIL COMPOUNDING CHEMOTHERAPY MARKET, BY COMPOUNDER TYPE, 2022–2030 (USD MILLION) 87
      81. TABLE 77 BRAZIL COMPOUNDING CHEMOTHERAPY MARKET, BY APPLICATION, 2022–2030 (USD MILLION) 88
      82. TABLE 78 REST OF LATIN AMERICA COMPOUNDING CHEMOTHERAPY MARKET, BY DOSE, 2022–2030 (USD MILLION) 88
      83. TABLE 79 REST OF LATIN AMERICA COMPOUNDING CHEMOTHERAPY MARKET, BY COMPOUNDING TYPE, 2022–2030 (USD MILLION) 89
      84. TABLE 80 REST OF LATIN AMERICA COMPOUNDING CHEMOTHERAPY MARKET, BY DELIVERY METHOD, 2022–2030 (USD MILLION) 89
      85. TABLE 81 REST OF LATIN AMERICA COMPOUNDING CHEMOTHERAPY MARKET, BY STERILITY, 2022–2030 (USD MILLION) 89
      86. TABLE 82 REST OF LATIN AMERICA COMPOUNDING CHEMOTHERAPY MARKET, BY TECHNOLOGY, 2022–2030 (USD MILLION) 90
      87. TABLE 83 REST OF LATIN AMERICA COMPOUNDING CHEMOTHERAPY MARKET FOR WITH ROBOTIC ARMS, BY TYPE, 2022–2030 (USD MILLION) 90
      88. TABLE 84 REST OF LATIN AMERICA COMPOUNDING CHEMOTHERAPY MARKET, BY COMPOUNDER TYPE, 2022–2030 (USD MILLION) 90
      89. TABLE 85 REST OF LATIN AMERICA COMPOUNDING CHEMOTHERAPY MARKET, BY APPLICATION, 2022–2030 (USD MILLION) 91
      90. TABLE 86 EUROPE COMPOUNDING CHEMOTHERAPY MARKET, BY REGION, 2022–2030 (USD MILLION) 92
      91. TABLE 87 EUROPE COMPOUNDING CHEMOTHERAPY MARKET, BY DOSE, 2022–2030 (USD MILLION) 93
      92. TABLE 88 EUROPE COMPOUNDING CHEMOTHERAPY MARKET, BY COMPOUNDING TYPE, 2022–2030 (USD MILLION) 93
      93. TABLE 89 EUROPE COMPOUNDING CHEMOTHERAPY MARKET, BY DELIVERY METHOD, 2022–2030 (USD MILLION) 93
      94. TABLE 90 EUROPE COMPOUNDING CHEMOTHERAPY MARKET, BY STERILITY, 2022–2030 (USD MILLION) 94
      95. TABLE 91 EUROPE COMPOUNDING CHEMOTHERAPY MARKET, BY TECHNOLOGY, 2022–2030 (USD MILLION) 94
      96. TABLE 92 EUROPE COMPOUNDING CHEMOTHERAPY MARKET FOR WITH ROBOTIC ARMS, BY TYPE, 2022–2030 (USD MILLION) 94
      97. TABLE 93 EUROPE COMPOUNDING CHEMOTHERAPY MARKET, BY COMPOUNDER TYPE, 2022–2030 (USD MILLION) 95
      98. TABLE 94 EUROPE COMPOUNDING CHEMOTHERAPY MARKET, BY APPLICATION, 2022–2030 (USD MILLION) 95
      99. TABLE 95 WESTERN EUROPE COMPOUNDING CHEMOTHERAPY MARKET, BY COUNTRY, 2022–2030 (USD MILLION) 96
      100. TABLE 96 WESTERN EUROPE COMPOUNDING CHEMOTHERAPY MARKET, BY DOSE, 2022–2030 (USD MILLION) 97
      101. TABLE 97 WESTERN EUROPE COMPOUNDING CHEMOTHERAPY MARKET, BY COMPOUNDING TYPE, 2022–2030 (USD MILLION) 97
      102. TABLE 98 WESTERN EUROPE COMPOUNDING CHEMOTHERAPY MARKET, BY DELIVERY METHOD, 2022–2030 (USD MILLION) 97
      103. TABLE 99 WESTERN EUROPE COMPOUNDING CHEMOTHERAPY MARKET, BY STERILITY, 2022–2030 (USD MILLION) 98
      104. TABLE 100 WESTERN EUROPE COMPOUNDING CHEMOTHERAPY MARKET, BY TECHNOLOGY, 2022–2030 (USD MILLION) 98
      105. TABLE 101 WESTERN EUROPE COMPOUNDING CHEMOTHERAPY MARKET FOR WITH ROBOTIC ARMS, BY TYPE, 2022–2030 (USD MILLION) 98
      106. TABLE 102 WESTERN EUROPE COMPOUNDING CHEMOTHERAPY MARKET, BY COMPOUNDER TYPE, 2022–2030 (USD MILLION) 99
      107. TABLE 103 WESTERN EUROPE COMPOUNDING CHEMOTHERAPY MARKET, BY APPLICATION, 2022–2030 (USD MILLION) 99
      108. TABLE 104 GERMANY COMPOUNDING CHEMOTHERAPY MARKET, BY DOSE, 2022–2030 (USD MILLION) 99
      109. TABLE 105 GERMANY COMPOUNDING CHEMOTHERAPY MARKET, BY COMPOUNDING TYPE, 2022–2030 (USD MILLION) 100
      110. TABLE 106 GERMANY COMPOUNDING CHEMOTHERAPY MARKET, BY DELIVERY METHOD, 2022–2030 (USD MILLION) 100
      111. TABLE 107 GERMANY COMPOUNDING CHEMOTHERAPY MARKET, BY STERILITY, 2022–2030 (USD MILLION) 100
      112. TABLE 108 GERMANY COMPOUNDING CHEMOTHERAPY MARKET, BY TECHNOLOGY, 2022–2030 (USD MILLION) 101
      113. TABLE 109 GERMANY COMPOUNDING CHEMOTHERAPY MARKET FOR WITH ROBOTIC ARMS, BY TYPE, 2022–2030 (USD MILLION) 101
      114. TABLE 110 GERMANY COMPOUNDING CHEMOTHERAPY MARKET, BY COMPOUNDER TYPE, 2022–2030 (USD MILLION) 101
      115. TABLE 111 GERMANY COMPOUNDING CHEMOTHERAPY MARKET, BY APPLICATION, 2022–2030 (USD MILLION) 102
      116. TABLE 112 FRANCE COMPOUNDING CHEMOTHERAPY MARKET, BY DOSE, 2022–2030 (USD MILLION) 102
      117. TABLE 113 FRANCE COMPOUNDING CHEMOTHERAPY MARKET, BY COMPOUNDING TYPE, 2022–2030 (USD MILLION) 103
      118. TABLE 114 FRANCE COMPOUNDING CHEMOTHERAPY MARKET, BY DELIVERY METHOD, 2022–2030 (USD MILLION) 103
      119. TABLE 115 FRANCE COMPOUNDING CHEMOTHERAPY MARKET, BY STERILITY, 2022–2030 (USD MILLION) 103
      120. TABLE 116 FRANCE COMPOUNDING CHEMOTHERAPY MARKET, BY TECHNOLOGY, 2022–2030 (USD MILLION) 104
      121. TABLE 117 FRANCE COMPOUNDING CHEMOTHERAPY MARKET FOR WITH ROBOTIC ARMS, BY TYPE, 2022–2030 (USD MILLION) 104
      122. TABLE 118 FRANCE COMPOUNDING CHEMOTHERAPY MARKET, BY COMPOUNDER TYPE, 2022–2030 (USD MILLION) 104
      123. TABLE 119 FRANCE COMPOUNDING CHEMOTHERAPY MARKET, BY APPLICATION, 2022–2030 (USD MILLION) 105
      124. TABLE 120 UK COMPOUNDING CHEMOTHERAPY MARKET, BY DOSE, 2022–2030 (USD MILLION) 105
      125. TABLE 121 UK COMPOUNDING CHEMOTHERAPY MARKET, BY COMPOUNDING TYPE, 2022–2030 (USD MILLION) 106
      126. TABLE 122 UK COMPOUNDING CHEMOTHERAPY MARKET, BY DELIVERY METHOD, 2022–2030 (USD MILLION) 106
      127. TABLE 123 UK COMPOUNDING CHEMOTHERAPY MARKET, BY STERILITY, 2022–2030 (USD MILLION) 106
      128. TABLE 124 UK COMPOUNDING CHEMOTHERAPY MARKET, BY TECHNOLOGY, 2022–2030 (USD MILLION) 107
      129. TABLE 125 UK COMPOUNDING CHEMOTHERAPY MARKET FOR WITH ROBOTIC ARMS, BY TYPE, 2022–2030 (USD MILLION) 107
      130. TABLE 126 UK COMPOUNDING CHEMOTHERAPY MARKET, BY COMPOUNDER TYPE, 2022–2030 (USD MILLION) 107
      131. TABLE 127 UK COMPOUNDING CHEMOTHERAPY MARKET, BY APPLICATION, 2022–2030 (USD MILLION) 108
      132. TABLE 128 ITALY COMPOUNDING CHEMOTHERAPY MARKET, BY DOSE, 2022–2030 (USD MILLION) 108
      133. TABLE 129 ITALY COMPOUNDING CHEMOTHERAPY MARKET, BY COMPOUNDING TYPE, 2022–2030 (USD MILLION) 109
      134. TABLE 130 ITALY COMPOUNDING CHEMOTHERAPY MARKET, BY DELIVERY METHOD, 2022–2030 (USD MILLION) 109
      135. TABLE 131 ITALY COMPOUNDING CHEMOTHERAPY MARKET, BY STERILITY, 2022–2030 (USD MILLION) 109
      136. TABLE 132 ITALY COMPOUNDING CHEMOTHERAPY MARKET, BY TECHNOLOGY, 2022–2030 (USD MILLION) 110
      137. TABLE 133 ITALY COMPOUNDING CHEMOTHERAPY MARKET FOR WITH ROBOTIC ARMS, BY TYPE, 2022–2030 (USD MILLION) 110
      138. TABLE 134 ITALY COMPOUNDING CHEMOTHERAPY MARKET, BY COMPOUNDER TYPE, 2022–2030 (USD MILLION) 110
      139. TABLE 135 ITALY COMPOUNDING CHEMOTHERAPY MARKET, BY APPLICATION, 2022–2030 (USD MILLION) 111
      140. TABLE 136 SPAIN COMPOUNDING CHEMOTHERAPY MARKET, BY DOSE, 2022–2030 (USD MILLION) 111
      141. TABLE 137 SPAIN COMPOUNDING CHEMOTHERAPY MARKET, BY COMPOUNDING TYPE, 2022–2030 (USD MILLION) 112
      142. TABLE 138 SPAIN COMPOUNDING CHEMOTHERAPY MARKET, BY DELIVERY METHOD, 2022–2030 (USD MILLION) 112
      143. TABLE 139 SPAIN COMPOUNDING CHEMOTHERAPY MARKET, BY STERILITY, 2022–2030 (USD MILLION) 112
      144. TABLE 140 SPAIN COMPOUNDING CHEMOTHERAPY MARKET, BY TECHNOLOGY, 2022–2030 (USD MILLION) 113
      145. TABLE 141 SPAIN COMPOUNDING CHEMOTHERAPY MARKET FOR WITH ROBOTIC ARMS, BY TYPE, 2022–2030 (USD MILLION) 113
      146. TABLE 142 SPAIN COMPOUNDING CHEMOTHERAPY MARKET, BY COMPOUNDER TYPE, 2022–2030 (USD MILLION) 113
      147. TABLE 143 SPAIN COMPOUNDING CHEMOTHERAPY MARKET, BY APPLICATION, 2022–2030 (USD MILLION) 114
      148. TABLE 144 REST OF WESTERN EUROPE COMPOUNDING CHEMOTHERAPY MARKET, BY DOSE, 2022–2030 (USD MILLION) 114
      149. TABLE 145 REST OF WESTERN EUROPE COMPOUNDING CHEMOTHERAPY MARKET, BY COMPOUNDING TYPE, 2022–2030 (USD MILLION) 115
      150. TABLE 146 REST OF WESTERN EUROPE COMPOUNDING CHEMOTHERAPY MARKET, BY DELIVERY METHOD, 2022–2030 (USD MILLION) 115
      151. TABLE 147 REST OF WESTERN EUROPE COMPOUNDING CHEMOTHERAPY MARKET, BY STERILITY, 2022–2030 (USD MILLION) 115
      152. TABLE 148 REST OF WESTERN EUROPE COMPOUNDING CHEMOTHERAPY MARKET, BY TECHNOLOGY, 2022–2030 (USD MILLION) 116
      153. TABLE 149 REST OF WESTERN EUROPE COMPOUNDING CHEMOTHERAPY MARKET FOR WITH ROBOTIC ARMS, BY TYPE, 2022–2030 (USD MILLION) 116
      154. TABLE 150 REST OF WESTERN EUROPE COMPOUNDING CHEMOTHERAPY MARKET, BY COMPOUNDER TYPE, 2022–2030 (USD MILLION) 116
      155. TABLE 151 REST OF WESTERN EUROPE COMPOUNDING CHEMOTHERAPY MARKET, BY APPLICATION, 2022–2030 (USD MILLION) 117
      156. TABLE 152 EASTERN EUROPE COMPOUNDING CHEMOTHERAPY MARKET, BY DOSE, 2022–2030 (USD MILLION) 117
      157. TABLE 153 EASTERN EUROPE COMPOUNDING CHEMOTHERAPY MARKET, BY COMPOUNDING TYPE, 2022–2030 (USD MILLION) 118
      158. TABLE 154 EASTERN EUROPE COMPOUNDING CHEMOTHERAPY MARKET, BY DELIVERY METHOD, 2022–2030 (USD MILLION) 118
      159. TABLE 155 EASTERN EUROPE COMPOUNDING CHEMOTHERAPY MARKET, BY STERILITY, 2022–2030 (USD MILLION) 118
      160. TABLE 156 EASTERN EUROPE COMPOUNDING CHEMOTHERAPY MARKET, BY TECHNOLOGY, 2022–2030 (USD MILLION) 119
      161. TABLE 157 EASTERN EUROPE COMPOUNDING CHEMOTHERAPY MARKET FOR WITH ROBOTIC ARMS, BY TYPE, 2022–2030 (USD MILLION) 119
      162. TABLE 158 EASTERN EUROPE COMPOUNDING CHEMOTHERAPY MARKET, BY COMPOUNDER TYPE, 2022–2030 (USD MILLION) 119
      163. TABLE 159 EASTERN EUROPE COMPOUNDING CHEMOTHERAPY MARKET, BY APPLICATION, 2022–2030 (USD MILLION) 120
      164. TABLE 160 ASIA-PACIFIC COMPOUNDING CHEMOTHERAPY MARKET, BY COUNTRY, 2022–2030 (USD MILLION) 121
      165. TABLE 161 ASIA-PACIFIC COMPOUNDING CHEMOTHERAPY MARKET, BY DOSE, 2022–2030 (USD MILLION) 122
      166. TABLE 162 ASIA-PACIFIC COMPOUNDING CHEMOTHERAPY MARKET, BY COMPOUNDING TYPE, 2022–2030 (USD MILLION) 122
      167. TABLE 163 ASIA-PACIFIC COMPOUNDING CHEMOTHERAPY MARKET, BY DELIVERY METHOD, 2022–2030 (USD MILLION) 123
      168. TABLE 164 ASIA-PACIFIC COMPOUNDING CHEMOTHERAPY MARKET, BY STERILITY, 2022–2030 (USD MILLION) 123
      169. TABLE 165 ASIA-PACIFIC COMPOUNDING CHEMOTHERAPY MARKET, BY TECHNOLOGY, 2022–2030 (USD MILLION) 123
      170. TABLE 166 ASIA-PACIFIC COMPOUNDING CHEMOTHERAPY MARKET FOR WITH ROBOTIC ARMS, BY TYPE, 2022–2030 (USD MILLION) 124
      171. TABLE 167 ASIA-PACIFIC COMPOUNDING CHEMOTHERAPY MARKET, BY COMPOUNDER TYPE, 2022–2030 (USD MILLION) 124
      172. TABLE 168 ASIA-PACIFIC COMPOUNDING CHEMOTHERAPY MARKET, BY APPLICATION, 2022–2030 (USD MILLION) 124
      173. TABLE 169 CHINA COMPOUNDING CHEMOTHERAPY MARKET, BY DOSE, 2022–2030 (USD MILLION) 125
      174. TABLE 170 CHINA COMPOUNDING CHEMOTHERAPY MARKET, BY COMPOUNDING TYPE, 2022–2030 (USD MILLION) 125
      175. TABLE 171 CHINA COMPOUNDING CHEMOTHERAPY MARKET, BY DELIVERY METHOD, 2022–2030 (USD MILLION) 125
      176. TABLE 172 CHINA COMPOUNDING CHEMOTHERAPY MARKET, BY STERILITY, 2022–2030 (USD MILLION) 126
      177. TABLE 173 CHINA COMPOUNDING CHEMOTHERAPY MARKET, BY TECHNOLOGY, 2022–2030 (USD MILLION) 126
      178. TABLE 174 CHINA COMPOUNDING CHEMOTHERAPY MARKET FOR WITH ROBOTIC ARMS, BY TYPE, 2022–2030 (USD MILLION) 126
      179. TABLE 175 CHINA COMPOUNDING CHEMOTHERAPY MARKET, BY COMPOUNDER TYPE, 2022–2030 (USD MILLION) 127
      180. TABLE 176 CHINA COMPOUNDING CHEMOTHERAPY MARKET, BY APPLICATION, 2022–2030 (USD MILLION) 127
      181. TABLE 177 JAPAN COMPOUNDING CHEMOTHERAPY MARKET, BY DOSE, 2022–2030 (USD MILLION) 127
      182. TABLE 178 JAPAN COMPOUNDING CHEMOTHERAPY MARKET, BY COMPOUNDING TYPE, 2022–2030 (USD MILLION) 128
      183. TABLE 179 JAPAN COMPOUNDING CHEMOTHERAPY MARKET, BY DELIVERY METHOD, 2022–2030 (USD MILLION) 128
      184. TABLE 180 JAPAN COMPOUNDING CHEMOTHERAPY MARKET, BY STERILITY, 2022–2030 (USD MILLION) 128
      185. TABLE 181 JAPAN COMPOUNDING CHEMOTHERAPY MARKET, BY TECHNOLOGY, 2022–2030 (USD MILLION) 129
      186. TABLE 182 JAPAN COMPOUNDING CHEMOTHERAPY MARKET FOR WITH ROBOTIC ARMS, BY TYPE, 2022–2030 (USD MILLION) 129
      187. TABLE 183 JAPAN COMPOUNDING CHEMOTHERAPY MARKET, BY COMPOUNDER TYPE, 2022–2030 (USD MILLION) 129
      188. TABLE 184 JAPAN COMPOUNDING CHEMOTHERAPY MARKET, BY APPLICATION, 2022–2030 (USD MILLION) 130
      189. TABLE 185 INDIA COMPOUNDING CHEMOTHERAPY MARKET, BY DOSE, 2022–2030 (USD MILLION) 130
      190. TABLE 186 INDIA COMPOUNDING CHEMOTHERAPY MARKET, BY COMPOUNDING TYPE, 2022–2030 (USD MILLION) 131
      191. TABLE 187 INDIA COMPOUNDING CHEMOTHERAPY MARKET, BY DELIVERY METHOD, 2022–2030 (USD MILLION) 131
      192. TABLE 188 INDIA COMPOUNDING CHEMOTHERAPY MARKET, BY STERILITY, 2022–2030 (USD MILLION) 131
      193. TABLE 189 INDIA COMPOUNDING CHEMOTHERAPY MARKET, BY TECHNOLOGY, 2022–2030 (USD MILLION) 132
      194. TABLE 190 INDIA COMPOUNDING CHEMOTHERAPY MARKET FOR WITH ROBOTIC ARMS, BY TYPE, 2022–2030 (USD MILLION) 132
      195. TABLE 191 INDIA COMPOUNDING CHEMOTHERAPY MARKET, BY COMPOUNDER TYPE, 2022–2030 (USD MILLION) 132
      196. TABLE 192 INDIA COMPOUNDING CHEMOTHERAPY MARKET, BY APPLICATION, 2022–2030 (USD MILLION) 133
      197. TABLE 193 AUSTRALIA COMPOUNDING CHEMOTHERAPY MARKET, BY DOSE, 2022–2030 (USD MILLION) 133
      198. TABLE 194 AUSTRALIA COMPOUNDING CHEMOTHERAPY MARKET, BY COMPOUNDING TYPE, 2022–2030 (USD MILLION) 134
      199. TABLE 195 AUSTRALIA COMPOUNDING CHEMOTHERAPY MARKET, BY DELIVERY METHOD, 2022–2030 (USD MILLION) 134
      200. TABLE 196 AUSTRALIA COMPOUNDING CHEMOTHERAPY MARKET, BY STERILITY, 2022–2030 (USD MILLION) 134
      201. TABLE 197 AUSTRALIA COMPOUNDING CHEMOTHERAPY MARKET, BY TECHNOLOGY, 2022–2030 (USD MILLION) 135
      202. TABLE 198 AUSTRALIA COMPOUNDING CHEMOTHERAPY MARKET FOR WITH ROBOTIC ARMS, BY TYPE, 2022–2030 (USD MILLION) 135
      203. TABLE 199 AUSTRALIA COMPOUNDING CHEMOTHERAPY MARKET, BY COMPOUNDER TYPE, 2022–2030 (USD MILLION) 135
      204. TABLE 200 AUSTRALIA COMPOUNDING CHEMOTHERAPY MARKET, BY APPLICATION, 2022–2030 (USD MILLION) 136
      205. TABLE 201 SOUTH KOREA COMPOUNDING CHEMOTHERAPY MARKET, BY DOSE, 2022–2030 (USD MILLION) 136
      206. TABLE 202 SOUTH KOREA COMPOUNDING CHEMOTHERAPY MARKET, BY COMPOUNDING TYPE, 2022–2030 (USD MILLION) 137
      207. TABLE 203 SOUTH KOREA COMPOUNDING CHEMOTHERAPY MARKET, BY DELIVERY METHOD, 2022–2030 (USD MILLION) 137
      208. TABLE 204 SOUTH KOREA COMPOUNDING CHEMOTHERAPY MARKET, BY STERILITY, 2022–2030 (USD MILLION) 137
      209. TABLE 205 SOUTH KOREA COMPOUNDING CHEMOTHERAPY MARKET, BY TECHNOLOGY, 2022–2030 (USD MILLION) 138
      210. TABLE 206 SOUTH KOREA COMPOUNDING CHEMOTHERAPY MARKET FOR WITH ROBOTIC ARMS, BY TYPE, 2022–2030 (USD MILLION) 138
      211. TABLE 207 SOUTH KOREA COMPOUNDING CHEMOTHERAPY MARKET, BY COMPOUNDER TYPE, 2022–2030 (USD MILLION) 138
      212. TABLE 208 SOUTH KOREA COMPOUNDING CHEMOTHERAPY MARKET, BY APPLICATION, 2022–2030 (USD MILLION) 139
      213. TABLE 209 REST OF ASIA-PACIFIC COMPOUNDING CHEMOTHERAPY MARKET, BY DOSE, 2022–2030 (USD MILLION) 139
      214. TABLE 210 REST OF ASIA-PACIFIC COMPOUNDING CHEMOTHERAPY MARKET, BY COMPOUNDING TYPE, 2022–2030 (USD MILLION) 139
      215. TABLE 211 REST OF ASIA-PACIFIC COMPOUNDING CHEMOTHERAPY MARKET, BY DELIVERY METHOD, 2022–2030 (USD MILLION) 140
      216. TABLE 212 REST OF ASIA-PACIFIC COMPOUNDING CHEMOTHERAPY MARKET, BY STERILITY, 2022–2030 (USD MILLION) 140
      217. TABLE 213 REST OF ASIA-PACIFIC COMPOUNDING CHEMOTHERAPY MARKET, BY TECHNOLOGY, 2022–2030 (USD MILLION) 140
      218. TABLE 214 REST OF ASIA-PACIFIC COMPOUNDING CHEMOTHERAPY MARKET FOR WITH ROBOTIC ARMS, BY TYPE, 2022–2030 (USD MILLION) 141
      219. TABLE 215 REST OF ASIA-PACIFIC COMPOUNDING CHEMOTHERAPY MARKET, BY COMPOUNDER TYPE, 2022–2030 (USD MILLION) 141
      220. TABLE 216 REST OF ASIA-PACIFIC COMPOUNDING CHEMOTHERAPY MARKET, BY APPLICATION, 2022–2030 (USD MILLION) 141
      221. TABLE 217 MIDDLE EAST & AFRICA COMPOUNDING CHEMOTHERAPY MARKET, BY REGION, 2022–2030 (USD MILLION) 142
      222. TABLE 218 MIDDLE EAST & AFRICA COMPOUNDING CHEMOTHERAPY MARKET, BY DOSE, 2022–2030 (USD MILLION) 143
      223. TABLE 219 MIDDLE EAST & AFRICA COMPOUNDING CHEMOTHERAPY MARKET, BY COMPOUNDING TYPE, 2022–2030 (USD MILLION) 143
      224. TABLE 220 MIDDLE EAST & AFRICA COMPOUNDING CHEMOTHERAPY MARKET, BY

    Market Segmentation TabCompounding Chemotherapy Dose Outlook (USD Billion, 2018-2030)

    • Chemotherapeutic
    • Non-Chemotherapeutics

    Compounding Chemotherapy Delivery Method Outlook (USD Billion, 2018-2030)

    • Gravimetric Automated Compounding Device
    • Volumetric Automated Compounding Device

    Compounding Chemotherapy Sterility Outlook (USD Billion, 2018-2030)

    • Sterile
    • Non-Sterile

    Compounding Chemotherapy Technology Outlook (USD Billion, 2018-2030)

    • With Robotic Arms
    • Without Robotic Arms

    Compounding Chemotherapy Regional Outlook (USD Billion, 2018-2030)

    • North America Outlook (USD Billion, 2018-2030)

      • North America Compounding Chemotherapy by Dose
        • Chemotherapeutic
        • Non-Chemotherapeutics
      • North America Compounding Chemotherapy by Delivery Method

        • Gravimetric Automated Compounding Device
        • Volumetric Automated Compounding Device
      • North America Compounding Chemotherapy by Sterility
        • Sterile
        • Non-Sterile
      • North America Compounding Chemotherapy by Technology
        • With Robotic Arms
        • Without Robotic Arms
      • US Outlook (USD Billion, 2018-2030)

      • US Compounding Chemotherapy by Dose
        • Chemotherapeutic
        • Non-Chemotherapeutics
      • US Compounding Chemotherapy by Delivery Method

        • Gravimetric Automated Compounding Device
        • Volumetric Automated Compounding Device
      • US Compounding Chemotherapy by Sterility
        • Sterile
        • Non-Sterile
      • US Compounding Chemotherapy by Technology
        • With Robotic Arms
        • Without Robotic Arms
      • CANADA Outlook (USD Billion, 2018-2030)

      • CANADA Compounding Chemotherapy by Dose
        • Chemotherapeutic
        • Non-Chemotherapeutics
      • CANADA Compounding Chemotherapy by Delivery Method

        • Gravimetric Automated Compounding Device
        • Volumetric Automated Compounding Device
      • CANADA Compounding Chemotherapy by Sterility
        • Sterile
        • Non-Sterile
      • CANADA Compounding Chemotherapy by Technology
        • With Robotic Arms
        • Without Robotic Arms
    • Europe Outlook (USD Billion, 2018-2030)

      • Europe Compounding Chemotherapy by Dose
        • Chemotherapeutic
        • Non-Chemotherapeutics
      • Europe Compounding Chemotherapy by Delivery Method

        • Gravimetric Automated Compounding Device
        • Volumetric Automated Compounding Device
      • Europe Compounding Chemotherapy by Sterility
        • Sterile
        • Non-Sterile
      • Europe Compounding Chemotherapy by Technology
        • With Robotic Arms
        • Without Robotic Arms
      • Germany Outlook (USD Billion, 2018-2030)

      • Germany Compounding Chemotherapy by Dose
        • Chemotherapeutic
        • Non-Chemotherapeutics
      • Germany Compounding Chemotherapy by Delivery Method

        • Gravimetric Automated Compounding Device
        • Volumetric Automated Compounding Device
      • Germany Compounding Chemotherapy by Sterility
        • Sterile
        • Non-Sterile
      • Germany Compounding Chemotherapy by Technology
        • With Robotic Arms
        • Without Robotic Arms
      • France Outlook (USD Billion, 2018-2030)

      • France Compounding Chemotherapy by Dose
        • Chemotherapeutic
        • Non-Chemotherapeutics
      • France Compounding Chemotherapy by Delivery Method

        • Gravimetric Automated Compounding Device
        • Volumetric Automated Compounding Device
      • France Compounding Chemotherapy by Sterility
        • Sterile
        • Non-Sterile
      • France Compounding Chemotherapy by Technology
        • With Robotic Arms
        • Without Robotic Arms
      • UK Outlook (USD Billion, 2018-2030)

      • UK Compounding Chemotherapy by Dose
        • Chemotherapeutic
        • Non-Chemotherapeutics
      • UK Compounding Chemotherapy by Delivery Method

        • Gravimetric Automated Compounding Device
        • Volumetric Automated Compounding Device
      • UK Compounding Chemotherapy by Sterility
        • Sterile
        • Non-Sterile
      • UK Compounding Chemotherapy by Technology
        • With Robotic Arms
        • Without Robotic Arms
      • ITALY Outlook (USD Billion, 2018-2030)

      • ITALY Compounding Chemotherapy by Dose
        • Chemotherapeutic
        • Non-Chemotherapeutics
      • ITALY Compounding Chemotherapy by Delivery Method

        • Gravimetric Automated Compounding Device
        • Volumetric Automated Compounding Device
      • ITALY Compounding Chemotherapy by Sterility
        • Sterile
        • Non-Sterile
      • ITALY Compounding Chemotherapy by Technology
        • With Robotic Arms
        • Without Robotic Arms


      • SPAIN Outlook (USD Billion, 2018-2030)

      • Spain Compounding Chemotherapy by Dose
        • Chemotherapeutic
        • Non-Chemotherapeutics
      • Spain Compounding Chemotherapy by Delivery Method

        • Gravimetric Automated Compounding Device
        • Volumetric Automated Compounding Device
      • Spain Compounding Chemotherapy by Sterility
        • Sterile
        • Non-Sterile
      • Spain Compounding Chemotherapy by Technology
        • With Robotic Arms
        • Without Robotic Arms
      • Rest Of Europe Outlook (USD Billion, 2018-2030)

      • Rest Of Europe Compounding Chemotherapy by Dose
        • Chemotherapeutic
        • Non-Chemotherapeutics
      • REST OF EUROPE Compounding Chemotherapy by Delivery Method

        • Gravimetric Automated Compounding Device
        • Volumetric Automated Compounding Device
      • REST OF EUROPE Compounding Chemotherapy by Sterility
        • Sterile
        • Non-Sterile
      • REST OF EUROPE Compounding Chemotherapy by Technology
        • With Robotic Arms
        • Without Robotic Arms
    • Asia-Pacific Outlook (USD Billion, 2018-2030)

      • Asia-Pacific Compounding Chemotherapy by Dose
        • Chemotherapeutic
        • Non-Chemotherapeutics
      • Asia-Pacific Compounding Chemotherapy by Delivery Method

        • Gravimetric Automated Compounding Device
        • Volumetric Automated Compounding Device
      • Asia-Pacific Compounding Chemotherapy by Sterility
        • Sterile
        • Non-Sterile
      • Asia-Pacific Compounding Chemotherapy by Technology
        • With Robotic Arms
        • Without Robotic Arms
      • China Outlook (USD Billion, 2018-2030)

      • China Compounding Chemotherapy by Dose
        • Chemotherapeutic
        • Non-Chemotherapeutics
      • China Compounding Chemotherapy by Delivery Method

        • Gravimetric Automated Compounding Device
        • Volumetric Automated Compounding Device
      • China Compounding Chemotherapy by Sterility
        • Sterile
        • Non-Sterile
      • China Compounding Chemotherapy by Technology
        • With Robotic Arms
        • Without Robotic Arms
      • Japan Outlook (USD Billion, 2018-2030)

      • Japan Compounding Chemotherapy by Dose
        • Chemotherapeutic
        • Non-Chemotherapeutics
      • Japan Compounding Chemotherapy by Delivery Method

        • Gravimetric Automated Compounding Device
        • Volumetric Automated Compounding Device
      • Japan Compounding Chemotherapy by Sterility
        • Sterile
        • Non-Sterile
      • Japan Compounding Chemotherapy by Technology
        • With Robotic Arms
        • Without Robotic Arms
      • India Outlook (USD Billion, 2018-2030)

      • India Compounding Chemotherapy by Dose
        • Chemotherapeutic
        • Non-Chemotherapeutics
      • India Compounding Chemotherapy by Delivery Method

        • Gravimetric Automated Compounding Device
        • Volumetric Automated Compounding Device
      • India Compounding Chemotherapy by Sterility
        • Sterile
        • Non-Sterile
      • India Compounding Chemotherapy by Technology
        • With Robotic Arms
        • Without Robotic Arms
      • Australia Outlook (USD Billion, 2018-2030)

      • Australia Compounding Chemotherapy by Dose
        • Chemotherapeutic
        • Non-Chemotherapeutics
      • Australia Compounding Chemotherapy by Delivery Method

        • Gravimetric Automated Compounding Device
        • Volumetric Automated Compounding Device
      • Australia Compounding Chemotherapy by Sterility
        • Sterile
        • Non-Sterile
      • Australia Compounding Chemotherapy by Technology
        • With Robotic Arms
        • Without Robotic Arms
      • Rest of Asia-Pacific Outlook (USD Billion, 2018-2030)

      • Rest of Asia-Pacific Compounding Chemotherapy by Dose
        • Chemotherapeutic
        • Non-Chemotherapeutics
      • Rest of Asia-Pacific Compounding Chemotherapy by Delivery Method

        • Gravimetric Automated Compounding Device
        • Volumetric Automated Compounding Device
      • Rest of Asia-Pacific Compounding Chemotherapy by Sterility
        • Sterile
        • Non-Sterile
      • Rest of Asia-Pacific Compounding Chemotherapy by Technology
        • With Robotic Arms
        • Without Robotic Arms
    • Rest of the World Outlook (USD Billion, 2018-2030)

      • Rest of the World Compounding Chemotherapy by Dose
        • Chemotherapeutic
        • Non-Chemotherapeutics
      • Rest of the World Compounding Chemotherapy by Delivery Method

        • Gravimetric Automated Compounding Device
        • Volumetric Automated Compounding Device
      • Rest of the World Compounding Chemotherapy by Sterility
        • Sterile
        • Non-Sterile
      • Rest of the World Compounding Chemotherapy by Technology
        • With Robotic Arms
        • Without Robotic Arms


      • Middle East Outlook (USD Billion, 2018-2030)

      • Middle East Compounding Chemotherapy by Dose
        • Chemotherapeutic
        • Non-Chemotherapeutics
      • Middle East Compounding Chemotherapy by Delivery Method

        • Gravimetric Automated Compounding Device
        • Volumetric Automated Compounding Device
      • Middle East Compounding Chemotherapy by Sterility
        • Sterile
        • Non-Sterile
      • Middle East Compounding Chemotherapy by Technology
        • With Robotic Arms
        • Without Robotic Arms
      • Africa Outlook (USD Billion, 2018-2030)

      • Africa Compounding Chemotherapy by Dose
        • Chemotherapeutic
        • Non-Chemotherapeutics
      • Africa Compounding Chemotherapy by Delivery Method

        • Gravimetric Automated Compounding Device
        • Volumetric Automated Compounding Device
      • Africa Compounding Chemotherapy by Sterility
        • Sterile
        • Non-Sterile
      • Africa Compounding Chemotherapy by Technology
        • With Robotic Arms
        • Without Robotic Arms
      • Latin America Outlook (USD Billion, 2018-2030)

      • Latin America Compounding Chemotherapy by Dose
        • Chemotherapeutic
        • Non-Chemotherapeutics
      • Latin America Compounding Chemotherapy by Delivery Method

        • Gravimetric Automated Compounding Device
        • Volumetric Automated Compounding Device
      • Latin America Compounding Chemotherapy by Sterility
        • Sterile
        • Non-Sterile
      • Latin America Compounding Chemotherapy by Technology
        • With Robotic Arms
        • Without Robotic Arms
    Infographic

    Free Sample Request

    Kindly complete the form below to receive a free sample of this Report

    Get Free Sample

    Customer Strories

    “I am very pleased with how market segments have been defined in a relevant way for my purposes (such as "Portable Freezers & refrigerators" and "last-mile"). In general the report is well structured. Thanks very much for your efforts.”

    Victoria Milne

    Founder
    Case Study
    Chemicals and Materials