• Cat-intel
  • MedIntelliX
  • Resources
  • About Us
  • Hero Background
    English
    Chinese
    French
    Japanese
    Korean
    German
    Spanish

    Compounding Chemotherapy Market Share

    ID: MRFR/Pharma/8901-CR
    193 Pages
    Rahul Gotadki
    December 2020

    Compounding Chemotherapy Market Research Report Information By Dose (Chemotherapeutic and Non-Chemotherapeutics), By Delivery Method (Gravimetric Automated Compounding Device and Volumetric Automated Compounding Device), By Sterility (Sterile and Non-Sterile), By Technology (With Robotic Arms and Without Robotic Arms), and By Region (North America, Europe, Asia-Pacific, And Rest Of The World) –...

    Share:
    Download PDF ×

    We do not share your information with anyone. However, we may send you emails based on your report interest from time to time. You may contact us at any time to opt-out.

    Compounding Chemotherapy Market Infographic
    $ 4,950.0
    $ 5,950.0
    $ 7,250.0

    Market Share

    Compounding Chemotherapy Market Share Analysis

    Understanding the Compounding Chemotherapy Market: Demand Drivers and Share Dynamics The compounding chemotherapy market, a vital segment within the broader oncology landscape, caters to the specific needs of patients requiring personalized medication solutions. This article explores the key drivers of demand and delves into the market share dynamics, offering valuable insights for stakeholders across the industry.

    Demand Drivers:

    Personalization: Compounding allows for customizing chemotherapy doses and formulations, catering to individual patient needs and addressing specific drug sensitivities or allergies. This personalized approach optimizes treatment efficacy and minimizes side effects. Dosage Flexibility: Compounding offers flexibility in dosage formats, such as oral suspensions, topical creams, or suppositories, making it suitable for patients who have difficulty swallowing pills or have specific administration needs. Drug Shortages: In cases of drug shortages, compounding plays a crucial role in ensuring uninterrupted patient care by providing alternative formulations or custom-compounded medications. Emerging Therapies: The development of new and innovative cancer therapies often requires specialized compounding techniques to prepare these medications for safe and effective administration. Regulatory Landscape: Regulatory changes within the pharmaceutical industry are driving demand for compounding, as some manufacturers may discontinue certain medications or change formulations, making compounded alternatives essential. Market Share Dynamics:

    Regional Landscape: North America dominates the global compounding chemotherapy market, primarily driven by its well-established healthcare infrastructure, high cancer rates, and increasing adoption of personalized medicine approaches. End-Use Segment: Hospitals and clinics hold the largest share of the market due to their high volume of patients requiring chemotherapy treatment. However, demand from home care settings and long-term care facilities is expected to grow due to aging populations and the rising preference for home-based healthcare. Competitive Landscape: The market is characterized by a mix of large pharmaceutical companies, specialized compounding pharmacies, and independent pharmacies offering compounding services. Each segment plays a distinct role in meeting the diverse needs of patients and healthcare providers. Challenges and Opportunities:

    Regulatory Compliance: Compounding pharmacies face stringent regulations and ongoing scrutiny from regulatory bodies. Ensuring compliance with evolving regulations is crucial for maintaining market access and patient safety. Cost and Reimbursement: Compounded medications are often more expensive than commercially available options. Obtaining adequate insurance coverage and navigating complex reimbursement processes can be challenging for both patients and healthcare providers. Quality Control: Maintaining consistent and high-quality standards in compounding is critical to ensure patient safety and medication effectiveness. Implementing robust quality control measures and continuous improvement initiatives is essential. Future Outlook:

    The compounding chemotherapy market is expected to witness substantial growth in the coming years, driven by factors such as:

    Rising Cancer Rates: The increasing global incidence of cancer will fuel the demand for personalized and effective treatment options, including compounded chemotherapy. Technological Advancements: Advancements in compounding technology and automation are expected to improve efficiency, reduce costs, and enhance the quality of compounded medications. Growing Awareness: Increased awareness among healthcare professionals and patients about the benefits of personalized medicine and compounding is expected to further drive market demand.

    Market Summary

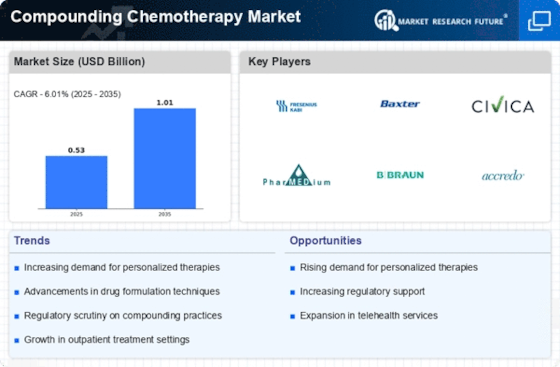
    As per MRFR analysis, the Compounding Chemotherapy Market Size was estimated at 0.53 USD Billion in 2024. The Compounding Chemotherapy industry is projected to grow from 0.5619 in 2025 to 1.007 by 2035, exhibiting a compound annual growth rate (CAGR) of 6.01 during the forecast period 2025 - 2035.

    Key Market Trends & Highlights

    The Compounding Chemotherapy Market is experiencing a dynamic shift towards personalized treatment solutions and technological advancements.

    • North America remains the largest market for compounding chemotherapy, driven by a robust healthcare infrastructure and regulatory support. The Asia-Pacific region is emerging as the fastest-growing market, fueled by increasing healthcare investments and rising cancer incidence. The chemotherapeutic segment continues to dominate the market, while the non-chemotherapeutic segment is witnessing rapid growth due to evolving treatment paradigms. Key market drivers include the rising incidence of cancer and the growing demand for personalized medicine, which are shaping the future of compounding chemotherapy.

    Market Size & Forecast

    2024 Market Size 0.53 (USD Billion)
    2035 Market Size 1.007 (USD Billion)
    CAGR (2025 - 2035) 6.01%
    Largest Regional Market Share in 2024 North America

    Major Players

    <p>Fresenius Kabi (DE), Baxter International (US), Civica Rx (US), PharMEDium Services (US), B. Braun Melsungen AG (DE), Accredo Health Group (US), Scripps Health (US), Medisca (US)</p>

    Market Trends

    The Compounding Chemotherapy Market is currently experiencing a notable evolution, driven by various factors that influence its dynamics. The increasing prevalence of cancer globally has led to a heightened demand for personalized treatment options, which compounding pharmacies are well-positioned to provide. These specialized pharmacies create tailored medications that meet the unique needs of individual patients, thereby enhancing therapeutic outcomes. Furthermore, advancements in technology and regulatory frameworks are facilitating the growth of this market, as they enable more efficient and safer compounding practices. As healthcare providers seek innovative solutions to improve patient care, the role of compounding in chemotherapy appears to be expanding. In addition, the Compounding Chemotherapy Market is witnessing a shift towards more stringent quality control measures and compliance with regulatory standards. This trend is indicative of a broader commitment to patient safety and efficacy in treatment protocols. Stakeholders in the market are increasingly focusing on ensuring that compounded medications meet the highest standards of quality, which may enhance trust among healthcare professionals and patients alike. Overall, the landscape of the Compounding Chemotherapy Market is evolving, with a clear emphasis on personalized medicine, quality assurance, and technological advancements that could shape its future trajectory.

    Personalized Treatment Solutions

    The Compounding Chemotherapy Market is increasingly oriented towards personalized treatment solutions. This trend reflects a growing recognition of the need for individualized therapies that cater to the specific requirements of patients. Compounding pharmacies are adept at formulating medications that align with the unique characteristics of each patient, thereby potentially improving treatment efficacy and minimizing adverse effects.

    Regulatory Compliance and Quality Assurance

    There is a marked emphasis on regulatory compliance and quality assurance within the Compounding Chemotherapy Market. Stakeholders are prioritizing adherence to stringent guidelines to ensure the safety and effectiveness of compounded medications. This focus on quality not only enhances patient trust but also aligns with broader healthcare objectives aimed at improving treatment outcomes.

    Technological Advancements in Compounding

    Technological advancements are playing a pivotal role in the evolution of the Compounding Chemotherapy Market. Innovations in compounding techniques and equipment are enabling pharmacies to produce high-quality medications more efficiently. These advancements may lead to improved accuracy in formulations and a reduction in the potential for errors, thereby enhancing overall patient care.

    <p>The Global Compounding Chemotherapy Market is poised for growth as healthcare systems increasingly recognize the necessity of personalized treatment regimens tailored to individual patient needs.</p>

    U.S. Food and Drug Administration (FDA)

    Compounding Chemotherapy Market Market Drivers

    Rising Incidence of Cancer

    The increasing prevalence of cancer worldwide is a primary driver for the Compounding Chemotherapy Market. According to recent statistics, cancer cases are projected to rise significantly, with estimates suggesting that by 2030, there could be over 21 million new cancer cases annually. This surge necessitates tailored chemotherapy solutions, which compounding pharmacies are well-positioned to provide. As healthcare systems strive to meet the growing demand for personalized treatment regimens, the compounding chemotherapy sector is likely to experience substantial growth. The ability to customize dosages and formulations to suit individual patient needs enhances treatment efficacy, thereby driving market expansion. Furthermore, the rising awareness of cancer treatment options among patients and healthcare providers contributes to the increasing reliance on compounded chemotherapy solutions.

    Advancements in Compounding Technology

    Technological innovations in compounding practices are significantly influencing the Compounding Chemotherapy Market. The integration of advanced compounding equipment and software has streamlined the preparation of chemotherapy agents, ensuring higher precision and safety. For instance, the adoption of automated compounding devices has reduced human error and improved the consistency of drug formulations. Additionally, the implementation of stringent quality control measures has enhanced the reliability of compounded medications. As a result, healthcare providers are increasingly turning to compounding pharmacies for their chemotherapy needs, recognizing the benefits of customized solutions. The market is expected to grow as these technological advancements continue to evolve, potentially leading to more efficient and effective treatment options for cancer patients.

    Increased Focus on Patient-Centric Care

    The healthcare industry's growing emphasis on patient-centric care is driving the Compounding Chemotherapy Market. This approach prioritizes the individual needs and preferences of patients, leading to a greater demand for customized treatment options. Compounding pharmacies are uniquely equipped to meet this demand by providing tailored chemotherapy solutions that consider factors such as dosage, formulation, and administration routes. As healthcare systems increasingly adopt patient-centered models, the role of compounding pharmacies becomes more critical. Market data suggests that patient satisfaction rates improve when treatments are personalized, further encouraging healthcare providers to collaborate with compounding pharmacies. This focus on patient-centric care is likely to propel the growth of the compounding chemotherapy market, as more patients seek individualized treatment plans.

    Growing Demand for Personalized Medicine

    The shift towards personalized medicine is a significant driver of the Compounding Chemotherapy Market. Patients increasingly seek treatment options that are tailored to their unique genetic profiles and specific cancer types. Compounding pharmacies play a pivotal role in this trend by offering customized chemotherapy formulations that align with individual patient needs. This demand for personalized treatment is reflected in market data, indicating a steady increase in the number of prescriptions for compounded chemotherapy agents. As healthcare providers recognize the benefits of personalized approaches, the reliance on compounding pharmacies is expected to grow. This trend not only enhances patient outcomes but also positions the compounding chemotherapy sector for sustained growth in the coming years.

    Regulatory Support for Compounding Pharmacies

    Regulatory frameworks that support the operations of compounding pharmacies are crucial for the growth of the Compounding Chemotherapy Market. Recent initiatives by health authorities have aimed to enhance the safety and efficacy of compounded medications. For example, the establishment of guidelines for sterile compounding has led to improved practices within the industry. These regulations not only ensure patient safety but also bolster the credibility of compounding pharmacies. As regulatory bodies continue to recognize the importance of personalized medicine, compounding pharmacies are likely to benefit from increased trust and demand. This supportive regulatory environment may facilitate market expansion, as more healthcare providers seek to collaborate with compounding pharmacies for tailored chemotherapy solutions.

    Market Segment Insights

    By Dose: Chemotherapeutic (Largest) vs. Non-Chemotherapeutics (Fastest-Growing)

    <p>In the Compounding Chemotherapy Market, the 'Dose' segment is notably dominated by Chemotherapeutic agents, which hold significant market share due to their widespread use in cancer treatment. Non-Chemotherapeutics, while currently a smaller portion of the market, are rapidly gaining traction among healthcare providers, reflecting a growing acceptance of alternative therapies. This distribution illustrates a dynamic landscape, where innovations in both segments influence purchasing trends.</p>

    <p>Chemotherapeutic (Dominant) vs. Non-Chemotherapeutics (Emerging)</p>

    <p>The Chemotherapeutic segment remains the dominant player in the Compounding Chemotherapy Market, characterized by a well-established presence in clinical settings and a robust pipeline of formulations tailored for various cancer types. These agents are integral to traditional chemotherapy protocols, ensuring continued demand as healthcare providers rely on their efficacy. Conversely, Non-Chemotherapeutics represent an emerging market segment, driven by advances in supportive care measures and increased focus on patient quality of life. This segment, including biologics and immunotherapies, is witnessing rapid growth as more innovative therapies receive approval, reflecting evolving treatment paradigms.</p>

    By Delivery Method: Gravimetric Automated Compounding Device (Largest) vs. Volumetric Automated Compounding Device (Fastest-Growing)

    <p>In the Compounding Chemotherapy Market, the Gravimetric Automated Compounding Device holds the largest market share, driven by its accuracy and reliable performance in preparing chemotherapy dosages. This device is favored for its precision in measuring medication, making it essential in hospital pharmacy settings. Meanwhile, the Volumetric Automated Compounding Device, while smaller in market share, is recognized as the fastest-growing segment. Its adaptability and ease of use allow for a quicker compounding process, attracting a growing number of healthcare facilities looking to enhance efficiency.</p>

    <p>Delivery Method: Gravimetric Automated Compounding Device (Dominant) vs. Volumetric Automated Compounding Device (Emerging)</p>

    <p>The Gravimetric Automated Compounding Device stands out as the dominant solution in the compounding chemotherapy market due to its high precision and consistency in medication preparation. Healthcare institutions depend on its ability to minimize human error during the compounding process, ensuring patient safety. Conversely, the Volumetric Automated Compounding Device represents an emerging trend, appealing for its versatility and speed. This device caters to a growing demand for rapid compounding solutions, particularly in outpatient settings where time efficiency is critical. While gravimetric devices maintain a lead in established markets, volumetric devices are becoming increasingly popular among newer, innovative compounding pharmacies.</p>

    By Sterility: Sterile (Largest) vs. Non-Sterile (Fastest-Growing)

    <p>In the Compounding Chemotherapy Market, the 'Sterile' segment holds a significant share, as it is essential for preventing contamination during the preparation of chemotherapy drugs. This segment's dominance is attributed to stringent regulations and the need for high safety standards in the administration of cancer treatments. In contrast, the 'Non-Sterile' segment, while smaller in market share, is experiencing rapid growth driven by increasing demand for cost-effective compounding solutions and greater acceptance for certain applications. This indicates a shift in market dynamics as healthcare providers seek more flexible options in chemotherapy preparations.</p>

    <p>Sterile (Dominant) vs. Non-Sterile (Emerging)</p>

    <p>The 'Sterile' segment is characterized by rigorous processes that ensure the elimination of all microorganisms, making it indispensable in the preparation of chemotherapy drugs. This segment is essential for ensuring patient safety and is supported by stringent regulatory requirements. On the other hand, the 'Non-Sterile' segment is emerging as a viable alternative, particularly in certain clinical applications where sterilization is less critical or in formulations that do not require injection. This emerging segment is appealing to compounding pharmacies looking to optimize costs and meet diverse patient needs, reflecting a broader trend towards personalized medicine in oncology.</p>

    By Technology: Without Robotic Arms (Largest) vs. With Robotic Arms (Fastest-Growing)

    <p>In the Compounding Chemotherapy Market, the segment 'Without Robotic Arms' holds the largest share due to its established presence and widespread adoption among healthcare providers. This segment continues to be preferred for its simplicity, lower cost, and ease of use, which aligns with traditional compounding methods. On the other hand, 'With Robotic Arms' is quickly gaining traction, driven by advancements in technology that offer enhanced precision and efficiency in chemotherapy compounding processes.</p>

    <p>Technology: Without Robotic Arms (Dominant) vs. With Robotic Arms (Emerging)</p>

    <p>The 'Without Robotic Arms' segment remains the dominant choice in the Compounding Chemotherapy Market due to its reliability and ease of integration into existing workflows. Healthcare facilities favor manual compounding techniques for their simplicity and lower operational costs. Conversely, the 'With Robotic Arms' segment is emerging as a significant player, appealing to institutions seeking to improve safety and reduce the risk of contamination. Robotic arms provide accuracy in dosing and streamline operations, making them attractive in modern settings focused on enhanced patient outcomes and operational efficiency.</p>

    Get more detailed insights about Compounding Chemotherapy Market Research Report - Forecast till 2032

    Regional Insights

    North America : Market Leader in Innovation

    North America is the largest market for compounding chemotherapy, holding approximately 45% of the global share. The region benefits from advanced healthcare infrastructure, high demand for personalized medicine, and stringent regulatory frameworks that ensure safety and efficacy. The increasing prevalence of cancer and the growing number of outpatient facilities are significant growth drivers, alongside supportive government initiatives aimed at enhancing drug accessibility. The United States is the primary contributor, with key players like Fresenius Kabi, Baxter International, and Civica Rx leading the market. The competitive landscape is characterized by innovation and strategic partnerships among these companies, which are focused on improving compounding practices and expanding their service offerings. The presence of robust healthcare systems and a high level of investment in R&D further solidifies North America's position in the compounding chemotherapy market.

    Europe : Emerging Regulatory Frameworks

    Europe is witnessing significant growth in the compounding chemotherapy market, accounting for approximately 30% of the global share. The region's growth is driven by increasing cancer incidences, a rising geriatric population, and evolving regulatory frameworks that promote the safe compounding of chemotherapy drugs. Countries like Germany and France are at the forefront, with stringent regulations ensuring high-quality standards in drug preparation and distribution. Germany leads the market, supported by key players such as B. Braun Melsungen AG and Fresenius Kabi. The competitive landscape is marked by a focus on compliance with EU regulations and the development of innovative compounding solutions. The presence of well-established healthcare systems and a collaborative approach among stakeholders further enhance the market's growth potential. The European Medicines Agency emphasizes the importance of quality in compounded medications, stating that "Quality assurance is paramount in the preparation of sterile medicinal products."

    Asia-Pacific : Rapidly Growing Market Potential

    Asia-Pacific is rapidly emerging as a significant player in the compounding chemotherapy market, holding around 20% of the global share. The region's growth is fueled by increasing healthcare expenditure, rising cancer rates, and a growing awareness of personalized medicine. Countries like China and India are leading this growth, supported by government initiatives aimed at improving healthcare access and affordability for cancer treatments. China is the largest market in the region, with a competitive landscape that includes both local and international players. Companies are increasingly investing in advanced compounding technologies to meet the rising demand for customized chemotherapy solutions. The presence of a large patient population and a shift towards outpatient care models further drive the market's expansion. The Asia-Pacific region is poised for substantial growth as healthcare systems evolve and adapt to meet the needs of cancer patients.

    Middle East and Africa : Untapped Market Opportunities

    The Middle East and Africa region is gradually developing its compounding chemotherapy market, currently holding about 5% of the global share. The growth is primarily driven by increasing investments in healthcare infrastructure, rising cancer prevalence, and a growing focus on improving drug accessibility. Countries like South Africa and the UAE are making strides in enhancing their healthcare systems, which is expected to boost the demand for compounded chemotherapy solutions. South Africa is leading the market in this region, with a competitive landscape that includes both local and international players. The presence of key players like Accredo Health Group and Medisca is notable, as they work to establish a foothold in this emerging market. The region's potential is significant, with ongoing government initiatives aimed at improving healthcare delivery and patient outcomes. The World Health Organization emphasizes the need for equitable access to essential medicines, stating that "Access to quality medicines is a fundamental right for all individuals."

    Key Players and Competitive Insights

    The Compounding Chemotherapy Market is characterized by a dynamic competitive landscape, driven by increasing demand for personalized medicine and the need for efficient drug delivery systems. Key players such as Fresenius Kabi (DE), Baxter International (US), and Civica Rx (US) are strategically positioned to leverage their operational strengths. Fresenius Kabi (DE) focuses on innovation in drug formulation and delivery, while Baxter International (US) emphasizes partnerships with healthcare providers to enhance service delivery. Civica Rx (US), on the other hand, aims to address drug shortages through its non-profit model, which underscores a commitment to accessibility and affordability. Collectively, these strategies contribute to a competitive environment that is increasingly focused on patient-centric solutions and operational efficiency.

    In terms of business tactics, companies are localizing manufacturing to reduce lead times and enhance supply chain resilience. The market appears moderately fragmented, with several players vying for market share, yet the influence of major companies is palpable. Their collective efforts in optimizing supply chains and enhancing product offerings are likely to shape the market structure, fostering a competitive atmosphere that encourages innovation and responsiveness to market needs.

    In August 2025, Baxter International (US) announced a strategic partnership with a leading telehealth provider to integrate digital health solutions into its compounding services. This move is significant as it not only enhances patient engagement but also streamlines the prescription process, potentially improving treatment adherence. By embracing digital transformation, Baxter is positioning itself as a forward-thinking leader in the compounding chemotherapy space.

    In September 2025, Fresenius Kabi (DE) launched a new line of compounded chemotherapy drugs specifically designed for pediatric patients. This initiative reflects a growing recognition of the unique needs of younger patients and underscores the company's commitment to innovation in drug formulation. By targeting this niche market, Fresenius Kabi is likely to enhance its competitive edge and expand its market presence.

    In October 2025, Civica Rx (US) expanded its operations by establishing a new compounding facility in the Midwest, aimed at increasing its production capacity for essential chemotherapy drugs. This expansion is crucial as it not only addresses the ongoing drug shortages but also reinforces Civica's mission to provide affordable medications. The strategic location of the facility may also enhance distribution efficiency across the region.

    As of October 2025, the competitive trends in the Compounding Chemotherapy Market are increasingly defined by digitalization, sustainability, and the integration of artificial intelligence in drug development processes. Strategic alliances are becoming more prevalent, as companies recognize the value of collaboration in enhancing their service offerings. Looking ahead, competitive differentiation is likely to evolve from traditional price-based competition to a focus on innovation, technological advancements, and the reliability of supply chains. This shift may ultimately redefine how companies position themselves in the market, emphasizing the importance of adaptability and forward-thinking strategies.

    Key Companies in the Compounding Chemotherapy Market market include

    Industry Developments

    March 2021:The establishment of Revelation Pharma Corp. has been announced by Osceola Capital and seasoned businessman Jacob Beckel to investigate funding and cooperative arrangements in the pharmaceutical compounding sector.

    April 2019:The list of 43 authorized states maintained by Pentec Health, Inc. now includes California. The business provides advanced in-home clinical services, along with patient-specific compounded sterile medications.

    May 2019:A contract was reached by Fagron to acquire Central de Drogas, S.A. de C.V., a supplier of raw materials to Mexico's pharmaceutical sector and compounding pharmacies.

    Future Outlook

    Compounding Chemotherapy Market Future Outlook

    <p>The Compounding Chemotherapy Market is projected to grow at a 6.01% CAGR from 2024 to 2035, driven by increasing cancer prevalence, technological advancements, and personalized medicine trends.</p>

    New opportunities lie in:

    • <p>Expansion of telepharmacy services for remote patient access.</p><p>Development of automated compounding systems to enhance efficiency.</p><p>Partnerships with oncology clinics for tailored chemotherapy solutions.</p>

    <p>By 2035, the Compounding Chemotherapy Market is expected to be robust, reflecting substantial growth and innovation.</p>

    Market Segmentation

    Compounding Chemotherapy Market Dose Outlook

    • Chemotherapeutic
    • Non-Chemotherapeutics

    Compounding Chemotherapy Market Sterility Outlook

    • Sterile
    • Non-Sterile

    Compounding Chemotherapy Market Technology Outlook

    • With Robotic Arms
    • Without Robotic Arms

    Compounding Chemotherapy Market Delivery Method Outlook

    • Gravimetric Automated Compounding Device
    • Volumetric Automated Compounding Device

    Report Scope

    MARKET SIZE 20240.53(USD Billion)
    MARKET SIZE 20250.5619(USD Billion)
    MARKET SIZE 20351.007(USD Billion)
    COMPOUND ANNUAL GROWTH RATE (CAGR)6.01% (2024 - 2035)
    REPORT COVERAGERevenue Forecast, Competitive Landscape, Growth Factors, and Trends
    BASE YEAR2024
    Market Forecast Period2025 - 2035
    Historical Data2019 - 2024
    Market Forecast UnitsUSD Billion
    Key Companies ProfiledMarket analysis in progress
    Segments CoveredMarket segmentation analysis in progress
    Key Market OpportunitiesIntegration of personalized medicine and advanced compounding techniques in the Compounding Chemotherapy Market.
    Key Market DynamicsRising demand for personalized medicine drives innovation and regulatory scrutiny in the compounding chemotherapy market.
    Countries CoveredNorth America, Europe, APAC, South America, MEA

    Market Highlights

    Author

    Rahul Gotadki
    Assistant Manager

    She holds an experience of about 6+ years in market research and business consulting, working under the spectrum of information communication technology, telecommunications and semiconductor domains. aarti conceptualizes and implements a scalable business strategy and provides strategic leadership to the clients. her expertise lies in market estimation, competitive intelligence, pipeline analysis, customer assessment, etc.

    Leave a Comment

    Latest Comments

    John Doe
    john@example.com

    This is a great article! Really helped me understand the topic better.

    Posted on July 23, 2025, 10:15 AM
    Jane Smith
    jane@domain.com

    Thanks for sharing this. I’ve bookmarked it for later reference.

    Posted on July 22, 2025, 7:45 PM

    FAQs

    1. EXECUTIVE SUMMARY
    2. MARKET INTRODUCTION
      1. DEFINITION 21
      2. SCOPE OF THE STUDY 21
      3. RESEARCH OBJECTIVE 21
      4. MARKET STRUCTURE 22
      5. ASSUMPTIONS & LIMITATIONS 23
    3. RESEARCH METHODOLOGY
      1. DATA MINING 24
      2. SECONDARY RESEARCH 25
      3. PRIMARY RESEARCH 26
      4. BREAKDOWN OF PRIMARY RESPONDENTS 27
      5. FORECASTING TECHNIQUES 28
      6. RESEARCH METHODOLOGY FOR MARKET SIZE ESTIMATION 29
        1. BOTTOM-UP APPROACH 30
        2. TOP-DOWN APPROACH 30
      7. DATA TRIANGULATION 31
      8. VALIDATION 31
    4. MARKET DYNAMICS
      1. OVERVIEW 32
      2. DRIVERS 33
        1. TECHNOLOGICAL DEVELOPMENTS AND GROUND-BREAKING TECHNIQUES 33
        2. INCREASE IN DRUGS SHORTAGE COMPRISING CANCER MEDICINES 34
        3. RISE IN AWARENESS AND ADAPTATION OF NEW TECHNOLOGIES AMONG CANCER HOSPITALS 34
        4. RISING PREVALENCE OF CANCER PATIENTS 34
      3. RESTRAINTS 36
        1. DEARTH OF PRACTICED PHARMACISTS AND LAB TECHNICIANS 36
      4. OPPORTUNITIES 36
        1. NEW PRODUCT INNOVATIONS 36
        2. RISE IN PARTNERSHIPS & COLLABORATIONS 36
    5. MARKET FACTOR ANALYSIS
      1. VALUE CHAIN ANALYSIS 37
        1. R&D AND DESIGNING 37
        2. MANUFACTURING 38
        3. DISTRIBUTION & SALES 38
        4. POST SALES SERVICES 38
      2. PORTER’S FIVE FORCES MODEL 38
        1. BARGAINING POWER OF SUPPLIERS 39
        2. BARGAINING POWER OF BUYERS 39
        3. THREAT OF NEW ENTRANTS 39
        4. THREAT OF SUBSTITUTES 40
        5. INTENSITY OF RIVALRY 40
      3. COVID-19 IMPACT ANALYSIS 40
        1. IMPACT ON SUPPLY CHAIN 41
        2. IMPACT ON PRODUCTION 41
        3. IMPACT ON REGIONS 41
        4. DEMAND-SUPPLY GAP ANALYSIS 41
      4. LIST OF POTENTIAL CUSTOMERS 42
    6. GLOBAL COMPOUNDING CHEMOTHERAPY MARKET, BY DOSE
      1. OVERVIEW 45
      2. CHEMOTHERAPEUTIC 46
      3. NON-CHEMOTHERAPEUTICS 46
    7. GLOBAL COMPOUNDING CHEMOTHERAPY MARKET, BY COMPOUNDING TYPE
      1. OVERVIEW 47
      2. PHARMACEUTICAL INGREDIENT ALTERATION (PIA) 48
      3. CURRENTLY UNAVAILABLE PHARMACEUTICAL MANUFACTURING (CUPM) 49
      4. PHARMACEUTICAL DOSAGE ALTERATION (PDA) 50
    8. GLOBAL COMPOUNDING CHEMOTHERAPY MARKET, BY DELIVERY METHOD
      1. OVERVIEW 51
      2. GRAVIMETRIC AUTOMATED COMPOUNDING DEVICE (WEIGHT-BASED) 52
      3. VOLUMETRIC AUTOMATED COMPOUNDING DEVICE (VOLUME-BASED) 53
    9. GLOBAL COMPOUNDING CHEMOTHERAPY MARKET, BY STERILITY
      1. OVERVIEW 54
      2. STERILE 55
      3. NON-STERILE 56
    10. GLOBAL COMPOUNDING CHEMOTHERAPY MARKET, BY TECHNOLOGY
      1. OVERVIEW 57
      2. WITH ROBOTIC ARMS 58
      3. WITHOUT ROBOTIC ARMS 59
    11. GLOBAL COMPOUNDING CHEMOTHERAPY MARKET, BY COMPOUNDER TYPE
      1. OVERVIEW 60
      2. PHARMODUCT 61
      3. EQUASHIELD PRO 61
      4. MEDIMIX 61
      5. INTEGRA 61
      6. OTHERS 61
    12. GLOBAL COMPOUNDING CHEMOTHERAPY MARKET, BY APPLICATION
      1. OVERVIEW 62
      2. BREAST CANCER 63
      3. BLOOD CANCER 64
      4. PROSTATE CANCER 65
      5. GASTROINTESTINAL CANCER 66
      6. RESPIRATORY/LUNG CANCER 66
      7. OTHERS 67
    13. GLOBAL COMPOUNDING CHEMOTHERAPY MARKET, BY REGION
      1. OVERVIEW 68
      2. AMERICAS 69
        1. NORTH AMERICA 73
        2. LATIN AMERICA 82
      3. EUROPE 92
        1. WESTERN EUROPE 96
        2. EASTERN EUROPE 117
      4. ASIA-PACIFIC 121
        1. CHINA 125
        2. JAPAN 127
        3. INDIA 130
        4. AUSTRALIA 133
        5. SOUTH KOREA 136
        6. REST OF ASIA-PACIFIC 139
      5. MIDDLE EAST & AFRICA 142
        1. MIDDLE EAST 145
        2. AFRICA 148
    14. COMPETITIVE LANDSCAPE
      1. OVERVIEW 151
      2. COMPETITOR DASHBOARD 152
      3. MAJOR GROWTH STRATEGY IN THE GLOBAL COMPOUNDING CHEMOTHERAPY MARKET 153
      4. MARKET SHARE ANALYSIS 153
      5. COMPETITIVE BENCHMARKING 154
      6. THE LEADING PLAYERS IN TERMS OF NUMBER OF DEVELOPMENTS IN THE GLOBAL COMPOUNDING CHEMOTHERAPY MARKET 155
      7. KEY DEVELOPMENTS & GROWTH STRATEGIES 156
      8. KEY DEVELOPMENTS & GROWTH STRATEGIES 156
        1. ACQUISITION 156
        2. COLLABORATION 156
        3. PARTNERSHIP 157
        4. COLLABORATION 157
    15. COMPANY PROFILE
      1. B. BRAUN MELSUNGEN AG 158
        1. COMPANY OVERVIEW 158
        2. FINANCIAL OVERVIEW 158
        3. PRODUCTS/SERVICES OFFERED 159
        4. KEY DEVELOPMENTS 159
        5. SWOT ANALYSIS 160
        6. KEY STRATEGIES 160
      2. PFIZER INC. 161
        1. COMPANY OVERVIEW 161
        2. FINANCIAL OVERVIEW 161
        3. PRODUCTS/SERVICES OFFERED 162
        4. KEY DEVELOPMENTS 162
        5. SWOT ANALYSIS 162
        6. KEY STRATEGIES 163
      3. BAXTER 164
        1. COMPANY OVERVIEW 164
        2. FINANCIAL OVERVIEW 164
        3. PRODUCTS/SERVICES OFFERED 165
        4. KEY DEVELOPMENTS 165
        5. SWOT ANALYSIS 165
        6. KEY STRATEGIES 166
      4. GRIFOLS, S.A. 167
        1. COMPANY OVERVIEW 167
        2. FINANCIAL OVERVIEW 167
        3. PRODUCTS/SERVICES OFFERED 168
        4. KEY DEVELOPMENTS 168
        5. SWOT ANALYSIS 168
        6. KEY STRATEGIES 169
      5. THE METRIX COMPANY 170
        1. COMPANY OVERVIEW 170
        2. FINANCIAL OVERVIEW 170
        3. PRODUCTS/SERVICES OFFERED 170
        4. KEY DEVELOPMENTS 170
        5. SWOT ANALYSIS 171
        6. KEY STRATEGIES 171
      6. ADDED PHARMA 172
        1. COMPANY OVERVIEW 172
        2. FINANCIAL OVERVIEW 172
        3. PRODUCTS/SERVICES OFFERED 172
        4. KEY DEVELOPMENTS 173
        5. SWOT ANALYSIS 173
        6. KEY STRATEGIES 173
      7. EQUASHIELD 174
        1. COMPANY OVERVIEW 174
        2. FINANCIAL OVERVIEW 174
        3. PRODUCTS/SERVICES OFFERED 174
        4. KEY DEVELOPMENTS 174
        5. SWOT ANALYSIS 175
        6. KEY STRATEGIES 175
      8. MILLERS PHARMACY 176
        1. COMPANY OVERVIEW 176
        2. FINANCIAL OVERVIEW 176
        3. PRODUCTS/SERVICES OFFERED 176
        4. KEY DEVELOPMENTS 176
        5. SWOT ANALYSIS 177
        6. KEY STRATEGIES 177
      9. COMECER S.P.A. 178
        1. COMPANY OVERVIEW 178
        2. FINANCIAL OVERVIEW 178
        3. PRODUCTS/SERVICES OFFERED 178
        4. SWOT ANALYSIS 179
        5. KEY STRATEGIES 179
      10. OMNICELL 180
        1. COMPANY OVERVIEW 180
        2. FINANCIAL OVERVIEW 180
        3. PRODUCTS/SERVICES OFFERED 180
        4. SWOT ANALYSIS 181
        5. KEY STRATEGIES 181
      11. ICON GROUP 182
        1. COMPANY OVERVIEW 182
        2. FINANCIAL OVERVIEW 182
        3. PRODUCTS/SERVICES OFFERED 182
        4. KEY DEVELOPMENTS 183
        5. SWOT ANALYSIS 184
        6. KEY STRATEGIES 184
      12. DEDALUS GROUP 185
        1. COMPANY OVERVIEW 185
        2. FINANCIAL OVERVIEW 185
        3. PRODUCTS/SERVICES OFFERED 185
        4. KEY DEVELOPMENTS 185
        5. SWOT ANALYSIS 186
        6. KEY STRATEGIES 186
      13. ARXIUM 187
        1. COMPANY OVERVIEW 187
        2. FINANCIAL OVERVIEW 187
        3. PRODUCTS/SERVICES OFFERED 187
        4. KEY DEVELOPMENTS 187
        5. SWOT ANALYSIS 188
        6. KEY STRATEGIES 188
      14. STERILINE S.R.L. 189
        1. COMPANY OVERVIEW 189
        2. FINANCIAL OVERVIEW 189
        3. PRODUCTS/SERVICES OFFERED 189
        4. KEY DEVELOPMENTS 189
        5. SWOT ANALYSIS 190
        6. KEY STRATEGIES 190
      15. LOCCIONI 191
        1. COMPANY OVERVIEW 191
        2. PRODUCTS/SERVICES OFFERED 191
        3. KEY DEVELOPMENTS 191
        4. SWOT ANALYSIS 192
        5. KEY STRATEGIES 192
    16. APPENDIX
      1. REFERENCES 193
      2. RELATED REPORTS 193
    17. LIST OF TABLES
    18. LIST OF ASSUMPTIONS & LIMITATIONS 23
    19. PRIMARY INTERVIEWS AND INFORMATION GATHERING PROCESS 26
    20. LIST OF POTENTIAL CUSTOMERS FOR GLOBAL COMPOUNDING CHEMOTHERAPY MARKET 42
    21. GLOBAL COMPOUNDING CHEMOTHERAPY MARKET, BY DOSE, 2022–2030 (USD MILLION) 45
    22. GLOBAL COMPOUNDING CHEMOTHERAPY MARKET FOR CHEMOTHERAPEUTIC, BY REGION, 2022–2030 (USD MILLION) 46
    23. GLOBAL COMPOUNDING CHEMOTHERAPY MARKET FOR NON-CHEMOTHERAPEUTICS, BY REGION, 2022–2030 (USD MILLION) 46
    24. GLOBAL COMPOUNDING CHEMOTHERAPY MARKET, BY COMPOUNDING TYPE, 2022–2030 (USD MILLION) 48
    25. GLOBAL COMPOUNDING CHEMOTHERAPY MARKET FOR PHARMACEUTICAL INGREDIENT ALTERATION (PIA),
      1. BY REGION, 2022–2030 (USD MILLION) 48
    26. GLOBAL COMPOUNDING CHEMOTHERAPY MARKET FOR CURRENTLY UNAVAILABLE PHARMACEUTICAL MANUFACTURING,
      1. BY REGION, 2022–2030 (USD MILLION) 49
    27. GLOBAL COMPOUNDING CHEMOTHERAPY MARKET FOR PHARMACEUTICAL DOSAGE ALTERATION,
      1. BY REGION, 2022–2030 (USD MILLION) 50
    28. GLOBAL COMPOUNDING CHEMOTHERAPY MARKET, BY DELIVERY METHOD, 2022–2030 (USD MILLION) 52
    29. GLOBAL COMPOUNDING CHEMOTHERAPY MARKET FOR GRAVIMETRIC AUTOMATED COMPOUNDING DEVICE,
      1. BY REGION, 2022–2030 (USD MILLION) 52
    30. GLOBAL COMPOUNDING CHEMOTHERAPY MARKET FOR VOLUMETRIC AUTOMATED COMPOUNDING DEVICE,
      1. BY REGION, 2022–2030 (USD MILLION) 53
    31. GLOBAL COMPOUNDING CHEMOTHERAPY MARKET, BY STERILITY, 2022–2030 (USD MILLION) 54
    32. GLOBAL COMPOUNDING CHEMOTHERAPY MARKET FOR STERILE, BY REGION, 2022–2030 (USD MILLION) 55
    33. GLOBAL COMPOUNDING CHEMOTHERAPY MARKET FOR NON-STERILE, BY REGION, 2022–2030 (USD MILLION) 56
    34. GLOBAL COMPOUNDING CHEMOTHERAPY MARKET, BY TECHNOLOGY, 2022–2030 (USD MILLION) 57
    35. GLOBAL COMPOUNDING CHEMOTHERAPY MARKET FOR WITH ROBOTIC ARMS, BY REGION, 2022–2030 (USD MILLION) 58
    36. GLOBAL COMPOUNDING CHEMOTHERAPY MARKET FOR WITH ROBOTIC ARMS, BY TYPE, 2022–2030 (USD MILLION) 58
    37. GLOBAL COMPOUNDING CHEMOTHERAPY MARKET FOR WITHOUT ROBOTIC ARMS, BY REGION, 2022–2030 (USD MILLION) 59
    38. GLOBAL COMPOUNDING CHEMOTHERAPY MARKET, BY COMPOUNDER TYPE, 2022–2030 (USD MILLION) 60
    39. GLOBAL COMPOUNDING CHEMOTHERAPY MARKET, BY APPLICATION, 2022–2030 (USD MILLION) 63
    40. GLOBAL COMPOUNDING CHEMOTHERAPY MARKET FOR BREAST CANCER, BY REGION, 2022–2030 (USD MILLION) 63
    41. GLOBAL COMPOUNDING CHEMOTHERAPY MARKET FOR BLOOD CANCER, BY REGION, 2022–2030 (USD MILLION) 64
    42. GLOBAL COMPOUNDING CHEMOTHERAPY MARKET FOR PROSTATE CANCER, BY REGION, 2022–2030 (USD MILLION) 65
    43. GLOBAL COMPOUNDING CHEMOTHERAPY MARKET FOR GASTROINTESTINAL CANCER, BY REGION, 2022–2030 (USD MILLION) 66
    44. GLOBAL COMPOUNDING CHEMOTHERAPY MARKET FOR RESPIRATORY/LUNG CANCER, BY REGION, 2022–2030 (USD MILLION) 66
    45. GLOBAL COMPOUNDING CHEMOTHERAPY MARKET FOR OTHER CANCER APPLICATIONS,
      1. BY REGION, 2022–2030 (USD MILLION) 67
    46. GLOBAL COMPOUNDING CHEMOTHERAPY MARKET, BY REGION, 2022–2030 (USD MILLION) 68
    47. AMERICAS COMPOUNDING CHEMOTHERAPY MARKET, BY REGION, 2022–2030 (USD MILLION) 69
    48. AMERICAS COMPOUNDING CHEMOTHERAPY MARKET, BY DOSE, 2022–2030 (USD MILLION) 70
    49. AMERICAS COMPOUNDING CHEMOTHERAPY MARKET, BY COMPOUNDING TYPE, 2022–2030 (USD MILLION) 70
    50. AMERICAS COMPOUNDING CHEMOTHERAPY MARKET, BY DELIVERY METHOD, 2022–2030 (USD MILLION) 71
    51. AMERICAS COMPOUNDING CHEMOTHERAPY MARKET, BY STERILITY, 2022–2030 (USD MILLION) 71
    52. AMERICAS COMPOUNDING CHEMOTHERAPY MARKET, BY TECHNOLOGY, 2022–2030 (USD MILLION) 71
    53. AMERICAS COMPOUNDING CHEMOTHERAPY MARKET FOR WITH ROBOTIC ARMS, BY TYPE, 2022–2030 (USD MILLION) 72
    54. AMERICAS COMPOUNDING CHEMOTHERAPY MARKET, BY COMPOUNDER TYPE, 2022–2030 (USD MILLION) 72
    55. AMERICAS COMPOUNDING CHEMOTHERAPY MARKET, BY APPLICATION, 2022–2030 (USD MILLION) 72
    56. NORTH AMERICA COMPOUNDING CHEMOTHERAPY MARKET, BY COUNTRY, 2022–2030 (USD MILLION) 73
    57. NORTH AMERICA COMPOUNDING CHEMOTHERAPY MARKET, BY DOSE, 2022–2030 (USD MILLION) 73
    58. NORTH AMERICA COMPOUNDING CHEMOTHERAPY MARKET, BY COMPOUNDING TYPE, 2022–2030 (USD MILLION) 74
    59. NORTH AMERICA COMPOUNDING CHEMOTHERAPY MARKET, BY DELIVERY METHOD, 2022–2030 (USD MILLION) 74
    60. NORTH AMERICA COMPOUNDING CHEMOTHERAPY MARKET, BY STERILITY, 2022–2030 (USD MILLION) 74
    61. NORTH AMERICA COMPOUNDING CHEMOTHERAPY MARKET, BY TECHNOLOGY, 2022–2030 (USD MILLION) 75
    62. NORTH AMERICA COMPOUNDING CHEMOTHERAPY MARKET FOR WITH ROBOTIC ARMS, BY TYPE, 2022–2030 (USD MILLION) 75
    63. NORTH AMERICA COMPOUNDING CHEMOTHERAPY MARKET, BY COMPOUNDER TYPE, 2022–2030 (USD MILLION) 75
    64. NORTH AMERICA COMPOUNDING CHEMOTHERAPY MARKET, BY APPLICATION, 2022–2030 (USD MILLION) 76
    65. US COMPOUNDING CHEMOTHERAPY MARKET, BY DOSE, 2022–2030 (USD MILLION) 76
    66. US COMPOUNDING CHEMOTHERAPY MARKET, BY COMPOUNDING TYPE, 2022–2030 (USD MILLION) 77
    67. US COMPOUNDING CHEMOTHERAPY MARKET, BY DELIVERY METHOD, 2022–2030 (USD MILLION) 77
    68. US COMPOUNDING CHEMOTHERAPY MARKET, BY STERILITY, 2022–2030 (USD MILLION) 78
    69. US COMPOUNDING CHEMOTHERAPY MARKET, BY TECHNOLOGY, 2022–2030 (USD MILLION) 78
    70. US COMPOUNDING CHEMOTHERAPY MARKET FOR WITH ROBOTIC ARMS, BY TYPE, 2022–2030 (USD MILLION) 78
    71. US COMPOUNDING CHEMOTHERAPY MARKET, BY COMPOUNDER TYPE, 2022–2030 (USD MILLION) 79
    72. US COMPOUNDING CHEMOTHERAPY MARKET, BY APPLICATION, 2022–2030 (USD MILLION) 79
    73. CANADA COMPOUNDING CHEMOTHERAPY MARKET, BY DOSE, 2022–2030 (USD MILLION) 79
    74. CANADA COMPOUNDING CHEMOTHERAPY MARKET, BY COMPOUNDING TYPE, 2022–2030 (USD MILLION) 80
    75. CANADA COMPOUNDING CHEMOTHERAPY MARKET, BY DELIVERY METHOD, 2022–2030 (USD MILLION) 80
    76. CANADA COMPOUNDING CHEMOTHERAPY MARKET, BY STERILITY, 2022–2030 (USD MILLION) 80
    77. CANADA COMPOUNDING CHEMOTHERAPY MARKET, BY TECHNOLOGY, 2022–2030 (USD MILLION) 81
    78. CANADA COMPOUNDING CHEMOTHERAPY MARKET FOR WITH ROBOTIC ARMS, BY TYPE, 2022–2030 (USD MILLION) 81
    79. CANADA COMPOUNDING CHEMOTHERAPY MARKET, BY COMPOUNDER TYPE, 2022–2030 (USD MILLION) 81
    80. CANADA COMPOUNDING CHEMOTHERAPY MARKET, BY APPLICATION, 2022–2030 (USD MILLION) 82
    81. LATIN AMERICA COMPOUNDING CHEMOTHERAPY MARKET, BY COUNTRY/REGION, 2022–2030 (USD MILLION) 82
    82. LATIN AMERICA COMPOUNDING CHEMOTHERAPY MARKET, BY DOSE, 2022–2030 (USD MILLION) 82
    83. LATIN AMERICA COMPOUNDING CHEMOTHERAPY MARKET, BY COMPOUNDING TYPE, 2022–2030 (USD MILLION) 83
    84. LATIN AMERICA COMPOUNDING CHEMOTHERAPY MARKET, BY DELIVERY METHOD, 2022–2030 (USD MILLION) 83
    85. LATIN AMERICA COMPOUNDING CHEMOTHERAPY MARKET, BY STERILITY, 2022–2030 (USD MILLION) 83
    86. LATIN AMERICA COMPOUNDING CHEMOTHERAPY MARKET, BY TECHNOLOGY, 2022–2030 (USD MILLION) 84
    87. LATIN AMERICA COMPOUNDING CHEMOTHERAPY MARKET FOR WITH ROBOTIC ARMS, BY TYPE, 2022–2030 (USD MILLION) 84
    88. LATIN AMERICA COMPOUNDING CHEMOTHERAPY MARKET, BY COMPOUNDER TYPE, 2022–2030 (USD MILLION) 84
    89. LATIN AMERICA COMPOUNDING CHEMOTHERAPY MARKET, BY APPLICATION, 2022–2030 (USD MILLION) 85
    90. BRAZIL COMPOUNDING CHEMOTHERAPY MARKET, BY DOSE, 2022–2030 (USD MILLION) 85
    91. BRAZIL COMPOUNDING CHEMOTHERAPY MARKET, BY COMPOUNDING TYPE, 2022–2030 (USD MILLION) 86
    92. BRAZIL COMPOUNDING CHEMOTHERAPY MARKET, BY DELIVERY METHOD, 2022–2030 (USD MILLION) 86
    93. BRAZIL COMPOUNDING CHEMOTHERAPY MARKET, BY STERILITY, 2022–2030 (USD MILLION) 86
    94. BRAZIL COMPOUNDING CHEMOTHERAPY MARKET, BY TECHNOLOGY, 2022–2030 (USD MILLION) 87
    95. BRAZIL COMPOUNDING CHEMOTHERAPY MARKET FOR WITH ROBOTIC ARMS, BY TYPE, 2022–2030 (USD MILLION) 87
    96. BRAZIL COMPOUNDING CHEMOTHERAPY MARKET, BY COMPOUNDER TYPE, 2022–2030 (USD MILLION) 87
    97. BRAZIL COMPOUNDING CHEMOTHERAPY MARKET, BY APPLICATION, 2022–2030 (USD MILLION) 88
    98. REST OF LATIN AMERICA COMPOUNDING CHEMOTHERAPY MARKET, BY DOSE, 2022–2030 (USD MILLION) 88
    99. REST OF LATIN AMERICA COMPOUNDING CHEMOTHERAPY MARKET, BY COMPOUNDING TYPE, 2022–2030 (USD MILLION) 89
    100. REST OF LATIN AMERICA COMPOUNDING CHEMOTHERAPY MARKET, BY DELIVERY METHOD, 2022–2030 (USD MILLION) 89
    101. REST OF LATIN AMERICA COMPOUNDING CHEMOTHERAPY MARKET, BY STERILITY, 2022–2030 (USD MILLION) 89
    102. REST OF LATIN AMERICA COMPOUNDING CHEMOTHERAPY MARKET, BY TECHNOLOGY, 2022–2030 (USD MILLION) 90
    103. REST OF LATIN AMERICA COMPOUNDING CHEMOTHERAPY MARKET FOR WITH ROBOTIC ARMS, BY TYPE, 2022–2030 (USD MILLION) 90
    104. REST OF LATIN AMERICA COMPOUNDING CHEMOTHERAPY MARKET, BY COMPOUNDER TYPE, 2022–2030 (USD MILLION) 90
    105. REST OF LATIN AMERICA COMPOUNDING CHEMOTHERAPY MARKET, BY APPLICATION, 2022–2030 (USD MILLION) 91
    106. EUROPE COMPOUNDING CHEMOTHERAPY MARKET, BY REGION, 2022–2030 (USD MILLION) 92
    107. EUROPE COMPOUNDING CHEMOTHERAPY MARKET, BY DOSE, 2022–2030 (USD MILLION) 93
    108. EUROPE COMPOUNDING CHEMOTHERAPY MARKET, BY COMPOUNDING TYPE, 2022–2030 (USD MILLION) 93
    109. EUROPE COMPOUNDING CHEMOTHERAPY MARKET, BY DELIVERY METHOD, 2022–2030 (USD MILLION) 93
    110. EUROPE COMPOUNDING CHEMOTHERAPY MARKET, BY STERILITY, 2022–2030 (USD MILLION) 94
    111. EUROPE COMPOUNDING CHEMOTHERAPY MARKET, BY TECHNOLOGY, 2022–2030 (USD MILLION) 94
    112. EUROPE COMPOUNDING CHEMOTHERAPY MARKET FOR WITH ROBOTIC ARMS, BY TYPE, 2022–2030 (USD MILLION) 94
    113. EUROPE COMPOUNDING CHEMOTHERAPY MARKET, BY COMPOUNDER TYPE, 2022–2030 (USD MILLION) 95
    114. EUROPE COMPOUNDING CHEMOTHERAPY MARKET, BY APPLICATION, 2022–2030 (USD MILLION) 95
    115. WESTERN EUROPE COMPOUNDING CHEMOTHERAPY MARKET, BY COUNTRY, 2022–2030 (USD MILLION) 96
    116. WESTERN EUROPE COMPOUNDING CHEMOTHERAPY MARKET, BY DOSE, 2022–2030 (USD MILLION) 97
    117. WESTERN EUROPE COMPOUNDING CHEMOTHERAPY MARKET, BY COMPOUNDING TYPE, 2022–2030 (USD MILLION) 97
    118. WESTERN EUROPE COMPOUNDING CHEMOTHERAPY MARKET, BY DELIVERY METHOD, 2022–2030 (USD MILLION) 97
    119. WESTERN EUROPE COMPOUNDING CHEMOTHERAPY MARKET, BY STERILITY, 2022–2030 (USD MILLION) 98
    120. WESTERN EUROPE COMPOUNDING CHEMOTHERAPY MARKET, BY TECHNOLOGY, 2022–2030 (USD MILLION) 98
    121. WESTERN EUROPE COMPOUNDING CHEMOTHERAPY MARKET FOR WITH ROBOTIC ARMS, BY TYPE, 2022–2030 (USD MILLION) 98
    122. WESTERN EUROPE COMPOUNDING CHEMOTHERAPY MARKET, BY COMPOUNDER TYPE, 2022–2030 (USD MILLION) 99
    123. WESTERN EUROPE COMPOUNDING CHEMOTHERAPY MARKET, BY APPLICATION, 2022–2030 (USD MILLION) 99
    124. GERMANY COMPOUNDING CHEMOTHERAPY MARKET, BY DOSE, 2022–2030 (USD MILLION) 99
    125. GERMANY COMPOUNDING CHEMOTHERAPY MARKET, BY COMPOUNDING TYPE, 2022–2030 (USD MILLION) 100
    126. GERMANY COMPOUNDING CHEMOTHERAPY MARKET, BY DELIVERY METHOD, 2022–2030 (USD MILLION) 100
    127. GERMANY COMPOUNDING CHEMOTHERAPY MARKET, BY STERILITY, 2022–2030 (USD MILLION) 100
    128. GERMANY COMPOUNDING CHEMOTHERAPY MARKET, BY TECHNOLOGY, 2022–2030 (USD MILLION) 101
    129. GERMANY COMPOUNDING CHEMOTHERAPY MARKET FOR WITH ROBOTIC ARMS, BY TYPE, 2022–2030 (USD MILLION) 101
    130. GERMANY COMPOUNDING CHEMOTHERAPY MARKET, BY COMPOUNDER TYPE, 2022–2030 (USD MILLION) 101
    131. GERMANY COMPOUNDING CHEMOTHERAPY MARKET, BY APPLICATION, 2022–2030 (USD MILLION) 102
    132. FRANCE COMPOUNDING CHEMOTHERAPY MARKET, BY DOSE, 2022–2030 (USD MILLION) 102
    133. FRANCE COMPOUNDING CHEMOTHERAPY MARKET, BY COMPOUNDING TYPE, 2022–2030 (USD MILLION) 103
    134. FRANCE COMPOUNDING CHEMOTHERAPY MARKET, BY DELIVERY METHOD, 2022–2030 (USD MILLION) 103
    135. FRANCE COMPOUNDING CHEMOTHERAPY MARKET, BY STERILITY, 2022–2030 (USD MILLION) 103
    136. FRANCE COMPOUNDING CHEMOTHERAPY MARKET, BY TECHNOLOGY, 2022–2030 (USD MILLION) 104
    137. FRANCE COMPOUNDING CHEMOTHERAPY MARKET FOR WITH ROBOTIC ARMS, BY TYPE, 2022–2030 (USD MILLION) 104
    138. FRANCE COMPOUNDING CHEMOTHERAPY MARKET, BY COMPOUNDER TYPE, 2022–2030 (USD MILLION) 104
    139. FRANCE COMPOUNDING CHEMOTHERAPY MARKET, BY APPLICATION, 2022–2030 (USD MILLION) 105
    140. UK COMPOUNDING CHEMOTHERAPY MARKET, BY DOSE, 2022–2030 (USD MILLION) 105
    141. UK COMPOUNDING CHEMOTHERAPY MARKET, BY COMPOUNDING TYPE, 2022–2030 (USD MILLION) 106
    142. UK COMPOUNDING CHEMOTHERAPY MARKET, BY DELIVERY METHOD, 2022–2030 (USD MILLION) 106
    143. UK COMPOUNDING CHEMOTHERAPY MARKET, BY STERILITY, 2022–2030 (USD MILLION) 106
    144. UK COMPOUNDING CHEMOTHERAPY MARKET, BY TECHNOLOGY, 2022–2030 (USD MILLION) 107
    145. UK COMPOUNDING CHEMOTHERAPY MARKET FOR WITH ROBOTIC ARMS, BY TYPE, 2022–2030 (USD MILLION) 107
    146. UK COMPOUNDING CHEMOTHERAPY MARKET, BY COMPOUNDER TYPE, 2022–2030 (USD MILLION) 107
    147. UK COMPOUNDING CHEMOTHERAPY MARKET, BY APPLICATION, 2022–2030 (USD MILLION) 108
    148. ITALY COMPOUNDING CHEMOTHERAPY MARKET, BY DOSE, 2022–2030 (USD MILLION) 108
    149. ITALY COMPOUNDING CHEMOTHERAPY MARKET, BY COMPOUNDING TYPE, 2022–2030 (USD MILLION) 109
    150. ITALY COMPOUNDING CHEMOTHERAPY MARKET, BY DELIVERY METHOD, 2022–2030 (USD MILLION) 109
    151. ITALY COMPOUNDING CHEMOTHERAPY MARKET, BY STERILITY, 2022–2030 (USD MILLION) 109
    152. ITALY COMPOUNDING CHEMOTHERAPY MARKET, BY TECHNOLOGY, 2022–2030 (USD MILLION) 110
    153. ITALY COMPOUNDING CHEMOTHERAPY MARKET FOR WITH ROBOTIC ARMS, BY TYPE, 2022–2030 (USD MILLION) 110
    154. ITALY COMPOUNDING CHEMOTHERAPY MARKET, BY COMPOUNDER TYPE, 2022–2030 (USD MILLION) 110
    155. ITALY COMPOUNDING CHEMOTHERAPY MARKET, BY APPLICATION, 2022–2030 (USD MILLION) 111
    156. SPAIN COMPOUNDING CHEMOTHERAPY MARKET, BY DOSE, 2022–2030 (USD MILLION) 111
    157. SPAIN COMPOUNDING CHEMOTHERAPY MARKET, BY COMPOUNDING TYPE, 2022–2030 (USD MILLION) 112
    158. SPAIN COMPOUNDING CHEMOTHERAPY MARKET, BY DELIVERY METHOD, 2022–2030 (USD MILLION) 112
    159. SPAIN COMPOUNDING CHEMOTHERAPY MARKET, BY STERILITY, 2022–2030 (USD MILLION) 112
    160. SPAIN COMPOUNDING CHEMOTHERAPY MARKET, BY TECHNOLOGY, 2022–2030 (USD MILLION) 113
    161. SPAIN COMPOUNDING CHEMOTHERAPY MARKET FOR WITH ROBOTIC ARMS, BY TYPE, 2022–2030 (USD MILLION) 113
    162. SPAIN COMPOUNDING CHEMOTHERAPY MARKET, BY COMPOUNDER TYPE, 2022–2030 (USD MILLION) 113
    163. SPAIN COMPOUNDING CHEMOTHERAPY MARKET, BY APPLICATION, 2022–2030 (USD MILLION) 114
    164. REST OF WESTERN EUROPE COMPOUNDING CHEMOTHERAPY MARKET, BY DOSE, 2022–2030 (USD MILLION) 114
    165. REST OF WESTERN EUROPE COMPOUNDING CHEMOTHERAPY MARKET, BY COMPOUNDING TYPE, 2022–2030 (USD MILLION) 115
    166. REST OF WESTERN EUROPE COMPOUNDING CHEMOTHERAPY MARKET, BY DELIVERY METHOD, 2022–2030 (USD MILLION) 115
    167. REST OF WESTERN EUROPE COMPOUNDING CHEMOTHERAPY MARKET, BY STERILITY, 2022–2030 (USD MILLION) 115
    168. REST OF WESTERN EUROPE COMPOUNDING CHEMOTHERAPY MARKET, BY TECHNOLOGY, 2022–2030 (USD MILLION) 116
    169. REST OF WESTERN EUROPE COMPOUNDING CHEMOTHERAPY MARKET FOR WITH ROBOTIC ARMS,
      1. BY TYPE, 2022–2030 (USD MILLION) 116
    170. REST OF WESTERN EUROPE COMPOUNDING CHEMOTHERAPY MARKET, BY COMPOUNDER TYPE, 2022–2030 (USD MILLION) 116
    171. REST OF WESTERN EUROPE COMPOUNDING CHEMOTHERAPY MARKET, BY APPLICATION, 2022–2030 (USD MILLION) 117
    172. EASTERN EUROPE COMPOUNDING CHEMOTHERAPY MARKET, BY DOSE, 2022–2030 (USD MILLION) 117
    173. EASTERN EUROPE COMPOUNDING CHEMOTHERAPY MARKET, BY COMPOUNDING TYPE, 2022–2030 (USD MILLION) 118
    174. EASTERN EUROPE COMPOUNDING CHEMOTHERAPY MARKET, BY DELIVERY METHOD, 2022–2030 (USD MILLION) 118
    175. EASTERN EUROPE COMPOUNDING CHEMOTHERAPY MARKET, BY STERILITY, 2022–2030 (USD MILLION) 118
    176. EASTERN EUROPE COMPOUNDING CHEMOTHERAPY MARKET, BY TECHNOLOGY, 2022–2030 (USD MILLION) 119
    177. EASTERN EUROPE COMPOUNDING CHEMOTHERAPY MARKET FOR WITH ROBOTIC ARMS, BY TYPE, 2022–2030 (USD MILLION) 119
    178. EASTERN EUROPE COMPOUNDING CHEMOTHERAPY MARKET, BY COMPOUNDER TYPE, 2022–2030 (USD MILLION) 119
    179. EASTERN EUROPE COMPOUNDING CHEMOTHERAPY MARKET, BY APPLICATION, 2022–2030 (USD MILLION) 120
    180. ASIA-PACIFIC COMPOUNDING CHEMOTHERAPY MARKET, BY COUNTRY, 2022–2030 (USD MILLION) 121
    181. ASIA-PACIFIC COMPOUNDING CHEMOTHERAPY MARKET, BY DOSE, 2022–2030 (USD MILLION) 122
    182. ASIA-PACIFIC COMPOUNDING CHEMOTHERAPY MARKET, BY COMPOUNDING TYPE, 2022–2030 (USD MILLION) 122
    183. ASIA-PACIFIC COMPOUNDING CHEMOTHERAPY MARKET, BY DELIVERY METHOD, 2022–2030 (USD MILLION) 123
    184. ASIA-PACIFIC COMPOUNDING CHEMOTHERAPY MARKET, BY STERILITY, 2022–2030 (USD MILLION) 123
    185. ASIA-PACIFIC COMPOUNDING CHEMOTHERAPY MARKET, BY TECHNOLOGY, 2022–2030 (USD MILLION) 123
    186. ASIA-PACIFIC COMPOUNDING CHEMOTHERAPY MARKET FOR WITH ROBOTIC ARMS, BY TYPE, 2022–2030 (USD MILLION) 124
    187. ASIA-PACIFIC COMPOUNDING CHEMOTHERAPY MARKET, BY COMPOUNDER TYPE, 2022–2030 (USD MILLION) 124
    188. ASIA-PACIFIC COMPOUNDING CHEMOTHERAPY MARKET, BY APPLICATION, 2022–2030 (USD MILLION) 124
    189. CHINA COMPOUNDING CHEMOTHERAPY MARKET, BY DOSE, 2022–2030 (USD MILLION) 125
    190. CHINA COMPOUNDING CHEMOTHERAPY MARKET, BY COMPOUNDING TYPE, 2022–2030 (USD MILLION) 125
    191. CHINA COMPOUNDING CHEMOTHERAPY MARKET, BY DELIVERY METHOD, 2022–2030 (USD MILLION) 125
    192. CHINA COMPOUNDING CHEMOTHERAPY MARKET, BY STERILITY, 2022–2030 (USD MILLION) 126
    193. CHINA COMPOUNDING CHEMOTHERAPY MARKET, BY TECHNOLOGY, 2022–2030 (USD MILLION) 126
    194. CHINA COMPOUNDING CHEMOTHERAPY MARKET FOR WITH ROBOTIC ARMS, BY TYPE, 2022–2030 (USD MILLION) 126
    195. CHINA COMPOUNDING CHEMOTHERAPY MARKET, BY COMPOUNDER TYPE, 2022–2030 (USD MILLION) 127
    196. CHINA COMPOUNDING CHEMOTHERAPY MARKET, BY APPLICATION, 2022–2030 (USD MILLION) 127
    197. JAPAN COMPOUNDING CHEMOTHERAPY MARKET, BY DOSE, 2022–2030 (USD MILLION) 127
    198. JAPAN COMPOUNDING CHEMOTHERAPY MARKET, BY COMPOUNDING TYPE, 2022–2030 (USD MILLION) 128
    199. JAPAN COMPOUNDING CHEMOTHERAPY MARKET, BY DELIVERY METHOD, 2022–2030 (USD MILLION) 128
    200. JAPAN COMPOUNDING CHEMOTHERAPY MARKET, BY STERILITY, 2022–2030 (USD MILLION) 128
    201. JAPAN COMPOUNDING CHEMOTHERAPY MARKET, BY TECHNOLOGY, 2022–2030 (USD MILLION) 129
    202. JAPAN COMPOUNDING CHEMOTHERAPY MARKET FOR WITH ROBOTIC ARMS, BY TYPE, 2022–2030 (USD MILLION) 129
    203. JAPAN COMPOUNDING CHEMOTHERAPY MARKET, BY COMPOUNDER TYPE, 2022–2030 (USD MILLION) 129
    204. JAPAN COMPOUNDING CHEMOTHERAPY MARKET, BY APPLICATION, 2022–2030 (USD MILLION) 130
    205. INDIA COMPOUNDING CHEMOTHERAPY MARKET, BY DOSE, 2022–2030 (USD MILLION) 130
    206. INDIA COMPOUNDING CHEMOTHERAPY MARKET, BY COMPOUNDING TYPE, 2022–2030 (USD MILLION) 131
    207. INDIA COMPOUNDING CHEMOTHERAPY MARKET, BY DELIVERY METHOD, 2022–2030 (USD MILLION) 131
    208. INDIA COMPOUNDING CHEMOTHERAPY MARKET, BY STERILITY, 2022–2030 (USD MILLION) 131
    209. INDIA COMPOUNDING CHEMOTHERAPY MARKET, BY TECHNOLOGY, 2022–2030 (USD MILLION) 132
    210. INDIA COMPOUNDING CHEMOTHERAPY MARKET FOR WITH ROBOTIC ARMS, BY TYPE, 2022–2030 (USD MILLION) 132
    211. INDIA COMPOUNDING CHEMOTHERAPY MARKET, BY COMPOUNDER TYPE, 2022–2030 (USD MILLION) 132
    212. INDIA COMPOUNDING CHEMOTHERAPY MARKET, BY APPLICATION, 2022–2030 (USD MILLION) 133
    213. AUSTRALIA COMPOUNDING CHEMOTHERAPY MARKET, BY DOSE, 2022–2030 (USD MILLION) 133
    214. AUSTRALIA COMPOUNDING CHEMOTHERAPY MARKET, BY COMPOUNDING TYPE, 2022–2030 (USD MILLION) 134
    215. AUSTRALIA COMPOUNDING CHEMOTHERAPY MARKET, BY DELIVERY METHOD, 2022–2030 (USD MILLION) 134
    216. AUSTRALIA COMPOUNDING CHEMOTHERAPY MARKET, BY STERILITY, 2022–2030 (USD MILLION) 134
    217. AUSTRALIA COMPOUNDING CHEMOTHERAPY MARKET, BY TECHNOLOGY, 2022–2030 (USD MILLION) 135
    218. AUSTRALIA COMPOUNDING CHEMOTHERAPY MARKET FOR WITH ROBOTIC ARMS, BY TYPE, 2022–2030 (USD MILLION) 135
    219. AUSTRALIA COMPOUNDING CHEMOTHERAPY MARKET, BY COMPOUNDER TYPE, 2022–2030 (USD MILLION) 135
    220. AUSTRALIA COMPOUNDING CHEMOTHERAPY MARKET, BY APPLICATION, 2022–2030 (USD MILLION) 136
    221. SOUTH KOREA COMPOUNDING CHEMOTHERAPY MARKET, BY DOSE, 2022–2030 (USD MILLION) 136
    222. SOUTH KOREA COMPOUNDING CHEMOTHERAPY MARKET, BY COMPOUNDING TYPE, 2022–2030 (USD MILLION) 137
    223. SOUTH KOREA COMPOUNDING CHEMOTHERAPY MARKET, BY DELIVERY METHOD, 2022–2030 (USD MILLION) 137
    224. SOUTH KOREA COMPOUNDING CHEMOTHERAPY MARKET, BY STERILITY, 2022–2030 (USD MILLION) 137
    225. SOUTH KOREA COMPOUNDING CHEMOTHERAPY MARKET, BY TECHNOLOGY, 2022–2030 (USD MILLION) 138
    226. SOUTH KOREA COMPOUNDING CHEMOTHERAPY MARKET FOR WITH ROBOTIC ARMS, BY TYPE, 2022–2030 (USD MILLION) 138
    227. SOUTH KOREA COMPOUNDING CHEMOTHERAPY MARKET, BY COMPOUNDER TYPE, 2022–2030 (USD MILLION) 138
    228. SOUTH KOREA COMPOUNDING CHEMOTHERAPY MARKET, BY APPLICATION, 2022–2030 (USD MILLION) 139
    229. REST OF ASIA-PACIFIC COMPOUNDING CHEMOTHERAPY MARKET, BY DOSE, 2022–2030 (USD MILLION) 139
    230. REST OF ASIA-PACIFIC COMPOUNDING CHEMOTHERAPY MARKET, BY COMPOUNDING TYPE, 2022–2030 (USD MILLION) 139
    231. REST OF ASIA-PACIFIC COMPOUNDING CHEMOTHERAPY MARKET, BY DELIVERY METHOD, 2022–2030 (USD MILLION) 140
    232. REST OF ASIA-PACIFIC COMPOUNDING CHEMOTHERAPY MARKET, BY STERILITY, 2022–2030 (USD MILLION) 140
    233. REST OF ASIA-PACIFIC COMPOUNDING CHEMOTHERAPY MARKET, BY TECHNOLOGY, 2022–2030 (USD MILLION) 140
    234. REST OF ASIA-PACIFIC COMPOUNDING CHEMOTHERAPY MARKET FOR WITH ROBOTIC ARMS, BY TYPE, 2022–2030 (USD MILLION) 141
    235. REST OF ASIA-PACIFIC COMPOUNDING CHEMOTHERAPY MARKET, BY COMPOUNDER TYPE, 2022–2030 (USD MILLION) 141
    236. REST OF ASIA-PACIFIC COMPOUNDING CHEMOTHERAPY MARKET, BY APPLICATION, 2022–2030 (USD MILLION) 141
    237. MIDDLE EAST & AFRICA COMPOUNDING CHEMOTHERAPY MARKET, BY REGION, 2022–2030 (USD MILLION) 142
    238. MIDDLE EAST & AFRICA COMPOUNDING CHEMOTHERAPY MARKET, BY DOSE, 2022–2030 (USD MILLION) 143
    239. MIDDLE EAST & AFRICA COMPOUNDING CHEMOTHERAPY MARKET, BY COMPOUNDING TYPE, 2022–2030 (USD MILLION) 143
    240. MIDDLE EAST & AFRICA COMPOUNDING CHEMOTHERAPY MARKET, BY

    Market Segmentation TabCompounding Chemotherapy Dose Outlook (USD Billion, 2018-2030)

    Chemotherapeutic

    Non-Chemotherapeutics

    Compounding Chemotherapy Delivery Method Outlook (USD Billion, 2018-2030)

    Gravimetric Automated Compounding Device

    Volumetric Automated Compounding Device

    Compounding Chemotherapy Sterility Outlook (USD Billion, 2018-2030)

    Sterile

    Non-Sterile

    Compounding Chemotherapy Technology Outlook (USD Billion, 2018-2030)

    With Robotic Arms

    Without Robotic Arms

    Compounding Chemotherapy Regional Outlook (USD Billion, 2018-2030)

    North America Outlook (USD Billion, 2018-2030)

    North America Compounding Chemotherapy by Dose

    Chemotherapeutic

    Non-Chemotherapeutics

    North America Compounding Chemotherapy by Delivery Method

    Gravimetric Automated Compounding Device

    Volumetric Automated Compounding Device

    North America Compounding Chemotherapy by Sterility

    Sterile

    Non-Sterile

    North America Compounding Chemotherapy by Technology

    With Robotic Arms

    Without Robotic Arms

    US Outlook (USD Billion, 2018-2030)

    US Compounding Chemotherapy by Dose

    Chemotherapeutic

    Non-Chemotherapeutics

    US Compounding Chemotherapy by Delivery Method

    Gravimetric Automated Compounding Device

    Volumetric Automated Compounding Device

    US Compounding Chemotherapy by Sterility

    Sterile

    Non-Sterile

    US Compounding Chemotherapy by Technology

    With Robotic Arms

    Without Robotic Arms

    CANADA Outlook (USD Billion, 2018-2030)

    CANADA Compounding Chemotherapy by Dose

    Chemotherapeutic

    Non-Chemotherapeutics

    CANADA Compounding Chemotherapy by Delivery Method

    Gravimetric Automated Compounding Device

    Volumetric Automated Compounding Device

    CANADA Compounding Chemotherapy by Sterility

    Sterile

    Non-Sterile

    CANADA Compounding Chemotherapy by Technology

    With Robotic Arms

    Without Robotic Arms

    Europe Outlook (USD Billion, 2018-2030)

    Europe Compounding Chemotherapy by Dose

    Chemotherapeutic

    Non-Chemotherapeutics

    Europe Compounding Chemotherapy by Delivery Method

    Gravimetric Automated Compounding Device

    Volumetric Automated Compounding Device

    Europe Compounding Chemotherapy by Sterility

    Sterile

    Non-Sterile

    Europe Compounding Chemotherapy by Technology

    With Robotic Arms

    Without Robotic Arms

    Germany Outlook (USD Billion, 2018-2030)

    Germany Compounding Chemotherapy by Dose

    Chemotherapeutic

    Non-Chemotherapeutics

    Germany Compounding Chemotherapy by Delivery Method

    Gravimetric Automated Compounding Device

    Volumetric Automated Compounding Device

    Germany Compounding Chemotherapy by Sterility

    Sterile

    Non-Sterile

    Germany Compounding Chemotherapy by Technology

    With Robotic Arms

    Without Robotic Arms

    France Outlook (USD Billion, 2018-2030)

    France Compounding Chemotherapy by Dose

    Chemotherapeutic

    Non-Chemotherapeutics

    France Compounding Chemotherapy by Delivery Method

    Gravimetric Automated Compounding Device

    Volumetric Automated Compounding Device

    France Compounding Chemotherapy by Sterility

    Sterile

    Non-Sterile

    France Compounding Chemotherapy by Technology

    With Robotic Arms

    Without Robotic Arms

    UK Outlook (USD Billion, 2018-2030)

    UK Compounding Chemotherapy by Dose

    Chemotherapeutic

    Non-Chemotherapeutics

    UK Compounding Chemotherapy by Delivery Method

    Gravimetric Automated Compounding Device

    Volumetric Automated Compounding Device

    UK Compounding Chemotherapy by Sterility

    Sterile

    Non-Sterile

    UK Compounding Chemotherapy by Technology

    With Robotic Arms

    Without Robotic Arms

    ITALY Outlook (USD Billion, 2018-2030)

    ITALY Compounding Chemotherapy by Dose

    Chemotherapeutic

    Non-Chemotherapeutics

    ITALY Compounding Chemotherapy by Delivery Method

    Gravimetric Automated Compounding Device

    Volumetric Automated Compounding Device

    ITALY Compounding Chemotherapy by Sterility

    Sterile

    Non-Sterile

    ITALY Compounding Chemotherapy by Technology

    With Robotic Arms

    Without Robotic Arms


    SPAIN Outlook (USD Billion, 2018-2030)

    Spain Compounding Chemotherapy by Dose

    Chemotherapeutic

    Non-Chemotherapeutics

    Spain Compounding Chemotherapy by Delivery Method

    Gravimetric Automated Compounding Device

    Volumetric Automated Compounding Device

    Spain Compounding Chemotherapy by Sterility

    Sterile

    Non-Sterile

    Spain Compounding Chemotherapy by Technology

    With Robotic Arms

    Without Robotic Arms

    Rest Of Europe Outlook (USD Billion, 2018-2030)

    Rest Of Europe Compounding Chemotherapy by Dose

    Chemotherapeutic

    Non-Chemotherapeutics

    REST OF EUROPE Compounding Chemotherapy by Delivery Method

    Gravimetric Automated Compounding Device

    Volumetric Automated Compounding Device

    REST OF EUROPE Compounding Chemotherapy by Sterility

    Sterile

    Non-Sterile

    REST OF EUROPE Compounding Chemotherapy by Technology

    With Robotic Arms

    Without Robotic Arms

    Asia-Pacific Outlook (USD Billion, 2018-2030)

    Asia-Pacific Compounding Chemotherapy by Dose

    Chemotherapeutic

    Non-Chemotherapeutics

    Asia-Pacific Compounding Chemotherapy by Delivery Method

    Gravimetric Automated Compounding Device

    Volumetric Automated Compounding Device

    Asia-Pacific Compounding Chemotherapy by Sterility

    Sterile

    Non-Sterile

    Asia-Pacific Compounding Chemotherapy by Technology

    With Robotic Arms

    Without Robotic Arms

    China Outlook (USD Billion, 2018-2030)

    China Compounding Chemotherapy by Dose

    Chemotherapeutic

    Non-Chemotherapeutics

    China Compounding Chemotherapy by Delivery Method

    Gravimetric Automated Compounding Device

    Volumetric Automated Compounding Device

    China Compounding Chemotherapy by Sterility

    Sterile

    Non-Sterile

    China Compounding Chemotherapy by Technology

    With Robotic Arms

    Without Robotic Arms

    Japan Outlook (USD Billion, 2018-2030)

    Japan Compounding Chemotherapy by Dose

    Chemotherapeutic

    Non-Chemotherapeutics

    Japan Compounding Chemotherapy by Delivery Method

    Gravimetric Automated Compounding Device

    Volumetric Automated Compounding Device

    Japan Compounding Chemotherapy by Sterility

    Sterile

    Non-Sterile

    Japan Compounding Chemotherapy by Technology

    With Robotic Arms

    Without Robotic Arms

    India Outlook (USD Billion, 2018-2030)

    India Compounding Chemotherapy by Dose

    Chemotherapeutic

    Non-Chemotherapeutics

    India Compounding Chemotherapy by Delivery Method

    Gravimetric Automated Compounding Device

    Volumetric Automated Compounding Device

    India Compounding Chemotherapy by Sterility

    Sterile

    Non-Sterile

    India Compounding Chemotherapy by Technology

    With Robotic Arms

    Without Robotic Arms

    Australia Outlook (USD Billion, 2018-2030)

    Australia Compounding Chemotherapy by Dose

    Chemotherapeutic

    Non-Chemotherapeutics

    Australia Compounding Chemotherapy by Delivery Method

    Gravimetric Automated Compounding Device

    Volumetric Automated Compounding Device

    Australia Compounding Chemotherapy by Sterility

    Sterile

    Non-Sterile

    Australia Compounding Chemotherapy by Technology

    With Robotic Arms

    Without Robotic Arms

    Rest of Asia-Pacific Outlook (USD Billion, 2018-2030)

    Rest of Asia-Pacific Compounding Chemotherapy by Dose

    Chemotherapeutic

    Non-Chemotherapeutics

    Rest of Asia-Pacific Compounding Chemotherapy by Delivery Method

    Gravimetric Automated Compounding Device

    Volumetric Automated Compounding Device

    Rest of Asia-Pacific Compounding Chemotherapy by Sterility

    Sterile

    Non-Sterile

    Rest of Asia-Pacific Compounding Chemotherapy by Technology

    With Robotic Arms

    Without Robotic Arms

    Rest of the World Outlook (USD Billion, 2018-2030)

    Rest of the World Compounding Chemotherapy by Dose

    Chemotherapeutic

    Non-Chemotherapeutics

    Rest of the World Compounding Chemotherapy by Delivery Method

    Gravimetric Automated Compounding Device

    Volumetric Automated Compounding Device

    Rest of the World Compounding Chemotherapy by Sterility

    Sterile

    Non-Sterile

    Rest of the World Compounding Chemotherapy by Technology

    With Robotic Arms

    Without Robotic Arms


    Middle East Outlook (USD Billion, 2018-2030)

    Middle East Compounding Chemotherapy by Dose

    Chemotherapeutic

    Non-Chemotherapeutics

    Middle East Compounding Chemotherapy by Delivery Method

    Gravimetric Automated Compounding Device

    Volumetric Automated Compounding Device

    Middle East Compounding Chemotherapy by Sterility

    Sterile

    Non-Sterile

    Middle East Compounding Chemotherapy by Technology

    With Robotic Arms

    Without Robotic Arms

    Africa Outlook (USD Billion, 2018-2030)

    Africa Compounding Chemotherapy by Dose

    Chemotherapeutic

    Non-Chemotherapeutics

    Africa Compounding Chemotherapy by Delivery Method

    Gravimetric Automated Compounding Device

    Volumetric Automated Compounding Device

    Africa Compounding Chemotherapy by Sterility

    Sterile

    Non-Sterile

    Africa Compounding Chemotherapy by Technology

    With Robotic Arms

    Without Robotic Arms

    Latin America Outlook (USD Billion, 2018-2030)

    Latin America Compounding Chemotherapy by Dose

    Chemotherapeutic

    Non-Chemotherapeutics

    Latin America Compounding Chemotherapy by Delivery Method

    Gravimetric Automated Compounding Device

    Volumetric Automated Compounding Device

    Latin America Compounding Chemotherapy by Sterility

    Sterile

    Non-Sterile

    Latin America Compounding Chemotherapy by Technology

    With Robotic Arms

    Without Robotic Arms

    Infographic

    Free Sample Request

    Kindly complete the form below to receive a free sample of this Report

    Get Free Sample

    Customer Strories

    “I am very pleased with how market segments have been defined in a relevant way for my purposes (such as "Portable Freezers & refrigerators" and "last-mile"). In general the report is well structured. Thanks very much for your efforts.”

    Victoria Milne

    Founder
    Case Study
    Chemicals and Materials