Segmentation Quick Reference
| Dimension | Sub-Segments | Dominant Segment | Fastest Growing Segment |
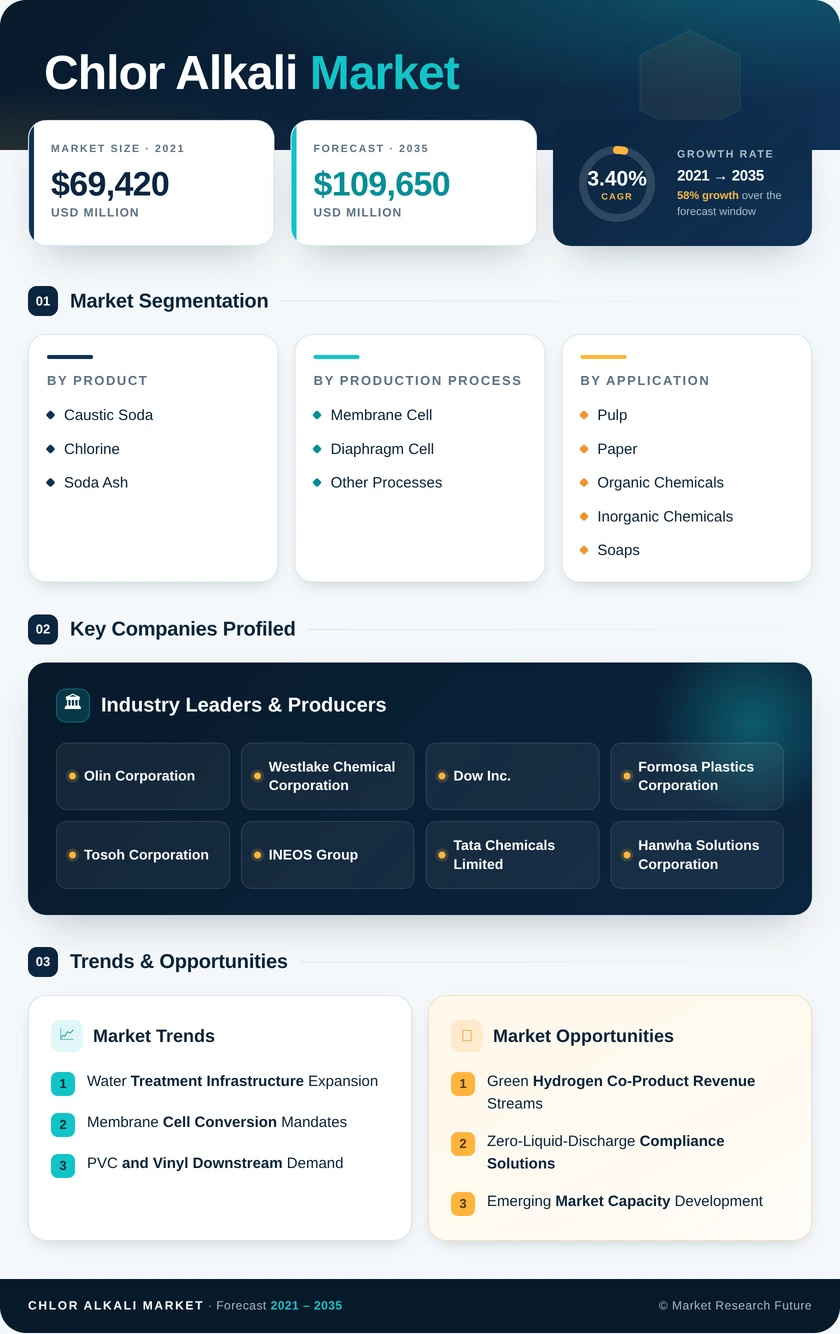
| By Product | Caustic Soda, Chlorine, Soda Ash | Chlorine | Caustic Soda |
| By Production Process | Membrane Cell, Diaphragm Cell, Other Processes | Membrane Cell | Membrane Cell |
| By Application | Pulp and Paper, Organic Chemicals, Inorganic Chemicals, Soaps and Detergents, Alumina, Others | Pulp and Paper | Organic Chemicals |
| By Geography | Asia-Pacific, North America, Europe, South America, the Middle East & Africa | Asia-Pacific | Asia-Pacific |
Market Segmentation Overview
By Product
| Sub-Segment | Key Trend |
| Caustic Soda | Fastest-growing product segment, driven by alumina refining and textile processing demand |
| Chlorine | Largest share, sustained by water treatment and PVC production chains |
| Soda Ash | Stable demand from glass manufacturing and synthetic detergent formulations |
The product segmentation reflects the co-production economics inherent in chlor-alkali electrolysis. Chlorine and caustic soda are produced simultaneously in fixed electrochemical ratios, creating pricing interdependence that distinguishes this market from most commodity chemical sectors.
By Production Process
| Sub-Segment | Key Trend |
| Membrane Cell | Dominant and growing; 30–35% energy efficiency advantage over legacy cells |
| Diaphragm Cell | Declining share; concentrated in North American legacy installations |
| Other Processes | Includes mercury cells (being phased out) and emerging ODC technology |
Membrane cell technology continues to gain ground as environmental regulations and energy economics force the retirement of older production methods. The technology also enables higher product purity, supporting specialty-grade applications in semiconductors and pharmaceuticals.
By Application
| Sub-Segment | Key Trend |
| Pulp and Paper | Largest application; elemental chlorine-free bleaching sustains chemical demand |
| Organic Chemicals | Fastest growth; PVC and epichlorohydrin demand drives chlorine consumption |
| Inorganic Chemicals | Stable; sodium hypochlorite and hydrochloric acid production |
| Soaps and Detergents | Moderate growth; caustic soda for saponification processes |
| Alumina | High-growth niche; Bayer process refining expansions in Asia and Oceania |
| Others | Includes water treatment, food processing, and pharmaceutical applications |
Application diversity provides the chlor-alkali industry with resilience against single-sector downturns, as demand is distributed across construction, pulp/paper, metals, water infrastructure, and consumer goods verticals.
By Geography
| Sub-Segment | Key Trend |
| Asia-Pacific | Dominant region with over half of global capacity; China and India drive growth |
| North America | Mature but competitive; low energy costs and integrated chemical complexes |
| Europe | Regulatory-driven transformation; mercury and diaphragm cell phase-outs |
| South America | Brazil-centric; pulp/paper and petrochemical demand anchor consumption |
| Middle East & Africa | Fastest CAGR; feedstock gas cost advantage attracts greenfield investment |
Geographic segmentation highlights the ongoing eastward shift of global chlor-alkali capacity, with Asia-Pacific accounting for the majority of new plant construction. At the same time, Western markets focus on modernization and efficiency upgrades.