Request Free Sample ×

Kindly complete the form below to receive a free sample of this Report

* Please use a valid business email

Leading companies partner with us for data-driven Insights

clients tt-cursor
Hero Background

China Plasma Fractionation Market

ID: MRFR/HC/47618-HCR
200 Pages
Vikita Thakur
Last Updated: April 06, 2026

China Plasma Fractionation Market Research Report By Product Type (Immunoglobulin, Albumin, Coagulation Factors, Protease Inhibitors), By Application (Neurology, Hematology, General Medicine, Immunology), By End User (Hospitals, Ambulatory Surgical Centers, Blood Banks, Pharmaceutical Companies) and By Technology (Centrifugation, Chromatography, Precipitation, Filtration) -Forecast to 2035

Share:
Download PDF ×

We do not share your information with anyone. However, we may send you emails based on your report interest from time to time. You may contact us at any time to opt-out.

China Plasma Fractionation Market Infographic
Purchase Options
  1. 1 SECTION I: EXECUTIVE SUMMARY AND KEY HIGHLIGHTS
    1. 1.1 EXECUTIVE SUMMARY
      1. 1.1.1 Market Overview
      2. 1.1.2 Key Findings
      3. 1.1.3 Market Segmentation
      4. 1.1.4 Competitive Landscape
      5. 1.1.5 Challenges and Opportunities
      6. 1.1.6 Future Outlook
  2. 2 SECTION II: SCOPING, METHODOLOGY AND MARKET STRUCTURE
    1. 2.1 MARKET INTRODUCTION
      1. 2.1.1 Definition
      2. 2.1.2 Scope of the study
        1. 2.1.2.1 Research Objective
        2. 2.1.2.2 Assumption
        3. 2.1.2.3 Limitations
    2. 2.2 RESEARCH METHODOLOGY
      1. 2.2.1 Overview
      2. 2.2.2 Data Mining
      3. 2.2.3 Secondary Research
      4. 2.2.4 Primary Research
        1. 2.2.4.1 Primary Interviews and Information Gathering Process
        2. 2.2.4.2 Breakdown of Primary Respondents
      5. 2.2.5 Forecasting Model
      6. 2.2.6 Market Size Estimation
        1. 2.2.6.1 Bottom-Up Approach
        2. 2.2.6.2 Top-Down Approach
      7. 2.2.7 Data Triangulation
      8. 2.2.8 Validation
  3. 3 SECTION III: QUALITATIVE ANALYSIS
    1. 3.1 MARKET DYNAMICS
      1. 3.1.1 Overview
      2. 3.1.2 Drivers
      3. 3.1.3 Restraints
      4. 3.1.4 Opportunities
    2. 3.2 MARKET FACTOR ANALYSIS
      1. 3.2.1 Value chain Analysis
      2. 3.2.2 Porter's Five Forces Analysis
        1. 3.2.2.1 Bargaining Power of Suppliers
        2. 3.2.2.2 Bargaining Power of Buyers
        3. 3.2.2.3 Threat of New Entrants
        4. 3.2.2.4 Threat of Substitutes
        5. 3.2.2.5 Intensity of Rivalry
      3. 3.2.3 COVID-19 Impact Analysis
        1. 3.2.3.1 Market Impact Analysis
        2. 3.2.3.2 Regional Impact
        3. 3.2.3.3 Opportunity and Threat Analysis
  4. 4 SECTION IV: QUANTITATIVE ANALYSIS
    1. 4.1 Life Sciences, BY Application (USD Million)
      1. 4.1.1 Neurology
      2. 4.1.2 Hematology
      3. 4.1.3 General Medicine
      4. 4.1.4 Immunology
    2. 4.2 Life Sciences, BY Product Type (USD Million)
      1. 4.2.1 Immunoglobulin
      2. 4.2.2 Albumin
      3. 4.2.3 Coagulation Factors
      4. 4.2.4 Protease Inhibitors
    3. 4.3 Life Sciences, BY End User (USD Million)
      1. 4.3.1 Hospitals
      2. 4.3.2 Ambulatory Surgical Centers
      3. 4.3.3 Blood Banks
      4. 4.3.4 Pharmaceutical Companies
    4. 4.4 Life Sciences, BY Technology (USD Million)
      1. 4.4.1 Centrifugation
      2. 4.4.2 Chromatography
      3. 4.4.3 Precipitation
      4. 4.4.4 Filtration
  5. 5 SECTION V: COMPETITIVE ANALYSIS
    1. 5.1 Competitive Landscape
      1. 5.1.1 Overview
      2. 5.1.2 Competitive Analysis
      3. 5.1.3 Market share Analysis
      4. 5.1.4 Major Growth Strategy in the Life Sciences
      5. 5.1.5 Competitive Benchmarking
      6. 5.1.6 Leading Players in Terms of Number of Developments in the Life Sciences
      7. 5.1.7 Key developments and growth strategies
        1. 5.1.7.1 New Product Launch/Service Deployment
        2. 5.1.7.2 Merger & Acquisitions
        3. 5.1.7.3 Joint Ventures
      8. 5.1.8 Major Players Financial Matrix
        1. 5.1.8.1 Sales and Operating Income
        2. 5.1.8.2 Major Players R&D Expenditure. 2023
    2. 5.2 Company Profiles
      1. 5.2.1 Grifols (ES)
        1. 5.2.1.1 Financial Overview
        2. 5.2.1.2 Products Offered
        3. 5.2.1.3 Key Developments
        4. 5.2.1.4 SWOT Analysis
        5. 5.2.1.5 Key Strategies
      2. 5.2.2 CSL Behring (AU)
        1. 5.2.2.1 Financial Overview
        2. 5.2.2.2 Products Offered
        3. 5.2.2.3 Key Developments
        4. 5.2.2.4 SWOT Analysis
        5. 5.2.2.5 Key Strategies
      3. 5.2.3 Takeda Pharmaceutical Company (JP)
        1. 5.2.3.1 Financial Overview
        2. 5.2.3.2 Products Offered
        3. 5.2.3.3 Key Developments
        4. 5.2.3.4 SWOT Analysis
        5. 5.2.3.5 Key Strategies
      4. 5.2.4 Octapharma (CH)
        1. 5.2.4.1 Financial Overview
        2. 5.2.4.2 Products Offered
        3. 5.2.4.3 Key Developments
        4. 5.2.4.4 SWOT Analysis
        5. 5.2.4.5 Key Strategies
      5. 5.2.5 Kedrion (IT)
        1. 5.2.5.1 Financial Overview
        2. 5.2.5.2 Products Offered
        3. 5.2.5.3 Key Developments
        4. 5.2.5.4 SWOT Analysis
        5. 5.2.5.5 Key Strategies
      6. 5.2.6 Biotest AG (DE)
        1. 5.2.6.1 Financial Overview
        2. 5.2.6.2 Products Offered
        3. 5.2.6.3 Key Developments
        4. 5.2.6.4 SWOT Analysis
        5. 5.2.6.5 Key Strategies
      7. 5.2.7 LFB Group (FR)
        1. 5.2.7.1 Financial Overview
        2. 5.2.7.2 Products Offered
        3. 5.2.7.3 Key Developments
        4. 5.2.7.4 SWOT Analysis
        5. 5.2.7.5 Key Strategies
      8. 5.2.8 Sangamo Therapeutics (US)
        1. 5.2.8.1 Financial Overview
        2. 5.2.8.2 Products Offered
        3. 5.2.8.3 Key Developments
        4. 5.2.8.4 SWOT Analysis
        5. 5.2.8.5 Key Strategies
      9. 5.2.9 Emergent BioSolutions (US)
        1. 5.2.9.1 Financial Overview
        2. 5.2.9.2 Products Offered
        3. 5.2.9.3 Key Developments
        4. 5.2.9.4 SWOT Analysis
        5. 5.2.9.5 Key Strategies
    3. 5.3 Appendix
      1. 5.3.1 References
      2. 5.3.2 Related Reports
  6. 6 LIST OF FIGURES
    1. 6.1 MARKET SYNOPSIS
    2. 6.2 CHINA MARKET ANALYSIS BY APPLICATION
    3. 6.3 CHINA MARKET ANALYSIS BY PRODUCT TYPE
    4. 6.4 CHINA MARKET ANALYSIS BY END USER
    5. 6.5 CHINA MARKET ANALYSIS BY TECHNOLOGY
    6. 6.6 KEY BUYING CRITERIA OF LIFE SCIENCES
    7. 6.7 RESEARCH PROCESS OF MRFR
    8. 6.8 DRO ANALYSIS OF LIFE SCIENCES
    9. 6.9 DRIVERS IMPACT ANALYSIS: LIFE SCIENCES
    10. 6.10 RESTRAINTS IMPACT ANALYSIS: LIFE SCIENCES
    11. 6.11 SUPPLY / VALUE CHAIN: LIFE SCIENCES
    12. 6.12 LIFE SCIENCES, BY APPLICATION, 2024 (% SHARE)
    13. 6.13 LIFE SCIENCES, BY APPLICATION, 2024 TO 2035 (USD Million)
    14. 6.14 LIFE SCIENCES, BY PRODUCT TYPE, 2024 (% SHARE)
    15. 6.15 LIFE SCIENCES, BY PRODUCT TYPE, 2024 TO 2035 (USD Million)
    16. 6.16 LIFE SCIENCES, BY END USER, 2024 (% SHARE)
    17. 6.17 LIFE SCIENCES, BY END USER, 2024 TO 2035 (USD Million)
    18. 6.18 LIFE SCIENCES, BY TECHNOLOGY, 2024 (% SHARE)
    19. 6.19 LIFE SCIENCES, BY TECHNOLOGY, 2024 TO 2035 (USD Million)
    20. 6.20 BENCHMARKING OF MAJOR COMPETITORS
  7. 7 LIST OF TABLES
    1. 7.1 LIST OF ASSUMPTIONS
  8. 7.1.1
    1. 7.2 China MARKET SIZE ESTIMATES; FORECAST
      1. 7.2.1 BY APPLICATION, 2025-2035 (USD Million)
      2. 7.2.2 BY PRODUCT TYPE, 2025-2035 (USD Million)
      3. 7.2.3 BY END USER, 2025-2035 (USD Million)
      4. 7.2.4 BY TECHNOLOGY, 2025-2035 (USD Million)
    2. 7.3 PRODUCT LAUNCH/PRODUCT DEVELOPMENT/APPROVAL
  9. 7.3.1
    1. 7.4 ACQUISITION/PARTNERSHIP
  10. 7.4.1

China Life Sciences Market Segmentation

Life Sciences By Application (USD Million, 2025-2035)
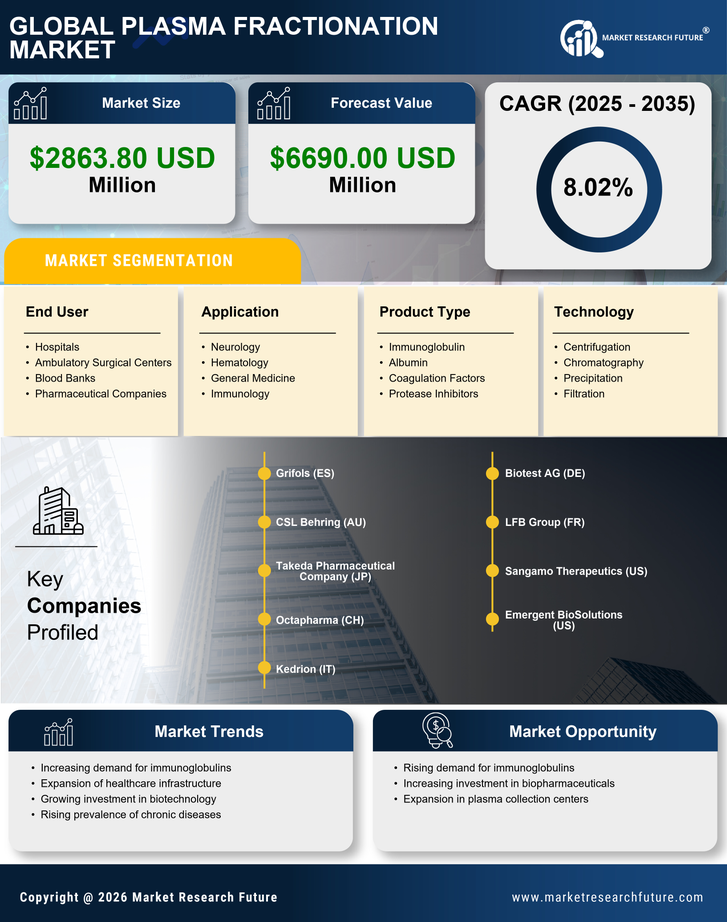
  • Neurology
  • Hematology
  • General Medicine
  • Immunology

Life Sciences By Product Type (USD Million, 2025-2035)

  • Immunoglobulin
  • Albumin
  • Coagulation Factors
  • Protease Inhibitors

Life Sciences By End User (USD Million, 2025-2035)

  • Hospitals
  • Ambulatory Surgical Centers
  • Blood Banks
  • Pharmaceutical Companies

Life Sciences By Technology (USD Million, 2025-2035)

  • Centrifugation
  • Chromatography
  • Precipitation
  • Filtration

Compare Licence

×
Features License Type
Single User Multiuser License Enterprise User
Price $4,950 $5,950 $7,250
Maximum User Access Limit 1 User Upto 10 Users Unrestricted Access Throughout the Organization
Free Customization
Direct Access to Analyst
Deliverable Format
Platform Access
Discount on Next Purchase 10% 15% 15%
Printable Versions