

China Security, Access Control and Robotics Market Segmentation
Security, Access Control and Robotics By Procedure (USD Million, 2025-2035)
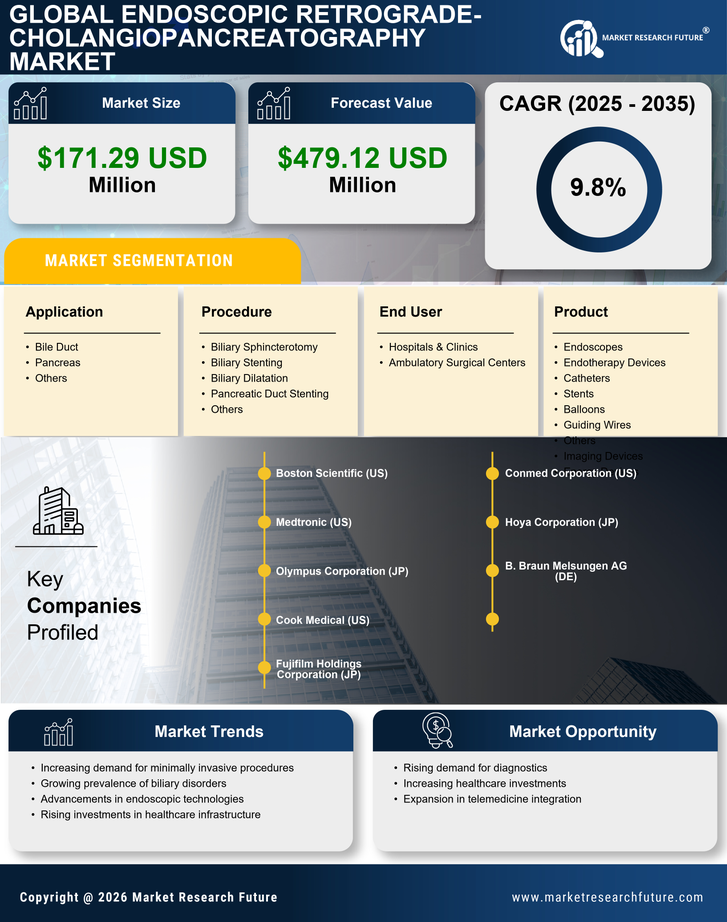
- Biliary Sphincterotomy
- Biliary Stenting
- Biliary Dilatation
- Pancreatic Duct Stenting
- Others
Security, Access Control and Robotics By End User (USD Million, 2025-2035)
- Hospitals & Clinics
- Ambulatory Surgical Centers
Security, Access Control and Robotics By Application (USD Million, 2025-2035)
- Bile Duct
- Pancreas
- Others
Security, Access Control and Robotics By Product (USD Million, 2025-2035)
- Endoscopes
- Endotherapy Devices
- Catheters
- Stents
- Balloons
- Guiding Wires
- Others
- Imaging Devices
- Energy Devices


