China China Electric Vehicle (EV) Insurance Market Segmentation
China Electric Vehicle (EV) Insurance Market By Coverage (USD Billion, 2025-2035)
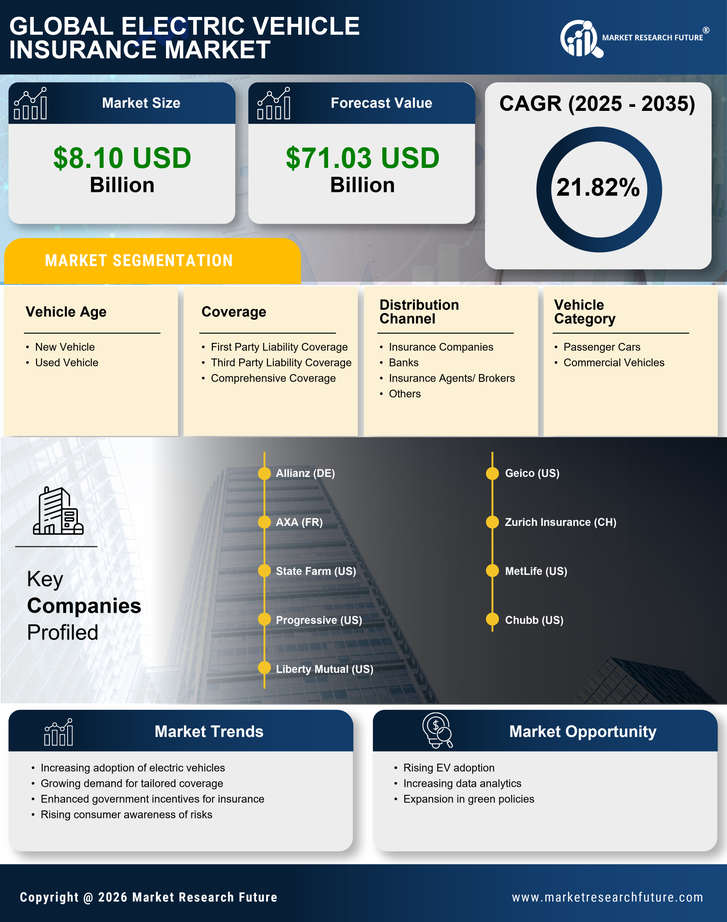
- First Party Liability Coverage
- Third Party Liability Coverage
- Comprehensive Coverage
China Electric Vehicle (EV) Insurance Market By Distribution Channel (USD Billion, 2025-2035)
- Insurance Companies
- Banks
- Insurance Agents/ Brokers
- Others
China Electric Vehicle (EV) Insurance Market By Vehicle Age (USD Billion, 2025-2035)
- New Vehicle
- Used Vehicle
China Electric Vehicle (EV) Insurance Market By Vehicle Category (USD Billion, 2025-2035)
- Passenger Cars
- Commercial Vehicles
China Electric Vehicle (EV) Insurance Market By EV Propulsion (USD Billion, 2025-2035)
- Battery Operated
- Hybrid