ID: MRFR/AGR/5324-HCR | February 2021 | Region: Global | 90 pages
Market Scenario:
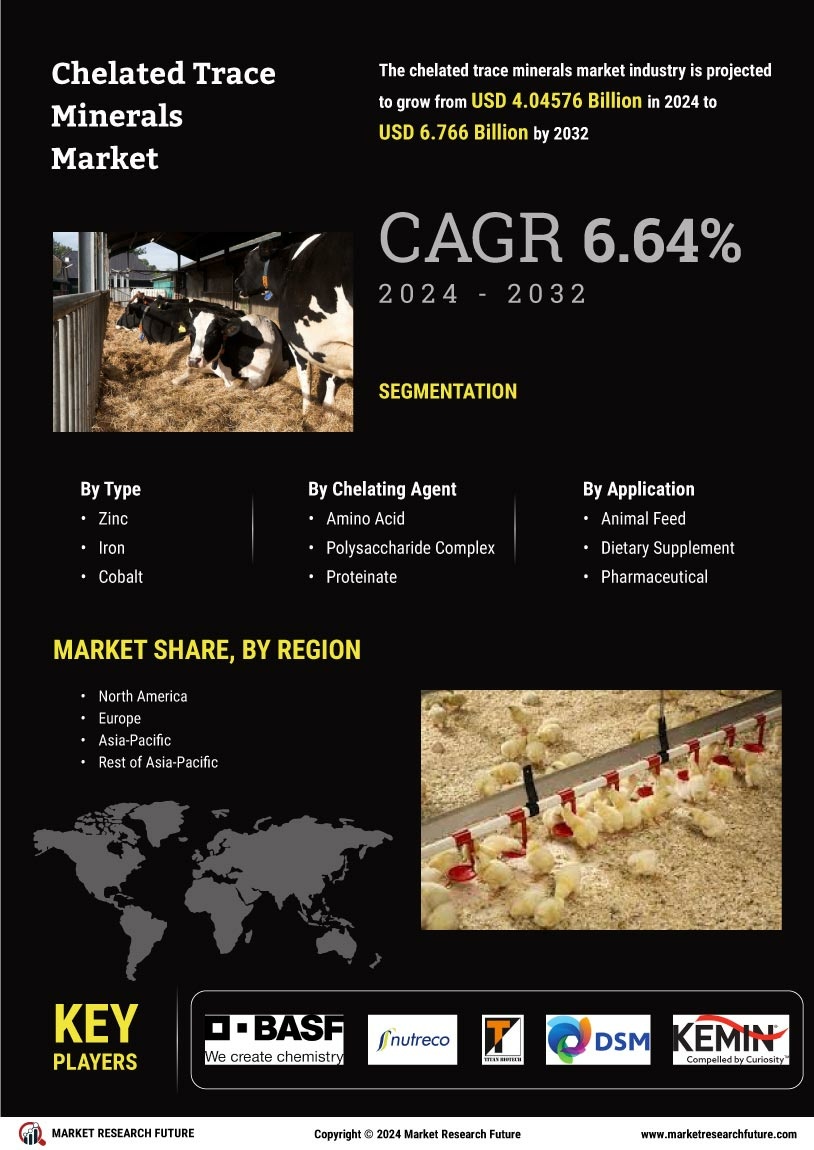
Chelated trace minerals in feed are also known as organic trace minerals used in feed. These are required in small quantities but play an important role in the growth and performance enhancement of the animals. The chelation of the trace minerals increases the availability of these nutrients to animals and helps in easy absorption increasing the performance of the livestock. The increasing awareness among the consumers regarding the benefits of chelated trace minerals have boosted the demand for these trace minerals.
Segmentation:
The global chelated trace minerals market in feed has been segmented based on type, form, chelate type, livestock, and region.
By type, the global chelated trace minerals market in feed has been classified as Zinc, Iron, Cobalt, Copper, and others.
On the basis of form, the global chelated trace minerals market in feed has been divided into dry and liquid.
The global chelated trace minerals market in feed is also segmented on the basis of the chelate type used as amino acids, proteinates, polysaccharide complexes, and others.
The global chelated trace minerals market in feed has also been segregated, on the basis of livestock, into ruminant, swine, poultry, aquaculture, and others.
The global chelated trace minerals market in feed has been studied with regard to four key regions—North America, Europe, Asia-Pacific, and the rest of the world.
The North American chelated trace minerals market in feed has further been segmented into the US, Canada, and Mexico. The European chelated trace minerals market in feed has been classified as the UK, Germany, France, Italy, Spain, and the rest of Europe. The chelated trace minerals market in feed in Asia-Pacific has been divided into China, India, Japan, Australia and New Zealand, and the rest of Asia-Pacific. The chelated trace minerals market in feed in the rest of the world has been segmented into South America, the Middle East, and Africa.
Key Players:
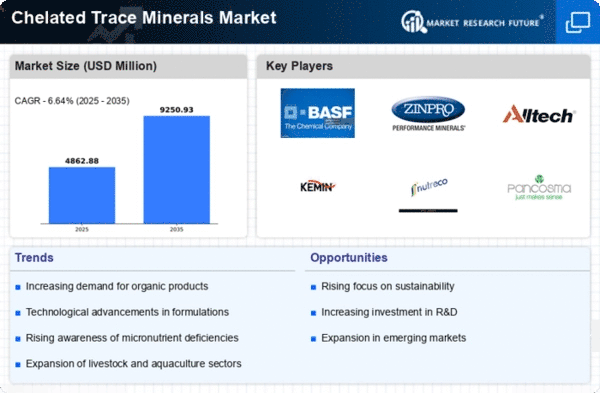
Archer Daniels Midland Company (US), Cargill, Incorporated (US), BASF SE (Germany), Kemin Industries (US), Koninklijke DSM N.V. (The Netherlands), Nutreco N.V. (The Netherlands), DLG Group (Denmark), InVivo NSA (France), Bluestar Adisseo (China), Alltech (US), are some of the key players in the global chelated trace minerals market in feed.
Regional Market Summary
Source: Secondary Sources and MRFR Analysis
Europe is expected to dominate the market for chelated trace minerals market in feed during the forecast period owing to the increasing demand for more nutritious animal feed products. High awareness and food safety regulation, and high demand for high quality animal-based products has driven in Europe. North American market for chelated trace minerals is growing at a significant rate. The US is the major contributors to the growth of the North American chelated trace minerals market in feed. China being one of the largest feed producers is contributing a major share in the Asia-Pacific market. The need for production of high-quality meat is driving the demand across the globe.
Global Chelated Trace Minerals Market in Feed Market, by Type
Global Chelated Trace Minerals Market in Feed Market, by Form
Global Chelated Trace Minerals Market in Feed Market, by Chelate Type
Global Chelated Trace Minerals Market in Feed Market, by Livestock
Global Chelated Trace Minerals Market in Feed Market, by Region
Intended Audience
Frequently Asked Questions (FAQ) :
Augmenting demand for animal protein and increasing awareness regarding the benefits of these minerals in animal feed, are the major tailwinds pushing the growth of the global chelated trace minerals market.
Higher cost and lack of knowledge about the benefits that these minerals, are major growth impeders for the global chelated trace minerals market.
Europe holds the largest share in the global chelated trace minerals market, followed by North America and the Asia Pacific, respectively.
Kemin Industries (US), Nutreco N.V. (The Netherlands), Bluestar Adisseo (China), Archer Daniels Midland Company (US), Koninklijke DSM N.V. (The Netherlands), Alltech (US), DLG Group (Denmark), Cargill, Incorporated (US), InVivo NSA (France), and BASF SE (Germany), are some of the top players operating in the global chelated trace minerals market.
Strategic initiatives such as mergers & acquisitions, collaborations, expansion, and technology/ product launch are some of the growth strategies that players operating in the global chelated trace minerals market adopt to gain a larger competitive advantage.
TABLE OF CONTENTS
1 Executive Summary
2 Scope of the Report
2.1 Market Definition
2.2 Scope of the Study
2.2.1 Research Objectives
2.2.2 Assumptions & Limitations
2.3 Market Structure
3 Market Research Methodology
3.1 Research Process
3.2 Secondary Research
3.3 Primary Research
3.4 Forecast Model
4 Market Landscape
4.1 Supply Chain Analysis
4.2 Porter’s Five Forces Analysis
4.2.1 Threat of New Entrants
4.2.2 Bargaining Power of Buyers
4.2.3 Bargaining Power of Suppliers
4.2.4 Threat of Substitutes
4.2.5 Internal Rivalry
5 Market Dynamics of Global Chelated Trace Minerals Market in Feed
5.1 Introduction
5.2 Drivers
5.3 Restraints
5.4 Opportunities
5.5 Challenges
6. Global Chelated Trace Minerals Market in Feed, by Type
6.1 Introduction
6.2 Zinc
6.2.1 Market Estimates & Forecast, 2018–2023
6.2.2 Market Estimates & Forecast, by Region, 2018–2023
6.3 Iron
6.3.1 Market Estimates & Forecast, 2018–2023
6.3.2 Market Estimates & Forecast, by Region, 2018–2023
6.4 Cobalt
6.4.1 Market Estimates & Forecast, 2018–2023
6.4.2 Market Estimates & Forecast, by Region, 2018–2023
6.5 Copper
6.5.1 Market Estimates & Forecast, 2018–2023
6.5.2 Market Estimates & Forecast, by Region, 2018–2023
6.6 Others
6.6.1 Market Estimates & Forecast, 2018–2023
6.6.2 Market Estimates & Forecast, by Region, 2018–2023
7. Global Chelated Trace Minerals Market in Feed, by Form
7.1 Introduction
7.2 Dry
7.2.1 Market Estimates & Forecast, 2018–2023
7.2.2 Market Estimates & Forecast, by Region, 2018–2023
7.3 Liquid
7.3.1 Market Estimates & Forecast, 2018–2023
7.3.2 Market Estimates & Forecast, by Region, 2018–2023
8. Global Chelated Trace Minerals Market in Feed, by Chelate Type
8.1 Introduction
8.2 Amino Acids
8.2.1 Market Estimates & Forecast, 2018–2023
8.2.2 Market Estimates & Forecast, by Region, 2018–2023
8.3 Proteinates
8.3.1 Market Estimates & Forecast, 2018–2023
8.3.2 Market Estimates & Forecast, by Region, 2018–2023
8.4 Polysaccharide Complexes
8.4.1 Market Estimates & Forecast, 2018–2023
8.4.2 Market Estimates & Forecast, by Region, 2018–2023
8.5 Others
8.5.1 Market Estimates & Forecast, 2018–2023
8.5.2 Market Estimates & Forecast, by Region, 2018–2023
9. Global Chelated Trace Minerals Market in Feed, by Livestock
9.1 Introduction
9.2 Ruminant
9.2.1 Market Estimates & Forecast, 2018–2023
9.2.2 Market Estimates & Forecast, by Region, 2018–2023
9.3 Swine
9.3.1 Market Estimates & Forecast, 2018–2023
9.3.2 Market Estimates & Forecast, by Region, 2018–2023
9.4 Poultry
9.4.1 Market Estimates & Forecast, 2018–2023
9.4.2 Market Estimates & Forecast, by Region, 2018–2023
9.5 Aquaculture
9.5.1 Market Estimates & Forecast, 2018–2023
9.5.2 Market Estimates & Forecast, by Region, 2018–2023
9.5 Others
9.5.1 Market Estimates & Forecast, 2018–2023
9.5.2 Market Estimates & Forecast, by Region, 2018–2023
10. Global Chelated Trace Minerals Market in Feed, by Region
10.1 Introduction
10.2 North America
10.2.1 Market Estimates & Forecast, 2018–2023
10.2.2 Market Estimates & Forecast, by Type, 2018–2023
10.2.3 Market Estimates & Forecast, by Form, 2018–2023
10.2.4 Market Estimates & Forecast, by Chelate Type, 2018–2023
10.2.5 Market Estimates & Forecast, by Livestock, 2018–2023
10.2.6 US
10.2.6.1 Market Estimates & Forecast, 2018–2023
10.2.6.2 Market Estimates & Forecast, by Type, 2018–2023
10.2.6.3 Market Estimates & Forecast, by Form, 2018–2023
10.2.6.4 Market Estimates & Forecast, by Chelate Type, 2018–2023
10.2.6.5 Market Estimates & Forecast, by Livestock, 2018–2023
10.2.7 Canada
10.2.7.1 Market Estimates & Forecast, 2018–2023
10.2.7.2 Market Estimates & Forecast, by Type, 2018–2023
10.2.7.3 Market Estimates & Forecast, by Form, 2018–2023
10.2.7.4 Market Estimates & Forecast, by Chelate Type, 2018–2023
10.2.7.5 Market Estimates & Forecast, by Livestock, 2018–2023
10.2.8 Mexico
10.2.8.1 Market Estimates & Forecast, 2018–2023
10.2.8.2 Market Estimates & Forecast, by Type, 2018–2023
10.2.8.3 Market Estimates & Forecast, by Form, 2018–2023
10.2.8.4 Market Estimates & Forecast, by Chelate Type, 2018–2023
10.2.8.5 Market Estimates & Forecast, by Livestock, 2018–2023
10.3 Europe
10.3.1 Market Estimates & Forecast, 2018–2023
10.3.2 Market Estimates & Forecast, by Type, 2018–2023
10.3.3 Market Estimates & Forecast, by Form, 2018–2023
10.3.4 Market Estimates & Forecast, by Chelate Type, 2018–2023
10.3.5 Market Estimates & Forecast, by Livestock, 2018–2023
10.3.6 Germany
10.3.6.1 Market Estimates & Forecast, 2018–2023
10.3.6.2 Market Estimates & Forecast, by Type, 2018–2023
10.3.6.3 Market Estimates & Forecast, by Form, 2018–2023
10.3.6.4 Market Estimates & Forecast, by Chelate Type, 2018–2023
10.3.6.5 Market Estimates & Forecast, by Livestock, 2018–2023
10.3.7 France
10.3.7.1 Market Estimates & Forecast, 2018–2023
10.3.7.2 Market Estimates & Forecast, by Type, 2018–2023
10.3.7.3 Market Estimates & Forecast, by Form, 2018–2023
10.3.7.4 Market Estimates & Forecast, by Chelate Type, 2018–2023
10.3.7.5 Market Estimates & Forecast, by Livestock, 2018–2023
10.3.8 Italy
10.3.8.1 Market Estimates & Forecast, 2018–2023
10.3.8.2 Market Estimates & Forecast, by Type, 2018–2023
10.3.8.3 Market Estimates & Forecast, by Form, 2018–2023
10.3.8.4 Market Estimates & Forecast, by Chelate Type, 2018–2023
10.3.8.5 Market Estimates & Forecast, by Livestock, 2018–2023
10.3.9 Spain
10.3.9.1 Market Estimates & Forecast, 2018–2023
10.3.9.2 Market Estimates & Forecast, by Type, 2018–2023
10.3.9.3 Market Estimates & Forecast, by Form, 2018–2023
10.3.9.4 Market Estimates & Forecast, by Chelate Type, 2018–2023
10.3.9.5 Market Estimates & Forecast, by Livestock, 2018–2023
10.3.10 UK
10.3.10.1 Market Estimates & Forecast, 2018–2023
10.3.10.2 Market Estimates & Forecast, by Type, 2018–2023
10.3.10.3 Market Estimates & Forecast, by Form, 2018–2023
10.3.10.4 Market Estimates & Forecast, by Chelate Type, 2018–2023
10.3.10.5 Market Estimates & Forecast, by Livestock, 2018–2023
10.3.11 Rest of Europe
10.3.11.1 Market Estimates & Forecast, 2018–2023
10.3.11.2 Market Estimates & Forecast, by Type, 2018–2023
10.3.11.3 Market Estimates & Forecast, by Form, 2018–2023
10.3.11.4 Market Estimates & Forecast, by Chelate Type, 2018–2023
10.3.11.5 Market Estimates & Forecast, by Livestock, 2018–2023
10.4 Asia-Pacific
10.4.1 Market Estimates & Forecast, 2018–2023
10.4.2 Market Estimates & Forecast, by Type, 2018–2023
10.4.3 Market Estimates & Forecast, by Form, 2018–2023
10.4.4 Market Estimates & Forecast, by Chelate Type, 2018–2023
10.4.5 Market Estimates & Forecast, by Livestock, 2018–2023
10.4.6 China
10.4.6.1 Market Estimates & Forecast, 2018–2023
10.4.6.2 Market Estimates & Forecast, by Type, 2018–2023
10.4.6.3 Market Estimates & Forecast, by Form, 2018–2023
10.4.6.4 Market Estimates & Forecast, by Chelate Type, 2018–2023
10.4.6.5 Market Estimates & Forecast, by Livestock, 2018–2023
10.4.7 India
10.4.7.1 Market Estimates & Forecast, 2018–2023
10.4.7.2 Market Estimates & Forecast, by Type, 2018–2023
10.4.7.3 Market Estimates & Forecast, by Form, 2018–2023
10.4.7.4 Market Estimates & Forecast, by Chelate Type, 2018–2023
10.4.7.5 Market Estimates & Forecast, by Livestock, 2018–2023
10.4.8 Japan
10.4.8.1 Market Estimates & Forecast, 2018–2023
10.4.8.2 Market Estimates & Forecast, by Type, 2018–2023
10.4.8.3 Market Estimates & Forecast, by Form, 2018–2023
10.4.8.4 Market Estimates & Forecast, by Chelate Type, 2018–2023
10.4.8.5 Market Estimates & Forecast, by Livestock, 2018–2023
10.4.9 Australia & New Zealand
10.4.8.1 Market Estimates & Forecast, 2018–2023
10.4.9.2 Market Estimates & Forecast, by Type, 2018–2023
10.4.9.3 Market Estimates & Forecast, by Form, 2018–2023
10.4.9.4 Market Estimates & Forecast, by Chelate Type, 2018–2023
10.4.9.5 Market Estimates & Forecast, by Livestock, 2018–2023
10.4.10 Rest of Asia-Pacific
10.4.9.1 Market Estimates & Forecast, 2018–2023
10.4.10.2 Market Estimates & Forecast, by Type, 2018–2023
10.4.10.3 Market Estimates & Forecast, by Form, 2018–2023
10.4.10.4 Market Estimates & Forecast, by Chelate Type, 2018–2023
10.4.10.5 Market Estimates & Forecast, by Livestock, 2018–2023
10.5 Rest of the World (RoW)
10.5.1 Market Estimates & Forecast, 2018–2023
10.5.2 Market Estimates & Forecast, by Type, 2018–2023
10.5.3 Market Estimates & Forecast, by Form, 2018–2023
10.5.4 Market Estimates & Forecast, by Chelate Type, 2018–2023
10.5.5 Market Estimates & Forecast, by Livestock, 2018–2023
10.5.6 South America
10.5.6.1 Market Estimates & Forecast, 2018–2023
10.5.6.2 Market Estimates & Forecast, by Type, 2018–2023
10.5.6.3 Market Estimates & Forecast, by Form, 2018–2023
10.5.6.4 Market Estimates & Forecast, by Chelate Type, 2018–2023
10.5.6.5 Market Estimates & Forecast, by Livestock, 2018–2023
10.5.7 The Middle East
10.5.7.1 Market Estimates & Forecast, 2018–2023
10.5.7.2 Market Estimates & Forecast, by Type, 2018–2023
10.5.7.3 Market Estimates & Forecast, by Form, 2018–2023
10.5.7.4 Market Estimates & Forecast, by Chelate Type, 2018–2023
10.5.7.5 Market Estimates & Forecast, by Livestock, 2018–2023
10.5.8 Africa
10.5.8.1 Market Estimates & Forecast, 2018–2023
10.5.8.2 Market Estimates & Forecast, by Type, 2018–2023
10.5.8.3 Market Estimates & Forecast, by Form, 2018–2023
10.5.8.4 Market Estimates & Forecast, by Chelate Type, 2018–2023
10.5.8.5 Market Estimates & Forecast, by Livestock, 2018–2023
11. Company Landscape
11.1 Introduction
11.2 Market Strategy
11.3 Key Development Analysis
(Expansions/ Mergers and Acquisitions/ Joint Ventures/ New Product Developments/ Agreements/ Investments
12. Company Profiles
12.1 Archer Daniels Midland Company
12.1.1 Company Overview
12.1.2 Financial Updates
12.1.3 Product/Business Segment Overview
12.1.4 Strategy
12.1.5 Key Developments
12.1.6 SWOT Analysis
12.2 Cargill, Incorporated
12.2.1 Company Overview
12.2.2 Financial Updates
12.2.3 Product/Business Segment Overview
12.2.4 Strategy
12.2.5 Key Developments
12.2.6 SWOT Analysis
12.3 BASF SE
12.3.1 Company Overview
12.3.2 Financial Updates
12.3.3 Product/Business Segment Overview
12.3.4 Strategy
12.3.5 Key Developments
12.3.6 SWOT Analysis
12.4 Kemin Industries
12.4.1 Company Overview
12.4.2 Financial Updates
12.4.3 Product/Business Segment Overview
12.4.4 Strategy
12.4.5 Key Developments
12.4.6 SWOT Analysis
12.5 Koninklijke DSM N.V.
12.5.1 Company Overview
12.5.2 Financial Updates
12.5.3 Product/Business Segment Overview
12.5.4 Strategy
12.5.5 Key Developments
12.5.6 SWOT Analysis
12.6 Nutreco N.V.
12.6.1 Company Overview
12.6.2 Financial Updates
12.6.3 Product/Business Segment Overview
12.6.4 Strategy
12.6.5 Key Developments
12.6.6 SWOT Analysis
12.7 DLG Group
12.7.1 Company Overview
12.7.2 Financial Updates
12.7.3 Product/Business Segment Overview
12.7.4 Strategy
12.7.5 Key Developments
12.7.6 SWOT Analysis
12.8 Invivo NSA
12.8.1 Company Overview
12.8.2 Financial Updates
12.8.3 Product/Business Segment Overview
12.8.4 Strategy
12.8.5 Key Developments
12.8.6 SWOT Analysis
12.9 Bluestar Adisseo
12.9.1 Company Overview
12.9.2 Financial Updates
12.9.3 Product/Business Segment Overview
12.9.4 Strategy
12.9.5 Key Developments
12.9.6 SWOT Analysis
12.10 Alltech
12.10.1 Company Overview
12.10.2 Financial Updates
12.10.3 Product/Business Segment Overview
12.10.4 Strategy
12.10.5 Key Developments
12.10.6 SWOT Analysis
13. Conclusion
LIST OF TABLES
Table 1 Global Chelated Trace Minerals Market in Feed, by Region, 2018–2023 (USD Million)
Table 2 Global Chelated Trace Minerals Market in Feed, by Type, 2018–2023 (USD Million)
Table 3 Global Chelated Trace Minerals Market in Feed, by Form, 2018–2023 (USD Million)
Table 4 Global Chelated Trace Minerals Market in Feed, by Chelate Type, 2018–2023 (USD Million)
Table 5 Global Chelated Trace Minerals Market in Feed, by Livestock, 2018–2023 (USD Million)
Table 6 North America: Chelated Trace Minerals Market in Feed, by Country, 2018–2023 (USD Million)
Table 7 North America: Chelated Trace Minerals Market in Feed, by Type, 2018–2023 (USD Million)
Table 8 North America: Chelated Trace Minerals Market in Feed, by Form, 2018–2023 (USD Million)
Table 9 North America: Chelated Trace Minerals Market in Feed, by Chelate Type, 2018–2023 (USD Million)
Table 10 North America: Chelated Trace Minerals Market in Feed, by Livestock, 2018–2023 (USD Million)
Table 11 US: Chelated Trace Minerals Market in Feed, by Type, 2018–2023 (USD Million)
Table 12 US: Chelated Trace Minerals Market in Feed, by Form, 2018–2023 (USD Million)
Table 13 US: Chelated Trace Minerals Market in Feed, by Chelate Type, 2018–2023 (USD Million)
Table 14 US: Chelated Trace Minerals Market in Feed, by Chelate Livestock, 2018–2023 (USD Million)
Table 15 Canada: Chelated Trace Minerals Market in Feed, by Type, 2018–2023 (USD Million)
Table 16 Canada: Chelated Trace Minerals Market in Feed, by Form, 2018–2023 (USD Million)
Table 17 Canada: Chelated Trace Minerals Market in Feed, by Chelate Type, 2018–2023 (USD Million)
Table 18 Canada: Chelated Trace Minerals Market in Feed, by Livestock, 2018–2023 (USD Million)
Table 19 Mexico: Chelated Trace Minerals Market in Feed, by Type, 2018–2023 (USD Million)
Table 20 Mexico: Chelated Trace Minerals Market in Feed, by Form, 2018–2023 (USD Million)
Table 21 Mexico: Chelated Trace Minerals Market in Feed, by Chelate Type, 2018–2023 (USD Million)
Table 22 Mexico: Chelated Trace Minerals Market in Feed, by Livestock, 2018–2023 (USD Million)
Table 23 Europe: Chelated Trace Minerals Market in Feed, by Country, 2018–2023 (USD Million)
Table 24 Europe: Chelated Trace Minerals Market in Feed, by Type, 2018–2023 (USD Million)
Table 25 Europe: Chelated Trace Minerals Market in Feed, by Form, 2018–2023 (USD Million)
Table 26 Europe: Chelated Trace Minerals Market in Feed, by Chelate Type, 2018–2023 (USD Million)
Table 27 Europe: Chelated Trace Minerals Market in Feed, by Livestock, 2018–2023 (USD Million)
Table 28 Germany: Chelated Trace Minerals Market in Feed, by Type, 2018–2023 (USD Million)
Table 29 Germany: Chelated Trace Minerals Market in Feed, by Form, 2018–2023 (USD Million)
Table 30 Germany: Chelated Trace Minerals Market in Feed, by Chelate Type, 2018–2023 (USD Million)
Table 31 Germany: Chelated Trace Minerals Market in Feed, by Livestock, 2018–2023 (USD Million)
Table 32 France: Chelated Trace Minerals Market in Feed, by Type, 2018–2023 (USD Million)
Table 33 France: Chelated Trace Minerals Market in Feed, by Form, 2018–2023 (USD Million)
Table 34 France: Chelated Trace Minerals Market in Feed, by Chelate Type, 2018–2023 (USD Million)
Table 35 France: Chelated Trace Minerals Market in Feed, by Livestock, 2018–2023 (USD Million)
Table 36 Italy: Chelated Trace Minerals Market in Feed, by Type, 2018–2023 (USD Million)
Table 37 Italy: Chelated Trace Minerals Market in Feed, by Form, 2018–2023 (USD Million)
Table 38 Italy: Chelated Trace Minerals Market in Feed, by Chelate Type, 2018–2023 (USD Million)
Table 39 Italy: Chelated Trace Minerals Market in Feed, by Livestock, 2018–2023 (USD Million)
Table 40 Spain: Chelated Trace Minerals Market in Feed, by Type, 2018–2023 (USD Million)
Table 41 Spain: Chelated Trace Minerals Market in Feed, by Form, 2018–2023 (USD Million)
Table 42 Spain: Chelated Trace Minerals Market in Feed, by Chelate Type, 2018–2023 (USD Million)
Table 43 Spain: Chelated Trace Minerals Market in Feed, by Livestock, 2018–2023 (USD Million)
Table 44 UK: Chelated Trace Minerals Market in Feed, by Type, 2018–2023 (USD Million)
Table 45 UK: Chelated Trace Minerals Market in Feed, by Form, 2018–2023 (USD Million)
Table 46 UK: Chelated Trace Minerals Market in Feed, by Chelate Type, 2018–2023 (USD Million)
Table 47 UK: Chelated Trace Minerals Market in Feed, by Livestock, 2018–2023 (USD Million)
Table 48 Rest of Europe: Chelated Trace Minerals Market in Feed, by Type, 2018–2023 (USD Million)
Table 49 Rest of Europe: Chelated Trace Minerals Market in Feed, by Form, 2018–2023 (USD Million)
Table 50 Rest of Europe: Chelated Trace Minerals Market in Feed, by Chelate Type, 2018–2023 (USD Million)
Table 51 Rest of Europe: Chelated Trace Minerals Market in Feed, by Livestock, 2018–2023 (USD Million)
Table 52 Asia-Pacific: Chelated Trace Minerals Market in Feed, by Country, 2018–2023 (USD Million)
Table 53 Asia-Pacific: Chelated Trace Minerals Market in Feed, by Type, 2018–2023 (USD Million)
Table 54 Asia-Pacific: Chelated Trace Minerals Market in Feed, by Form, 2018–2023 (USD Million)
Table 55 Asia-Pacific: Chelated Trace Minerals Market in Feed, by Chelate Type, 2018–2023 (USD Million)
Table 56 Asia-Pacific: Chelated Trace Minerals Market in Feed, by Livestock, 2018–2023 (USD Million)
Table 57 China: Chelated Trace Minerals Market in Feed, by Type, 2018–2023 (USD Million)
Table 58 China: Chelated Trace Minerals Market in Feed, by Form, 2018–2023 (USD Million)
Table 59 China: Chelated Trace Minerals Market in Feed, by Chelate Type, 2018–2023 (USD Million)
Table 60 China: Chelated Trace Minerals Market in Feed, by Livestock, 2018–2023 (USD Million)
Table 61 India: Chelated Trace Minerals Market in Feed, by Type, 2018–2023 (USD Million)
Table 62 India: Chelated Trace Minerals Market in Feed, by Form, 2018–2023 (USD Million)
Table 63 India: Chelated Trace Minerals Market in Feed, by Chelate Type, 2018–2023 (USD Million)
Table 64 India: Chelated Trace Minerals Market in Feed, by Livestock, 2018–2023 (USD Million)
Table 61 Japan: Chelated Trace Minerals Market in Feed, by Type, 2018–2023 (USD Million)
Table 62 Japan: Chelated Trace Minerals Market in Feed, by Form, 2018–2023 (USD Million)
Table 63 Japan: Chelated Trace Minerals Market in Feed, by Chelate Type, 2018–2023 (USD Million)
Table 64 Japan: Chelated Trace Minerals Market in Feed, by Livestock, 2018–2023 (USD Million)
Table 65 Australia and New Zealand: Chelated Trace Minerals Market in Feed, by Type, 2018–2023 (USD Million)
Table 66 Australia and New Zealand: Chelated Trace Minerals Market in Feed, by Form, 2018–2023 (USD Million)
Table 67 Australia and New Zealand: Chelated Trace Minerals Market in Feed, by Chelate Type, 2018–2023 (USD Million)
Table 68 Australia and New Zealand: Chelated Trace Minerals Market in Feed, by Livestock, 2018–2023 (USD Million)
Table 69 Rest of Asia-Pacific: Chelated Trace Minerals Market in Feed, by Type, 2018–2023 (USD Million)
Table 70 Rest of Asia-Pacific: Chelated Trace Minerals Market in Feed, by Form, 2018–2023 (USD Million)
Table 71 Rest of Asia-Pacific: Chelated Trace Minerals Market in Feed, by Chelate Type, 2018–2023 (USD Million)
Table 72 Rest of Asia-Pacific: Chelated Trace Minerals Market in Feed, by Livestock, 2018–2023 (USD Million)
Table 73 Rest of the World (RoW): Chelated Trace Minerals Market in Feed, by Country, 2018–2023 (USD Million)
Table 74 Rest of the World (RoW): Chelated Trace Minerals Market in Feed, by Type, 2018–2023 (USD Million)
Table 75 Rest of the World (RoW): Chelated Trace Minerals Market in Feed, by Form, 2018–2023 (USD Million)
Table 76 Rest of the World (RoW): Chelated Trace Minerals Market in Feed, by Chelate Type, 2018–2023 (USD Million)
Table 77 Rest of the World (RoW): Chelated Trace Minerals Market in Feed, by Livestock, 2018–2023 (USD Million)
Table 78 South America: Chelated Trace Minerals Market in Feed, by Type, 2018–2023 (USD Million)
Table 79 South America: Chelated Trace Minerals Market in Feed, by Form, 2018–2023 (USD Million)
Table 80 South America: Chelated Trace Minerals Market in Feed, by Chelate Type, 2018–2023 (USD Million)
Table 81 South America: Chelated Trace Minerals Market in Feed, by Livestock, 2018–2023 (USD Million)
Table 82 Middle East: Chelated Trace Minerals Market in Feed, by Type, 2018–2023 (USD Million)
Table 83 Middle East: Chelated Trace Minerals Market in Feed, by Form, 2018–2023 (USD Million)
Table 84 Middle East: Chelated Trace Minerals Market in Feed, by Chelate Type, 2018–2023 (USD Million)
Table 85 Middle East: Chelated Trace Minerals Market in Feed, by Livestock, 2018–2023 (USD Million)
Table 86 Africa: Chelated Trace Minerals Market in Feed, by Type, 2018–2023 (USD Million)
Table 87 Africa: Chelated Trace Minerals Market in Feed, by Form, 2018–2023 (USD Million)
Table 88 Africa: Chelated Trace Minerals Market in Feed, by Chelate Type, 2018–2023 (USD Million)
Table 89 Middle East: Chelated Trace Minerals Market in Feed, by Livestock, 2018–2023 (USD Million)
LIST OF FIGURES
FIGURE 1 Global Chelated Trace Minerals Market in Feed Segmentation
FIGURE 2 Forecast Research Methodology
FIGURE 3 Five Forces Analysis of Global Chelated Trace Minerals Market in Feed
FIGURE 4 Value Chain of Global Chelated Trace Minerals Market in Feed
FIGURE 5 Share of Global Chelated Trace Minerals Market in Feed in 2018, by Country (%)
FIGURE 6 Global Chelated Trace Minerals Market in Feed, by Region, 2018–2023,
FIGURE 7 Global Chelated Trace Minerals Market in Feed Size, by Type, 2018
FIGURE 8 Share of Global Chelated Trace Minerals Market in Feed, by Type, 2018–2023 (%)
FIGURE 9 Global Chelated Trace Minerals Market in Feed Size, by Form, 2018
FIGURE 10 Share of Global Chelated Trace Minerals Market in Feed, by Form, 2018–2023 (%)
FIGURE 11 Global Chelated Trace Minerals Market in Feed Size, by Chelate Type, 2018
FIGURE 12 Share of Global Chelated Trace Minerals Market in Feed, by Chelate Type, 2018–2023 (%)
FIGURE 13 Global Chelated Trace Minerals Market in Feed Size, by Livestock, 2018
FIGURE 14 Share of Global Chelated Trace Minerals Market in Feed, by Livestock, 2018–2023 (%)