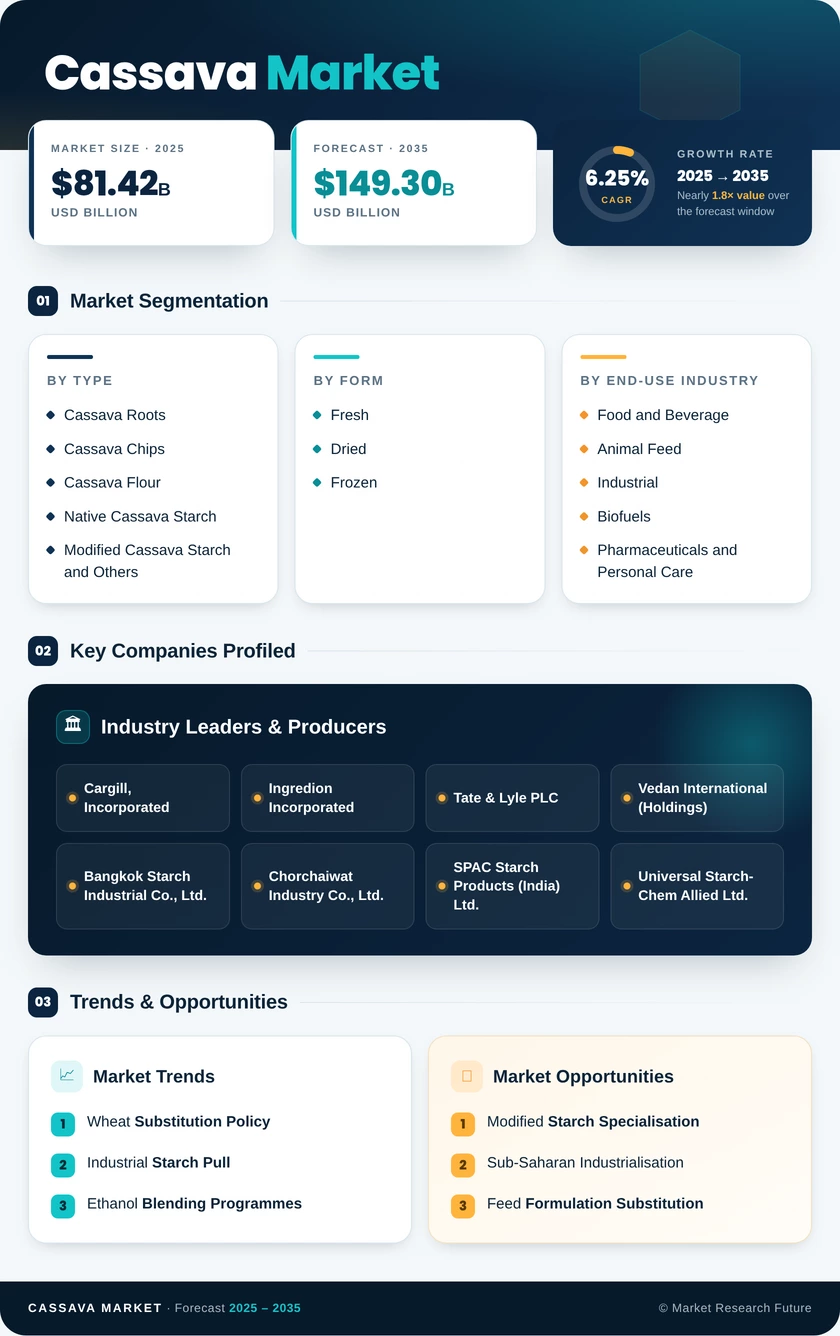
Cassava Market (2026 - 2035)

Cassava Market Size, Share, Industry Trend & Analysis Research Report Information By Product Type (Cassava Roots, Cassava Chips, Cassava Flour, Native Cassava Starch, Modified Cassava Starch, Others), By Form (Fresh, Dried, Frozen), By End-Use Industry (Food and Beverage, Animal Feed, Industrial, Biofuels, Pharmaceuticals and Personal Care), By Geography (North America, Europe, Asia-Pacific, South America, Middle East & Africa) – Forecast Till 2035

Forecast Period
2026-2035
CAGR
6.25%
2025 Market Size
USD 81.42 Billion
2035 Market Size
USD 149.30 Billion
Food, Beverages & Nutrition ● Updated August 31, 2026 Report ID: MRFR/FnB/3208-CR | Pages: 110 | Author: Tejas Chaudhary
  1. 1 Market Summary |
    1. 1.1 Study Assumptions & Market Definition |
    2. 1.2 Scope of the Study |
    3. 1.3 Research Methodology
  2. 2 Key Report Takeaways |
    1. 2.1 By Product Type |
    2. 2.2 By End-Use Industry |
    3. 2.3 By Geography
  3. 3 Market Size & Forecast (2021–2035) |
    1. 3.1 Historical Market Size (2021–2024) |
    2. 3.2 Base Year Assessment (2025) |
    3. 3.3 Forecast Market Size (2026–2035) |
    4. 3.4 Year-over-Year Growth Analysis
  4. 4 Driver Impact Analysis |
    1. 4.1 Wheat Substitution Policy |
    2. 4.2 Industrial Starch Pull |
    3. 4.3 Ethanol Blending Programmes |
    4. 4.4 Processing Capital and Yield Recovery
  5. 5 Restraints Impact Analysis |
    1. 5.1 Perishability and Aggregation |
    2. 5.2 Disease Pressure |
    3. 5.3 Safety and Compliance Thresholds
  6. 6 Opportunities |
    1. 6.1 Modified Starch Specialisation |
    2. 6.2 Sub-Saharan Industrialisation |
    3. 6.3 Feed Formulation Substitution |
    4. 6.4 Traceability and Data Monetisation |
    5. 6.5 Bioplastics and Fermentation Feedstock |
    6. 6.6 Industry Value Chain Analysis |
    7. 6.7 Porter's Five Forces Analysis
  7. 7 Regional Market Share & Country-Level Analysis |
    1. 7.1 North America | |
      1. 7.1.1 US | |
      2. 7.1.2 Canada | |
      3. 7.1.3 Mexico |
    2. 7.2 Europe | |
      1. 7.2.1 Germany | |
      2. 7.2.2 UK | |
      3. 7.2.3 France | |
      4. 7.2.4 Italy | |
      5. 7.2.5 Spain | |
      6. 7.2.6 Nordic Countries | |
      7. 7.2.7 Russia | |
      8. 7.2.8 Rest of Europe |
    3. 7.3 Asia-Pacific | |
      1. 7.3.1 China | |
      2. 7.3.2 India | |
      3. 7.3.3 Japan | |
      4. 7.3.4 South Korea | |
      5. 7.3.5 ASEAN | |
      6. 7.3.6 Rest of Asia-Pacific |
    4. 7.4 South America | |
      1. 7.4.1 Brazil | |
      2. 7.4.2 Argentina | |
      3. 7.4.3 Rest of South America |
    5. 7.5 Middle East & Africa | |
      1. 7.5.1 Saudi Arabia | |
      2. 7.5.2 UAE | |
      3. 7.5.3 South Africa | |
      4. 7.5.4 Egypt | |
      5. 7.5.5 Rest of Middle East & Africa
  8. 8 Future Outlook (2026–2035) |
    1. 8.1 Mechanisation and Precision Agronomy |
    2. 8.2 Vertical Integration Economics |
    3. 8.3 Bioenergy Coupling |
    4. 8.4 Sustainability Disclosure
  9. 9 Market Segmentation Analysis |
    1. 9.1 By Product Type | |
      1. 9.1.1 Cassava Roots | |
      2. 9.1.2 Cassava Chips | |
      3. 9.1.3 Cassava Flour | |
      4. 9.1.4 Native Cassava Starch | |
      5. 9.1.5 Modified Cassava Starch and Others |
    2. 9.2 By Form | |
      1. 9.2.1 Fresh | |
      2. 9.2.2 Dried | |
      3. 9.2.3 Frozen |
    3. 9.3 By End-Use Industry | |
      1. 9.3.1 Food and Beverage | |
      2. 9.3.2 Animal Feed | |
      3. 9.3.3 Industrial | |
      4. 9.3.4 Biofuels | |
      5. 9.3.5 Pharmaceuticals and Personal Care
  10. 10 Competitive Landscape |
    1. 10.1 Market Concentration Analysis |
    2. 10.2 Competitive Benchmarking Matrix |
    3. 10.3 Company Profiles | |
      1. 10.3.1 Cargill, Incorporated | |
      2. 10.3.2 Ingredion Incorporated | |
      3. 10.3.3 Tate & Lyle PLC | |
      4. 10.3.4 Thai Wah Public Company Limited | |
      5. 10.3.5 Vedan International (Holdings) | |
      6. 10.3.6 Bangkok Starch Industrial Co., Ltd. | |
      7. 10.3.7 Chorchaiwat Industry Co., Ltd. | |
      8. 10.3.8 SPAC Starch Products (India) Ltd. | |
      9. 10.3.9 Psaltry International Company Ltd. | |
      10. 10.3.10 Universal Starch-Chem Allied Ltd. | |
      11. 10.3.11 Sonish Starch Technology Co., Ltd.
  11. 11 Recent News & Developments
  12. 12 Report Scope & Methodology |
    1. 12.1 Study Period & Base Year |
    2. 12.2 Data Sources & Validation |
    3. 12.3 Abbreviations
  13. 13 Detailed Sources & Citations
  14. 14 Frequently Asked Questions
  15. 15 LIST OF TABLES |
  16. TABLE 1 Global Cassava Market Size & Forecast, by Revenue (USD Billion), 2021–2035 |
  17. TABLE 2 Global Cassava Market – Year-over-Year Growth Analysis, 2021–2035 |
  18. TABLE 3 Driver Impact Analysis – Global Cassava Market |
  19. TABLE 4 Restraint Impact Analysis – Global Cassava Market |
  20. TABLE 5 Global Cassava Market Size, by Region, 2021–2035 (USD Billion) |
  21. TABLE 6 North America Cassava Market Size, by Country, 2021–2035 (USD Billion) |
  22. TABLE 7 Europe Cassava Market Size, by Country, 2021–2035 (USD Billion) |
  23. TABLE 8 Asia-Pacific Cassava Market Size, by Country, 2021–2035 (USD Billion) |
  24. TABLE 9 South America Cassava Market Size, by Country, 2021–2035 (USD Billion) |
  25. TABLE 10 Middle East & Africa Cassava Market Size, by Country, 2021–2035 (USD Billion) |
  26. TABLE 11 Global Cassava Market Size, by Product Type, 2021–2035 (USD Billion) |
  27. TABLE 12 Global Cassava Market Size, by Form, 2021–2035 (USD Billion) |
  28. TABLE 13 Global Cassava Market Size, by End-Use Industry, 2021–2035 (USD Billion) |
  29. TABLE 14 North America Cassava Market Size, by Product Type, 2021–2035 (USD Billion) |
  30. TABLE 15 North America Cassava Market Size, by End-Use Industry, 2021–2035 (USD Billion) |
  31. TABLE 16 Europe Cassava Market Size, by Product Type, 2021–2035 (USD Billion) |
  32. TABLE 17 Europe Cassava Market Size, by End-Use Industry, 2021–2035 (USD Billion) |
  33. TABLE 18 Asia-Pacific Cassava Market Size, by Product Type, 2021–2035 (USD Billion) |
  34. TABLE 19 Asia-Pacific Cassava Market Size, by End-Use Industry, 2021–2035 (USD Billion) |
  35. TABLE 20 South America Cassava Market Size, by Product Type, 2021–2035 (USD Billion) |
  36. TABLE 21 Middle East & Africa Cassava Market Size, by Product Type, 2021–2035 (USD Billion) |
  37. TABLE 22 Competitive Benchmarking Matrix – Global Cassava Market, 2026 |
  38. TABLE 23 Company Profiles – Key Players, Global Cassava Market |
  39. TABLE 24 Recent Developments & Strategic Announcements, 2023–2025 |
  40. TABLE 25 Report Scope & Methodology Summary |
  41. TABLE 26 Detailed Sources & Citations Index
  42. 16 LIST OF FIGURES |
  43. FIGURE 1 Global Cassava Market Dynamics – Drivers, Restraints, Opportunities |
  44. FIGURE 2 Industry Value Chain Analysis – Cassava Market |
  45. FIGURE 3 Porter's Five Forces Analysis – Cassava Market |
  46. FIGURE 4 Global Cassava Market Size Trend, 2021–2035 (USD Billion) |
  47. FIGURE 5 Year-over-Year Growth Trajectory, 2022–2035 (%) |
  48. FIGURE 6 Market Share by Product Type, 2025 vs 2035 (%) |
  49. FIGURE 7 Market Share by Form, 2025 vs 2035 (%) |
  50. FIGURE 8 Market Share by End-Use Industry, 2025 vs 2035 (%) |
  51. FIGURE 9 Regional Market Share Distribution, 2025 (%) |
  52. FIGURE 10 Regional CAGR Comparison, 2026–2035 (%) |
  53. FIGURE 11 Country-Level Share within Asia-Pacific, 2025 (%) |
  54. FIGURE 12 Country-Level Share within Middle East & Africa, 2025 (%) |
  55. FIGURE 13 Competitive Landscape – Estimated Revenue Share Bands, 2026 |
  56. FIGURE 14 Strategic Positioning Matrix – Leading Processors |
  57. FIGURE 15 Processing Yield Improvement Curve, Artisanal vs Mechanised

Segmentation Quick Reference

DimensionSub-SegmentsDominant SegmentFastest Growing Segment
By Product TypeCassava Roots; Cassava Chips; Cassava Flour; Native Cassava Starch; Modified Cassava Starch and OthersCassava RootsCassava Flour
By FormFresh; Dried; FrozenFreshFrozen
By End-Use IndustryFood and Beverage; Animal Feed; Industrial; Biofuels; Pharmaceuticals and Personal CareFood and BeverageBiofuels
By GeographyNorth America; Europe; Asia-Pacific; South America; Middle East & AfricaNorth AmericaAsia-Pacific


Market Segmentation Overview

By Product Type

Sub-SegmentKey Trend
Cassava RootsVolume anchor tied to domestic staple consumption; value migrating downstream as processing capacity expands
Cassava ChipsFeed and distillery offtake stabilising producer prices during food-grade demand troughs
Cassava FlourPolicy-driven wheat substitution converging with commercial free-from bakery demand
Native Cassava StarchContract-based industrial supply to paper, textile, and food thickening applications
Modified Cassava Starch and OthersSpecification premiums of 30–60% attracting Southeast Asian capacity investment


Product mix is the clearest indicator of where a producing country sits on the industrialisation curve. Nations exporting mostly roots and chips capture thin margins; those shipping modified derivatives capture several multiples of that value from the same hectare.

By Form

Sub-SegmentKey Trend
FreshConstrained by a 48–72 hour perishability window, keeping trade largely local
DriedBackbone of international trade; drying capacity determines export participation
FrozenExpanding through diaspora retail and foodservice channels in North America and Europe


Form determines geography. Drying and freezing infrastructure is what converts a locally consumed root into a globally traded ingredient, which is why capital allocation in producing regions concentrates on dryers before it reaches anything more sophisticated.

By End-Use Industry

Sub-SegmentKey Trend
Food and BeverageBakery, snacks, and tapioca products sustain the largest demand pool
Animal FeedMaize substitution economics driving structural inclusion in Asian swine and poultry rations
IndustrialPaper, textile, and adhesive converters rewarding batch-to-batch consistency with contract pricing
BiofuelsEthanol blending mandates creating a demand floor that dampens price cycles
Pharmaceuticals and Personal CareExcipient and binder applications commanding the highest quality premiums on modest volume


End-use diversity is the sector's underappreciated strength. When one channel weakens, another absorbs supply — a resilience that pure food-crop markets rarely enjoy and that underpins the forecast confidence expressed throughout this report.


 

Download PDF ×

We do not share your information with anyone. However, we may send you emails based on your report interest from time to time. You may contact us at any time to opt-out.