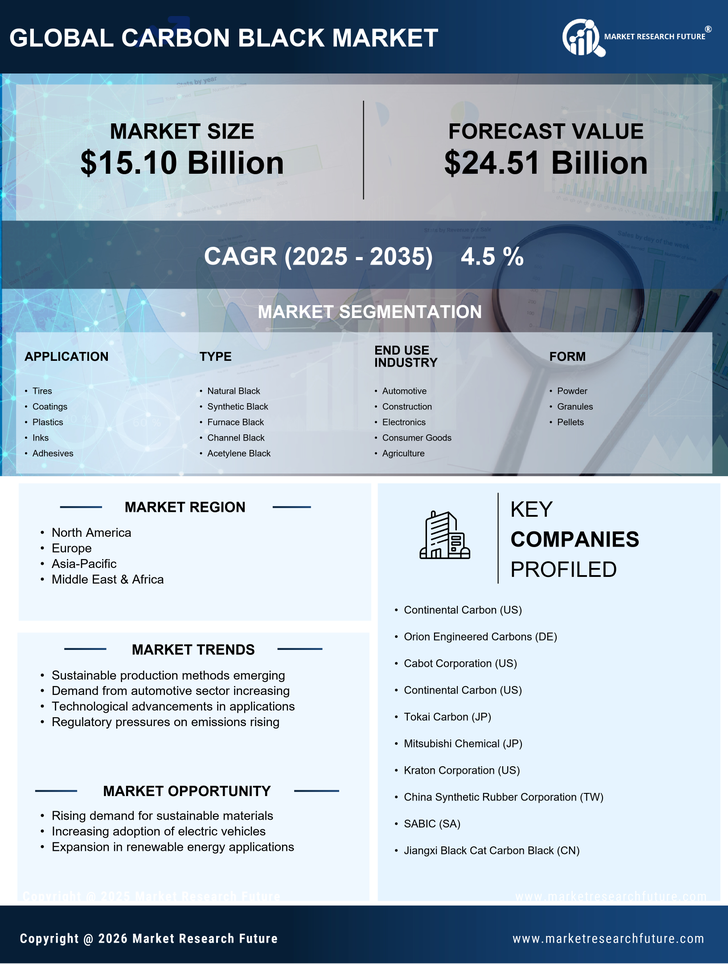
Certified Global Research Member
Isomar fd.webp Wcrc 57.webp
Key Questions Answered
  • Global Market Outlook
  • In-depth analysis of global and regional trends
  • Analyze and identify the major players in the market, their market share, key developments, etc.
  • To understand the capability of the major players based on products offered, financials, and strategies.
  • Identify disrupting products, companies, and trends.
  • To identify opportunities in the market.
  • Analyze the key challenges in the market.
  • Analyze the regional penetration of players, products, and services in the market.
  • Comparison of major players’ financial performance.
  • Evaluate strategies adopted by major players.
  • Recommendations
Why Choose Market Research Future?
  • Vigorous research methodologies for specific market.
  • Knowledge partners across the globe
  • Large network of partner consultants.
  • Ever-increasing/ Escalating data base with quarterly monitoring of various markets
  • Trusted by fortune 500 companies/startups/ universities/organizations
  • Large database of 5000+ markets reports.
  • Effective and prompt pre- and post-sales support.

Carbon Black Market Research Report Information By Process Type (Furnace Black, Channel Black, Thermal Black, Acetylene Black), Function (Reinforcement, Pigments), End-Use (Tire, Non-tire, Paints & Coatings, Inks, Plastics and others) - Forecast to 2027


ID: MRFR/CnM/3280-CR | 134 Pages | Author: Chitranshi Jaiswal| February 2021

Research Methodology on Carbon Black Market


1 Introduction


The research report titled “Carbon Black Market: Global Industry Analysis & Opportunity Assessment 2023-2030” is a study into the market of carbon black as an important raw material in diverse industries.


Carbon black is an industrially produced compound primarily composed of elemental carbon and is an important component of polymer composite materials used in the industries of automotive, construction, electronics, and others. Market Research Future (MRFR) has published a comprehensive study to understand the scope and market size of the global carbon black market. The market report further provides market estimates and forecasts up to 2030.


2 Research Methodology


2.1 Research Objective


The primary research objective of this market report is to present an analysis of the global carbon black market, along with assessing its business perspectives and realistic market sizes. This study also intends to cover SWOT analysis, Porter’s Five Forces Model analysis, regional market analysis, and past, present, and futuristic market scenarios.


2.2 Research Data Collection


A comprehensive literature review including existing research, news articles, industry reports, and government reports are the primary sources of information for the study. Interviews conducted with industry experts and key opinion leaders provide primary data for an accurate and comprehensive understanding of the market. Secondary sources such as periodicals and online databases are also used to confirm the accuracy of the research findings.


2.3 Research Process


The research process involves a detailed study of the global carbon black market to identify the market data, vendors’ landscape, recent developments, emerging trends and market dynamics. Apart from this, a detailed analysis of the value chain of the market is carried out to understand the industry structure and evaluates key market players and the strategies they employ in the industry.


2.4 Research Scope


The scope of the study is to understand and provide information on the global carbon black market and estimate the market size and future market prospects. This research report is revolved around a detailed qualitative and quantitative analysis of the market. The study is geared towards providing insight into the growth opportunities and constraints that exist within the market. A complete overview of the carbon black market including demand and supply analysis is also included.


3 Research Time Frame


The research time frame of the study is from 2023 to 2030. The primary data is collected by interviewing and conducting questionnaires with industry experts, OEMs, and distributors. The investigation of the current market situation is incorporated in the study along with the said forecast period.


4 Research Techniques Used


To gain insights into the global carbon black market, the study uses market research methods such as primary and secondary research. The primary research is conducted by interviewing and conducting questionnaires with industry experts, key opinion leaders, and OEMs. Secondary research involves the analysis of materials such as industry publications, company reports, and secondary sources such as periodicals, and industry databases.


5 Market Segmentation


The global carbon black market is segmented by type, end-user, and region.


a. Global Carbon Black Market by Type


  • Acetylene Black

  • Channel Black

  • Furnace Black

  • Lamp Black

  • Thermal Black


b. Global Carbon Black Market by End-User


  • Automotive

  • Building & Construction

  • Chemicals

  • Electronics & Appliances

  • Plastics

  • Others


c. Global Carbon Black Market by Region


  • North America

  • Europe

  • Asia-Pacific

  • Rest of the World


6 Research Assumptions


The study assumes that:


  • The estimated growth rate of the carbon black market is expected to grow rapidly during the 2023-2030 period.

  • The major revenue source for the market is the automotive industry followed by the building and construction industry.

  • Asia-Pacific is estimated to hold the largest market share of the global carbon black market and has the highest growth rate.

  • Key market players such as Birla Carbon, Cabot Corporation, and Oriental Carbon & Chemicals Ltd. among others possess a significant portion of the global carbon black market share.


7 Conclusion


This research report provides a detailed analysis of the global carbon black market on the basis of various segments, vendors’ analysis, regions, and their relative market sizes. The research also focuses on upcoming trends, technological advancements, and potential opportunities in the market.


The report provides an in-depth market analysis so as to understand the demand and supply dynamics in the market. The report also provides an in-depth assessment of the competitive landscape of the carbon black market, which helps in understanding the key competitors’ strategies. The report can be used by market players, interested stakeholders, and investors to gain insights into the carbon black market and make better decisions in order to remain competitive in the market.

Leading companies partner with us for data-driven Insights
client_1 client_2 client_3 client_4 client_5 client_6 client_7 client_8 client_9 client_10
Please fill in Business Email for Quick Response

1 Executive Summary

2 Market Introduction

2.1 Definition 20

2.2 Scope Of The Study 20

2.3 List Of Assumptions 21

2.4 Market Structure 21

3 Market Insights

3.1 Key Takeaways 23

4 Research Methodology

4.1 Research Process 27

4.2 Primary Research 28

4.3 Secondary Research 29

4.4 Market Size Estimation 29

4.5 Forecast Model 30

5 Market Dynamics

5.1 Introduction 32

5.2 Drivers 33

5.2.1 Increasing Demand From The Tire Industry 33

5.2.2 Widening Applications Scope In Plastics And Paints & Coatings 34

5.2.3 Sanguine Market Outlook For Rubber And Rubber Products Market To Influence The Market Positively 35

5.3 Restraints 36

5.3.1 CAFE Regulations On Rolling Resistance To Replacing Carbon Black By Silica In Tires 36

5.4 Trends & Opportunities 37

5.4.1 Bolstering Automotive Aftermarket & Construction Sector In Emerging Economies 37

5.4.2 Collaboration Among Companies For Product Development 37

6 Market Factor Analysis

6.1 Supply Chain Analysis 39

6.1.1 Raw Material Suppliers 39

6.1.2 Carbon Black Manufacturers 39

6.1.3 Distribution Channel 39

6.1.4 End-User Industry 40

6.2 Porter’s Five Forces Model 40

6.2.1 Threat Of New Entrants 41

6.2.2 Threat Of Rivalry 41

6.2.3 Threat Of Substitutes 41

6.2.4 Bargaining Power Of Supplier 41

6.2.5 Bargaining Power Of Buyer 41

7 Global Carbon Black Market, By Process Type

7.1 Furnace Black Process 44

7.2 Channel Black Process 45

7.3 Thermal Black Process 46

7.4 Acetylene Black Process 47

7.5 Others 48

8 Global Carbon Black Market, By Function

8.1 Reinforcement 52

8.2 Pigment 53

9 Global Carbon Black Market, By Application

9.1 Tire Rubber 57

9.2 Non-Tire Rubber 58

9.3 Paints & Coatings 59

9.4 Inks 60

9.5 Plastics 61

9.6 Others 62

10 Global Carbon Black Market, By Region

10.1 Introduction 65

10.2 North America 69

10.2.1 U.S 72

10.2.2 Canada 75

10.3 Europe 77

10.3.1 Germany 81

10.3.2 Spain 84

10.3.3 France 86

10.3.4 U.K 89

10.3.5 Russia 91

10.3.6 Italy 94

10.3.7 Rest Of Europe 96

10.4 Asia-Pacific 99

10.4.1 China 103

10.4.2 Japan 105

10.4.3 India 108

10.4.4 ASEAN 110

10.4.5 South Korea 113

10.4.6 Rest Of Asia-Pacific 115

10.5 Middle East & Africa 118

10.5.1 GCC 121

10.5.2 South Africa 124

10.5.3 Rest Of Middle East & Africa 126

10.6 Latin America 129

10.6.1 Brazil 132

10.6.2 Mexico 135

10.6.3 Rest Of Latin America 137

11 Competitive Landscape

11.1 Competitive Landscape 141

11.1.1 Introduction 141

11.1.2 Key Development Analysis 141

11.1.3 Global Market Stratagy Analysis 143

12 Company Profiles

12.1 Mitsubishi Chemical Corporation 145

12.1.1 Company Overview 145

12.1.2 Financial Overview 145

12.1.3 Products Offerings 146

12.1.4 Key Developments 146

12.1.5 SWOT Analysis 146

12.1.6 Key Strategy 146

12.2 Cabot Corporation 147

12.2.1 Company Overview 147

12.2.2 Financial Overview 147

12.2.3 Products Offerings 148

12.2.4 Key Developments 149

12.2.5 SWOT Analysis 149

12.2.6 Key Strategy 149

12.3 OCI COMPANY Ltd. 150

12.3.1 Company Overview 150

12.3.2 Financial Overview 150

12.3.3 Products Offerings 151

12.3.4 Key Developments 151

12.3.5 SWOT Analysis 151

12.3.6 Key Strategy 151

12.4 Orion Engineered Carbons 152

12.4.1 Company Overview 152

12.4.2 Financial Overview 152

12.4.3 Products Offerings 153

12.4.4 Key Developments 153

12.4.5 Key Strategy 153

12.5 Phillips Carbon Black Ltd. 154

12.5.1 Company Overview 154

12.5.2 Financial Overview 154

12.5.3 Products Offerings 155

12.5.4 Key Developments 155

12.5.5 SWOT Analysis 156

12.5.6 Key Strategy 156

12.6 Tokai Carbon Co., Ltd. 157

12.6.1 Company Overview 157

12.6.2 Financial Overview 157

12.6.3 Products Offerings 158

12.6.4 Key Developments 158

12.6.5 SWOT Analysis 158

12.6.6 Key Strategy 158

12.7 Longxing Chemical 159

12.7.1 Company Overview 159

12.7.2 Financial Overview 159

12.7.3 Products Offerings 160

12.7.4 Key Developments 160

12.7.5 SWOT Analysis 160

12.7.6 Key Strategy 160

12.8 JINNENG 161

12.8.1 Company Overview 161

12.8.2 Financial Overview 161

12.8.3 Products Offerings 161

12.8.4 Key Developments 162

12.8.5 SWOT Analysis 162

12.8.6 Key Strategy 162

12.9 Himadri Speciality Chemical Ltd 163

12.9.1 Company Overview 163

12.9.2 Financial Overview 163

12.9.3 Products Offerings 164

12.9.4 Key Developments 164

12.9.5 SWOT Analysis 164

12.9.6 Key Strategy 165

12.10 ChemChina 166

12.10.1 Company Overview 166

12.10.2 Financial Overview 166

12.10.3 Products Offerings 166

12.10.4 Key Developments 167

12.10.5 SWOT Analysis 167

12.10.6 Key Strategy 167

12.11 Sid Richardson Carbon And Energy Co. Ltd. 168

12.11.1 Company Overview 168

12.11.2 Financial Overview 168

12.11.3 Products Offerings 168

12.11.4 Key Developments 168

12.11.5 Key Strategy 168

12.12 Kremenchug Carbon Black Plant 169

12.12.1 Company Overview 169

12.12.2 Financial Overview 169

12.12.3 Products Offerings 169

12.12.4 Key Developments 169

12.12.5 Key Strategy 169

12.13 Shandong Huadong Rubber Materials Co., Ltd. 170

12.13.1 Company Overview 170

12.13.2 Financial Overview 170

12.13.3 Products Offerings 170

12.13.4 Key Developments 170

12.13.5 Key Strategy 170

12.14 NIPPON STEEL & SUMIKIN CHEMICAL CO., LTD. 171

12.14.1 Company Overview 171

12.14.2 Financial Overview 171

12.14.3 Products Offerings 171

12.14.4 Key Developments 171

12.14.5 Key Strategy 171

12.15 Shijiazhuang Xinxing Chemical Carbon Co. Ltd. 172

12.15.1 Company Overview 172

12.15.2 Financial Overview 172

12.15.3 Products Offerings 172

12.15.4 Key Developments 172

12.15.5 Key Strategy 172

12.16 Hebei Daguangming Juwuba Carbon Black Co. Ltd. 173

12.16.1 Company Overview 173

12.16.2 Financial Overview 173

12.16.3 Products Offerings 173

12.16.4 Key Developments 173

12.16.5 Key Strategy 173

12.17 Suzhou Baohua Carbon Black Co., Ltd. 174

12.17.1 Company Overview 174

12.17.2 Financial Overview 174

12.17.3 Products Offerings 174

12.17.4 Key Developments 174

12.17.5 Key Strategy 174

12.18 Jiangxi Black Cat Carbon Black Inc., Ltd. 175

12.18.1 Company Overview 175

12.18.2 Financial Overview 175

12.18.3 Products Offerings 175

12.18.4 Key Developments 175

12.18.5 Key Strategy 175

13 Conclusion

14 List Of Tables

TABLE 1 MARKET SYNOPSIS 19

TABLE 2 LIST OF ASSUMPTIONS 22

TABLE 3 GLOBAL CARBON BLACK MARKET, BY PROCESS TYPE, 2020-2027 (USD MILLION) 44

TABLE 4 GLOBAL CARBON BLACK MARKET, BY PROCESS TYPE, 2020-2027 (KILOTONS) 45

TABLE 5 GLOBAL CARBON BLACK MARKET FOR FURNACE BLACK PROCESS, 2020-2027 (USD MILLION) 45

TABLE 6 GLOBAL CARBON BLACK MARKET FOR FURNACE BLACK PROCESS, 2020-2027 (KILOTONS) 46

TABLE 7 GLOBAL CARBON BLACK MARKET FOR CHANNEL BLACK PROCESS, 2020-2027 (USD MILLION) 46

TABLE 8 GLOBAL CARBON BLACK MARKET FOR CHANNEL BLACK PROCESS, 2020-2027 (KILOTONS) 47

TABLE 9 GLOBAL CARBON BLACK MARKET FOR THERMAL BLACK PROCESS, 2020-2027 (USD MILLION) 47

TABLE 10 GLOBAL CARBON BLACK MARKET FOR THERMAL BLACK PROCESS, 2020-2027 (KILOTONS) 48

TABLE 11 GLOBAL CARBON BLACK MARKET FOR ACETYLENE BLACK PROCESS, 2020-2027 (USD MILLION) 48

TABLE 12 GLOBAL CARBON BLACK MARKET FOR ACETYLENE BLACK PROCESS, 2020-2027 (KILOTONS) 49

TABLE 13 GLOBAL CARBON BLACK MARKET FOR OTHER BLACK PROCESS, 2020-2027 (USD MILLION) 49

TABLE 14 GLOBAL CARBON BLACK MARKET FOR OTHER BLACK PROCESS, 2020-2027 (KILOTONS) 50

TABLE 15 GLOBAL CARBON BLACK MARKET, BY FUNCTION, 2020-2027 (USD MILLION) 52

TABLE 16 GLOBAL CARBON BLACK MARKET, BY FUNCTION, 2020-2027 (KILOTONS) 52

TABLE 17 GLOBAL CARBON BLACK MARKET FOR REINFORCEMENT, 2020-2027 (USD MILLION) 53

TABLE 18 GLOBAL CARBON BLACK MARKET FOR REINFORCEMENT, 2020-2027 (KILOTONS) 54

TABLE 19 GLOBAL CARBON BLACK MARKET FOR PIGMENT, 2020-2027 (USD MILLION) 54

TABLE 20 GLOBAL CARBON BLACK MARKET FOR PIGMENT, 2020-2027 (KILOTONS) 55

TABLE 21 GLOBAL CARBON BLACK MARKET, BY APPLICATION, 2020-2027 (USD MILLION) 57

TABLE 22 GLOBAL CARBON BLACK MARKET, BY APPLICATION, 2020-2027 (KILOTONS) 58

TABLE 23 GLOBAL CARBON BLACK MARKET FOR TIRE RUBBER, 2020-2027 (USD MILLION) 58

TABLE 24 GLOBAL CARBON BLACK MARKET FOR TIRE RUBBER, 2020-2027 (KILOTONS) 59

TABLE 25 GLOBAL CARBON BLACK MARKET FOR NON-TIRE RUBBER, 2020-2027 (USD MILLION) 59

TABLE 26 GLOBAL CARBON BLACK MARKET FOR NON-TIRE RUBBER, 2020-2027 (KILOTONS) 60

TABLE 27 GLOBAL CARBON BLACK MARKET FOR PAINTS & COATINGS, 2020-2027 (USD MILLION) 60

TABLE 28 GLOBAL CARBON BLACK MARKET FOR PAINTS & COATINGS, 2020-2027 (KILOTONS) 61

TABLE 29 GLOBAL CARBON BLACK MARKET FOR INKS, 2020-2027 (USD MILLION) 61

TABLE 30 GLOBAL CARBON BLACK MARKET FOR INKS, 2020-2027 (KILOTONS) 62

TABLE 31 GLOBAL CARBON BLACK MARKET FOR PLASTICS, 2020-2027 (USD MILLION) 62

TABLE 32 GLOBAL CARBON BLACK MARKET FOR PLASTICS, 2020-2027 (KILOTONS) 63

TABLE 33 GLOBAL CARBON BLACK MARKET FOR OTHERS, 2020-2027 (USD MILLION) 63

TABLE 34 GLOBAL CARBON BLACK MARKET FOR OTHERS, 2020-2027 (KILOTONS) 64

TABLE 35 GLOBAL CARBON BLACK MARKET, BY REGION, 2020-2027 (USD MILLION) 66

TABLE 36 GLOBAL CARBON BLACK MARKET, BY REGION, 2020-2027 (KILOTONS) 67

TABLE 37 GLOBAL CARBON BLACK MARKET, BY PROCESS TYPE, 2020-2027 (USD MILLION) 67

TABLE 38 GLOBAL CARBON BLACK MARKET, BY PROCESS TYPE, 2020-2027 (KILOTONS) 68

TABLE 39 GLOBAL CARBON BLACK MARKET, BY FUNCTION, 2020-2027 (USD MILLION) 68

TABLE 40 GLOBAL CARBON BLACK MARKET, BY FUNCTION, 2020-2027 (KILOTONS) 68

TABLE 41 GLOBAL CARBON BLACK MARKET, BY APPLICATION, 2020-2027 (USD MILLION) 69

TABLE 42 GLOBAL CARBON BLACK MARKET, BY APPLICATION, 2020-2027 (KILOTONS) 69

TABLE 43 NORTH AMERICA CARBON BLACK MARKET, BY COUNTRY, 2020-2027 (USD MILLION) 70

TABLE 44 NORTH AMERICA CARBON BLACK MARKET, BY COUNTRY, 2020-2027 (KILOTONS) 70

TABLE 45 NORTH AMERICA CARBON BLACK MARKET, BY PROCESS TYPE, 2020-2027 (USD MILLION) 71

TABLE 46 NORTH AMERICA CARBON BLACK MARKET, BY PROCESS TYPE, 2020-2027 (KILOTONS) 71

TABLE 47 NORTH AMERICA CARBON BLACK MARKET, BY FUNCTION, 2020-2027 (USD MILLION) 72

TABLE 48 NORTH AMERICA CARBON BLACK MARKET, BY FUNCTION, 2020-2027 (KILOTONS) 72

TABLE 49 NORTH AMERICA CARBON BLACK MARKET, BY APPLICATION, 2020-2027 (USD MILLION) 72

TABLE 50 NORTH AMERICA CARBON BLACK MARKET, BY APPLICATION, 2020-2027 (KILOTONS) 73

TABLE 51 U.S CARBON BLACK MARKET, BY PROCESS TYPE, 2020-2027 (USD MILLION) 73

TABLE 52 U.S CARBON BLACK MARKET, BY PROCESS TYPE, 2020-2027 (KILOTONS) 74

TABLE 53 U.S CARBON BLACK MARKET, BY FUNCTION, 2020-2027 (USD MILLION) 74

TABLE 54 U.S CARBON BLACK MARKET, BY FUNCTION, 2020-2027 (KILOTONS) 74

TABLE 55 U.S CARBON BLACK MARKET, BY APPLICATION, 2020-2027 (USD MILLION) 75

TABLE 56 U.S CARBON BLACK MARKET, BY APPLICATION, 2020-2027 (KILOTONS) 75

TABLE 57 CANADA CARBON BLACK MARKET, BY PROCESS TYPE, 2020-2027 (USD MILLION) 76

TABLE 58 CANADA CARBON BLACK MARKET, BY PROCESS TYPE, 2020-2027 (KILOTONS) 76

TABLE 59 CANADA CARBON BLACK MARKET, BY FUNCTION, 2020-2027 (USD MILLION) 77

TABLE 60 CANADA CARBON BLACK MARKET, BY FUNCTION, 2020-2027 (KILOTONS) 77

TABLE 61 CANADA CARBON BLACK MARKET, BY APPLICATION, 2020-2027 (USD MILLION) 77

TABLE 62 CANADA CARBON BLACK MARKET, BY APPLICATION, 2020-2027 (KILOTONS) 78

TABLE 63 EUROPE CARBON BLACK MARKET, BY COUNTRY, 2020-2027 (USD MILLION) 79

TABLE 64 EUROPE CARBON BLACK MARKET, BY COUNTRY, 2020-2027 (KILOTONS) 79

TABLE 65 EUROPE CARBON BLACK MARKET, BY PROCESS TYPE, 2020-2027 (USD MILLION) 80

TABLE 66 EUROPE CARBON BLACK MARKET, BY PROCESS TYPE, 2020-2027 (KILOTONS) 80

TABLE 67 EUROPE CARBON BLACK MARKET, BY FUNCTION, 2020-2027 (USD MILLION) 80

TABLE 68 EUROPE CARBON BLACK MARKET, BY FUNCTION, 2020-2027 (KILOTONS) 81

TABLE 69 EUROPE CARBON BLACK MARKET, BY APPLICATION, 2020-2027 (USD MILLION) 81

TABLE 70 EUROPE CARBON BLACK MARKET, BY APPLICATION, 2020-2027 (KILOTONS) 82

TABLE 71 GERMANY CARBON BLACK MARKET, BY PROCESS TYPE, 2020-2027 (USD MILLION) 82

TABLE 72 GERMANY CARBON BLACK MARKET, BY PROCESS TYPE, 2020-2027 (KILOTONS) 83

TABLE 73 GERMANY CARBON BLACK MARKET, BY FUNCTION, 2020-2027 (USD MILLION) 83

TABLE 74 GLOBAL CARBON BLACK MARKET, BY FUNCTION, 2020-2027 (KILOTONS) 83

TABLE 75 GERMANY CARBON BLACK MARKET, BY APPLICATION, 2020-2027 (USD MILLION) 84

TABLE 76 GERMANY CARBON BLACK MARKET, BY APPLICATION, 2020-2027 (KILOTONS) 84

TABLE 77 SPAIN CARBON BLACK MARKET, BY PROCESS TYPE, 2020-2027 (USD MILLION) 85

TABLE 78 SPAIN CARBON BLACK MARKET, BY PROCESS TYPE, 2020-2027 (KILOTONS) 85

TABLE 79 SPAIN CARBON BLACK MARKET, BY FUNCTION, 2020-2027 (USD MILLION) 86

TABLE 80 SPAIN CARBON BLACK MARKET, BY FUNCTION, 2020-2027 (KILOTONS) 86

TABLE 81 SPAIN CARBON BLACK MARKET, BY APPLICATION, 2020-2027 (USD MILLION) 86

TABLE 82 SPAIN CARBON BLACK MARKET, BY APPLICATION, 2020-2027 (KILOTONS) 87

TABLE 83 FRANCE CARBON BLACK MARKET, BY PROCESS TYPE, 2020-2027 (USD MILLION) 87

TABLE 84 FRANCE CARBON BLACK MARKET, BY PROCESS TYPE, 2020-2027 (KILOTONS) 88

TABLE 85 FRANCE CARBON BLACK MARKET, BY FUNCTION, 2020-2027 (USD MILLION) 88

TABLE 86 FRANCE CARBON BLACK MARKET, BY FUNCTION, 2020-2027 (KILOTONS) 88

TABLE 87 FRANCE CARBON BLACK MARKET, BY APPLICATION, 2020-2027 (USD MILLION) 89

TABLE 88 FRANCE CARBON BLACK MARKET, BY APPLICATION, 2020-2027 (KILOTONS) 89

TABLE 89 U.K CARBON BLACK MARKET, BY PROCESS TYPE, 2020-2027 (USD MILLION) 90

TABLE 90 U.K CARBON BLACK MARKET, BY PROCESS TYPE, 2020-2027 (KILOTONS) 90

TABLE 91 U.K CARBON BLACK MARKET, BY FUNCTION, 2020-2027 (USD MILLION) 91

TABLE 92 U.K CARBON BLACK MARKET, BY FUNCTION, 2020-2027 (KILOTONS) 91

TABLE 93 U.K CARBON BLACK MARKET, BY APPLICATION, 2020-2027 (USD MILLION) 91

TABLE 94 U.K CARBON BLACK MARKET, BY APPLICATION, 2020-2027 (KILOTONS) 92

TABLE 95 RUSSIA CARBON BLACK MARKET, BY PROCESS TYPE, 2020-2027 (USD MILLION) 92

TABLE 96 RUSSIA CARBON BLACK MARKET, BY PROCESS TYPE, 2020-2027 (KILOTONS) 93

TABLE 97 RUSSIA CARBON BLACK MARKET, BY FUNCTION, 2020-2027 (USD MILLION) 93

TABLE 98 RUSSIA CARBON BLACK MARKET, BY FUNCTION, 2020-2027 (KILOTONS) 93

TABLE 99 RUSSIA CARBON BLACK MARKET, BY APPLICATION, 2020-2027 (USD MILLION) 94

TABLE 100 RUSSIA CARBON BLACK MARKET, BY APPLICATION, 2020-2027 (KILOTONS) 94

TABLE 101 ITALY CARBON BLACK MARKET, BY PROCESS TYPE, 2020-2027 (USD MILLION) 95

TABLE 102 ITALY CARBON BLACK MARKET, BY PROCESS TYPE, 2020-2027 (KILOTONS) 95

TABLE 103 ITALY CARBON BLACK MARKET, BY FUNCTION, 2020-2027 (USD MILLION) 96

TABLE 104 ITALY CARBON BLACK MARKET, BY FUNCTION, 2020-2027 (KILOTONS) 96

TABLE 105 ITALY CARBON BLACK MARKET, BY APPLICATION, 2020-2027 (USD MILLION) 96

TABLE 106 ITALY CARBON BLACK MARKET, BY APPLICATION, 2020-2027 (KILOTONS) 97

TABLE 107 REST OF EUROPE CARBON BLACK MARKET, BY PROCESS TYPE, 2020-2027 (USD MILLION) 97

TABLE 108 REST OF EUROPE CARBON BLACK MARKET, BY PROCESS TYPE, 2020-2027 (KILOTONS) 98

TABLE 109 REST OF EUROPE CARBON BLACK MARKET, BY FUNCTION, 2020-2027 (USD MILLION) 98

TABLE 110 REST OF EUROPE CARBON BLACK MARKET, BY FUNCTION, 2020-2027 (KILOTONS) 98

TABLE 111 REST OF EUROPE CARBON BLACK MARKET, BY APPLICATION, 2020-2027 (USD MILLION) 99

TABLE 112 REST OF EUROPE CARBON BLACK MARKET, BY APPLICATION, 2020-2027 (KILOTONS) 99

TABLE 113 ASIA-PACIFIC CARBON BLACK MARKET, BY COUNTRY, 2020-2027 (USD MILLION) 100

TABLE 114 ASIA-PACIFIC CARBON BLACK MARKET, BY COUNTRY, 2020-2027 (KILOTONS) 101

TABLE 115 ASIA-PACIFIC CARBON BLACK MARKET, BY PROCESS TYPE, 2020-2027 (USD MILLION) 101

TABLE 116 ASIA-PACIFIC CARBON BLACK MARKET, BY PROCESS TYPE, 2020-2027 (KILOTONS) 102

TABLE 117 ASIA-PACIFIC CARBON BLACK MARKET, BY FUNCTION, 2020-2027 (USD MILLION) 102

TABLE 118 ASIA-PACIFIC CARBON BLACK MARKET, BY FUNCTION, 2020-2027 (KILOTONS) 102

TABLE 119 ASIA-PACIFIC CARBON BLACK MARKET, BY APPLICATION, 2020-2027 (USD MILLION) 103

TABLE 120 ASIA-PACIFIC CARBON BLACK MARKET, BY APPLICATION, 2020-2027 (KILOTONS) 103

TABLE 121 CHINA CARBON BLACK MARKET, BY PROCESS TYPE, 2020-2027 (USD MILLION) 104

TABLE 122 CHINA CARBON BLACK MARKET, BY PROCESS TYPE, 2020-2027 (KILOTONS) 104

TABLE 123 CHINA CARBON BLACK MARKET, BY FUNCTION, 2020-2027 (USD MILLION) 105

TABLE 124 CHINA CARBON BLACK MARKET, BY FUNCTION, 2020-2027 (KILOTONS) 105

TABLE 125 CHINA CARBON BLACK MARKET, BY APPLICATION, 2020-2027 (USD MILLION) 105

TABLE 126 CHINA CARBON BLACK MARKET, BY APPLICATION, 2020-2027 (KILOTONS) 106

TABLE 127 JAPAN CARBON BLACK MARKET, BY PROCESS TYPE, 2020-2027 (USD MILLION) 106

TABLE 128 JAPAN CARBON BLACK MARKET, BY PROCESS TYPE, 2020-2027 (KILOTONS) 107

TABLE 129 JAPAN CARBON BLACK MARKET, BY FUNCTION, 2020-2027 (USD MILLION) 107

TABLE 130 JAPAN CARBON BLACK MARKET, BY FUNCTION, 2020-2027 (KILOTONS) 107

TABLE 131 JAPAN CARBON BLACK MARKET, BY APPLICATION, 2020-2027 (USD MILLION) 108

TABLE 132 JAPAN CARBON BLACK MARKET, BY APPLICATION, 2020-2027 (KILOTONS) 108

TABLE 133 INDIA CARBON BLACK MARKET, BY PROCESS TYPE, 2020-2027 (USD MILLION) 109

TABLE 134 INDIA CARBON BLACK MARKET, BY PROCESS TYPE, 2020-2027 (KILOTONS) 109

TABLE 135 INDIA CARBON BLACK MARKET, BY FUNCTION, 2020-2027 (USD MILLION) 110

TABLE 136 INDIA CARBON BLACK MARKET, BY FUNCTION, 2020-2027 (KILOTONS) 110

TABLE 137 INDIA CARBON BLACK MARKET, BY APPLICATION, 2020-2027 (USD MILLION) 110

TABLE 138 INDIA CARBON BLACK MARKET, BY APPLICATION, 2020-2027 (KILOTONS) 111

TABLE 139 ASEAN CARBON BLACK MARKET, BY PROCESS TYPE, 2020-2027 (USD MILLION) 111

TABLE 140 ASEAN CARBON BLACK MARKET, BY PROCESS TYPE, 2020-2027 (KILOTONS) 112

TABLE 141 ASEAN CARBON BLACK MARKET, BY FUNCTION, 2020-2027 (USD MILLION) 112

TABLE 142 ASEAN CARBON BLACK MARKET, BY FUNCTION, 2020-2027 (KILOTONS) 112

TABLE 143 ASEAN CARBON BLACK MARKET, BY APPLICATION, 2020-2027 (USD MILLION) 113

TABLE 144 ASEAN CARBON BLACK MARKET, BY APPLICATION, 2020-2027 (KILOTONS) 113

TABLE 145 SOUTH KOREA CARBON BLACK MARKET, BY PROCESS TYPE, 2020-2027 (USD MILLION) 114

TABLE 146 SOUTH KOREA CARBON BLACK MARKET, BY PROCESS TYPE, 2020-2027 (KILOTONS) 114

TABLE 147 SOUTH KOREA CARBON BLACK MARKET, BY FUNCTION, 2020-2027 (USD MILLION) 115

TABLE 148 SOUTH KOREA CARBON BLACK MARKET, BY FUNCTION, 2020-2027 (KILOTONS) 115

TABLE 149 SOUTH KOREA CARBON BLACK MARKET, BY APPLICATION, 2020-2027 (USD MILLION) 115

TABLE 150 SOUTH KOREA CARBON BLACK MARKET, BY APPLICATION, 2020-2027 (KILOTONS) 116

TABLE 151 REST OF ASIA-PACIFIC CARBON BLACK MARKET, BY PROCESS TYPE, 2020-2027 (USD MILLION) 116

TABLE 152 REST OF ASIA-PACIFIC CARBON BLACK MARKET, BY PROCESS TYPE, 2020-2027 (KILOTONS) 117

TABLE 153 REST OF ASIA-PACIFIC CARBON BLACK MARKET, BY FUNCTION, 2020-2027 (USD MILLION) 117

TABLE 154 REST OF ASIA-PACIFIC CARBON BLACK MARKET, BY FUNCTION, 2020-2027 (KILOTONS) 117

TABLE 155 REST OF ASIA-PACIFIC CARBON BLACK MARKET, BY APPLICATION, 2020-2027 (USD MILLION) 118

TABLE 156 REST OF ASIA-PACIFIC CARBON BLACK MARKET, BY APPLICATION, 2020-2027 (KILOTONS) 118

TABLE 157 MIDDLE EAST & AFRICA CARBON BLACK MARKET, BY PROCESS , 2020-2027 (USD MILLION) 119

TABLE 158 MIDDLE EAST & AFRICA CARBON BLACK MARKET, BY PROCESS , 2020-2027 (KILOTONS) 119

TABLE 159 MIDDLE EAST & AFRICA CARBON BLACK MARKET, BY PROCESS TYPE, 2020-2027 (USD MILLION) 120

TABLE 160 MIDDLE EAST & AFRICA CARBON BLACK MARKET, BY PROCESS TYPE, 2020-2027 (KILOTONS) 120

TABLE 161 MIDDLE EAST & AFRICA CARBON BLACK MARKET, BY FUNCTION, 2020-2027 (USD MILLION) 121

TABLE 162 MIDDLE EAST & AFRICA CARBON BLACK MARKET, BY FUNCTION, 2020-2027 (KILOTONS) 121

TABLE 163 MIDDLE EAST & AFRICA CARBON BLACK MARKET, BY APPLICATION, 2020-2027 (USD MILLION) 121

TABLE 164 MIDDLE EAST & AFRICA CARBON BLACK MARKET, BY APPLICATION, 2020-2027 (KILOTONS) 122

TABLE 165 GCC CARBON BLACK MARKET, BY PROCESS TYPE, 2020-2027 (USD MILLION) 122

TABLE 166 GCC CARBON BLACK MARKET, BY PROCESS TYPE, 2020-2027 (KILOTONS) 123

TABLE 167 GCC CARBON BLACK MARKET, BY FUNCTION, 2020-2027 (USD MILLION) 123

TABLE 168 GCC CARBON BLACK MARKET, BY FUNCTION, 2020-2027 (KILOTONS) 123

TABLE 169 GCC CARBON BLACK MARKET, BY APPLICATION, 2020-2027 (USD MILLION) 124

TABLE 170 GCC CARBON BLACK MARKET, BY APPLICATION, 2020-2027 (KILOTONS) 124

TABLE 171 SOUTH AFRICA CARBON BLACK MARKET, BY PROCESS TYPE, 2020-2027 (USD MILLION) 125

TABLE 172 SOUTH AFRICA CARBON BLACK MARKET, BY PROCESS TYPE, 2020-2027 (KILOTONS) 125

TABLE 173 SOUTH AFRICA CARBON BLACK MARKET, BY FUNCTION, 2020-2027 (USD MILLION) 126

TABLE 174 SOUTH AFRICA CARBON BLACK MARKET, BY FUNCTION, 2020-2027 (KILOTONS) 126

TABLE 175 SOUTH AFRICA CARBON BLACK MARKET, BY APPLICATION, 2020-2027 (USD MILLION) 126

TABLE 176 SOUTH AFRICA CARBON BLACK MARKET, BY APPLICATION, 2020-2027 (KILOTONS) 127

TABLE 177 REST OF MIDDLE EAST & AFRICA CARBON BLACK MARKET, BY PROCESS TYPE, 2020-2027 (USD MILLION) 127

TABLE 178 REST OF MIDDLE EAST & AFRICA CARBON BLACK MARKET, BY PROCESS TYPE, 2020-2027 (KILOTONS) 128

TABLE 179 REST OF MIDDLE EAST & AFRICA CARBON BLACK MARKET, BY FUNCTION, 2020-2027 (USD MILLION) 128

TABLE 180 REST OF MIDDLE EAST & AFRICA CARBON BLACK MARKET, BY FUNCTION, 2020-2027 (KILOTONS) 128

TABLE 181 REST OF MIDDLE EAST & AFRICA CARBON BLACK MARKET, BY APPLICATION, 2020-2027 (USD MILLION) 129

TABLE 182 REST OF MIDDLE EAST & AFRICA CARBON BLACK MARKET, BY APPLICATION, 2020-2027 (KILOTONS) 129

TABLE 183 LATIN AMERICA CARBON BLACK MARKET, BY COUNTRY , 2020-2027 (USD MILLION) 130

TABLE 184 LATIN AMERICA CARBON BLACK MARKET, BY COUNTRY , 2020-2027 (KILOTONS) 130

TABLE 185 LATIN AMERICA CARBON BLACK MARKET, BY PROCESS TYPE, 2020-2027 (USD MILLION) 131

TABLE 186 LATIN AMERICA CARBON BLACK MARKET, BY PROCESS TYPE, 2020-2027 (KILOTONS) 131

TABLE 187 LATIN AMERICA CARBON BLACK MARKET, BY FUNCTION, 2020-2027 (USD MILLION) 132

TABLE 188 LATIN AMERICA CARBON BLACK MARKET, BY FUNCTION, 2020-2027 (KILOTONS) 132

TABLE 189 LATIN AMERICA CARBON BLACK MARKET, BY APPLICATION, 2020-2027 (USD MILLION) 132

TABLE 190 LATIN AMERICA CARBON BLACK MARKET, BY APPLICATION, 2020-2027 (KILOTONS) 133

TABLE 191 BRAZIL CARBON BLACK MARKET, BY PROCESS TYPE, 2020-2027 (USD MILLION) 133

TABLE 192 BRAZIL CARBON BLACK MARKET, BY PROCESS TYPE, 2020-2027 (KILOTONS) 134

TABLE 193 BRAZIL CARBON BLACK MARKET, BY FUNCTION, 2020-2027 (USD MILLION) 134

TABLE 194 BRAZIL CARBON BLACK MARKET, BY FUNCTION, 2020-2027 (KILOTONS) 134

TABLE 195 BRAZIL CARBON BLACK MARKET, BY APPLICATION, 2020-2027 (USD MILLION) 135

TABLE 196 BRAZIL CARBON BLACK MARKET, BY APPLICATION, 2020-2027 (KILOTONS) 135

TABLE 197 MEXICO CARBON BLACK MARKET, BY PROCESS TYPE, 2020-2027 (USD MILLION) 136

TABLE 198 MEXICO CARBON BLACK MARKET, BY PROCESS TYPE, 2020-2027 (KILOTONS) 136

TABLE 199 MEXICO CARBON BLACK MARKET, BY FUNCTION, 2020-2027 (USD MILLION) 137

TABLE 200 MEXICO CARBON BLACK MARKET, BY FUNCTION, 2020-2027 (KILOTONS) 137

TABLE 201 MEXICO CARBON BLACK MARKET, BY APPLICATION, 2020-2027 (USD MILLION) 137

TABLE 202 MEXICO CARBON BLACK MARKET, BY APPLICATION, 2020-2027 (KILOTONS) 138

TABLE 203 REST OF LATIN AMERICA CARBON BLACK MARKET, BY PROCESS TYPE, 2020-2027 (USD MILLION) 138

TABLE 204 REST OF LATIN AMERICA CARBON BLACK MARKET, BY PROCESS TYPE, 2020-2027 (KILOTONS) 139

TABLE 205 REST OF LATIN AMERICA CARBON BLACK MARKET, BY FUNCTION, 2020-2027 (USD MILLION) 139

TABLE 206 REST OF LATIN AMERICA CARBON BLACK MARKET, BY FUNCTION, 2020-2027 (KILOTONS) 139

TABLE 207 REST OF LATIN AMERICA CARBON BLACK MARKET, BY APPLICATION, 2020-2027 (USD MILLION) 140

TABLE 208 REST OF LATIN AMERICA CARBON BLACK MARKET, BY APPLICATION, 2020-2027 (KILOTONS) 140

TABLE 209 KEY DEVELOPMENT ABNALYSIS 142

15 List Of Figures

FIGURE 1 GLOBAL CARBON BLACK MARKET: MARKET STRUCTURE 22

FIGURE 2 KEY TAKEAWAYS OF THE CARBON BLACK MARKET 24

FIGURE 3 NORTH AMERICA MARKET SIZE & MARKET SHARE BY COUNTRY (2020 VS 2023) 24

FIGURE 4 EUROPE MARKET SIZE & MARKET SHARE BY COUNTRY (2020 VS 2023) 25

FIGURE 5 ASIA PACIFIC & MARKET SHARE BY COUNTRY (2020 VS 2023) 25

FIGURE 6 LATIN AMERICA MARKET SIZE & MARKET SHARE BY COUNTRY (2020 VS 2023) 26

FIGURE 7 MIDDLE EAST & AFRICA MARKET SIZE & MARKET SHARE BY COUNTRY (2020 VS 2023) 26

FIGURE 8 RESEARCH PROCESS OF MRFR 28

FIGURE 9 TOP DOWN & BOTTOM-UP APPROACH 31

FIGURE 10 DROC ANALYSIS OF GLOBAL CARBON BLACK MARKET 33

FIGURE 11 TIRE INDUSTRY NEW CAPACITY INVESTMENT, BY REGION (2016-2021) 34

FIGURE 12 AUTOMOTIVE PRODUCTION (2014-2022) 34

FIGURE 13 GLOBAL PAINTS & COATING MARKET REVENUE, (2020-2027) 35

FIGURE 14 INDUSTRIAL RUBBER PRODUCTS MARKET, USD BILLION (2016-2023) 36

FIGURE 15 DRIVERS IMPACT ANALYSIS: CARBON BLACK MARKET 37

FIGURE 16 RESTRAINTS IMPACT ANALYSIS: CARBON BLACK MARKET 38

FIGURE 17 SUPPLY CHAIN: CARBON BLACK MARKET 40

FIGURE 18 PORTER'S FIVE FORCES ANALYSIS OF THE GLOBAL CARBON BLACK MARKET 41

FIGURE 19 GLOBAL CARBON BLACKMARKET, BY PROCESS TYPE, 2020-2027 44

FIGURE 20 GLOBAL CARBON BLACK MARKET, BY FUNCTION, 2020-2027 52

FIGURE 21 GLOBAL CARBON BLACK MARKET, BY APPLICATION, 2020-2027 57

FIGURE 22 GLOBAL CARBON BLACK MARKET, BY REGION, 2020-2027 66

FIGURE 23 NORTH AMERICA CARBON BLACK MARKET, BY COUNTRY (2020) 70

FIGURE 24 EUROPE CARBON BLACK MARKET, BY COUNTRY (2020) 78

FIGURE 25 ASIA-PACIFIC CARBON BLACK MARKET, BY COUNTRY (2020) 100

FIGURE 26 MIDDLE EAST & AFRICA CARBON BLACK MARKET, BY COUNTRY (2020) 119

FIGURE 27 LATIN AMERICA CARBON BLACK MARKET, BY COUNTRY (2020) 130

Purchase Option
Single User $ 4,950
Multiuser License $ 5,950
Enterprise User $ 7,250
Compare Licenses
Tailored for You
  • Dedicated Research on any specifics segment or region.
  • Focused Research on specific players in the market.
  • Custom Report based only on your requirements.
  • Flexibility to add or subtract any chapter in the study.
  • Historic data from 2014 and forecasts outlook till 2040.
  • Flexibility of providing data/insights in formats (PDF, PPT, Excel).
  • Provide cross segmentation in applicable scenario/markets.