ID: MRFR/MED/1006-HCR | February 2021 | Region: Global | 115 pages
Market Scenario
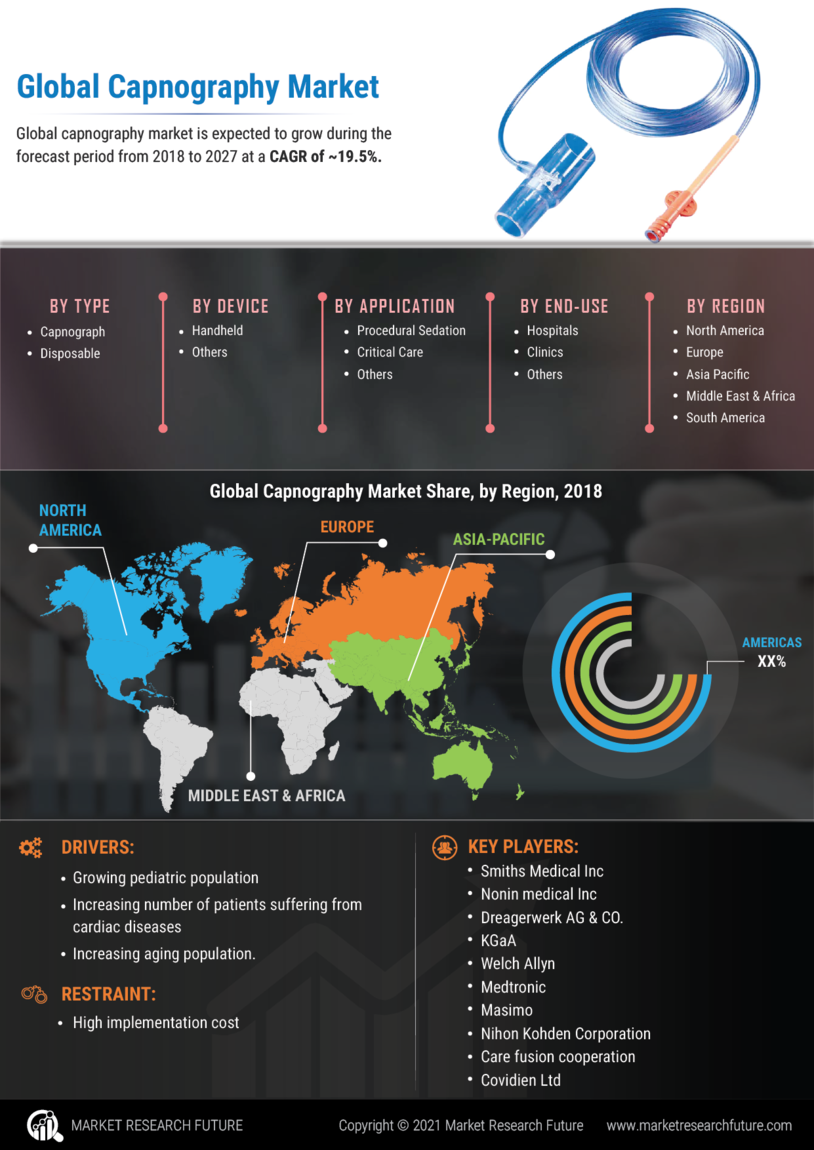
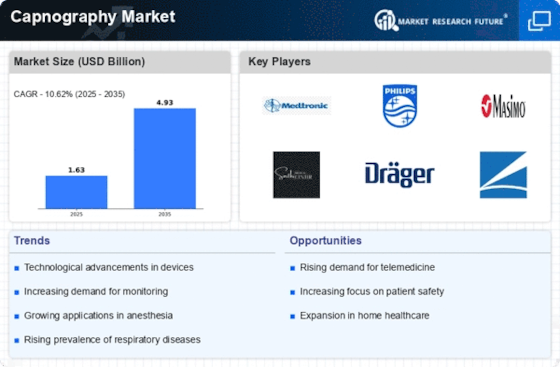
The global capnography market is expected to grow during the forecast period from 2018 to 2027 at a CAGR of ~19.5%. Capnography is the process used to measure and determine the concentration of Carbon Dioxide (CO2) in respiratory gases by using the capnograph device. It helps to measure the actual concentration of carbon dioxide in the bloodstream. The capnograph is used to monitor the inhaled and exhaled concentration of CO2. The growing pediatric population, increasing number of patients suffering from cardiac diseases, and increasing aging population are expected to drive the growth of the market. The global capnography market is estimated to grow during the forecast period due to factors such as innovation, technological advancements, and advancement of the capnography device. A strong recommendation about capnography was made by healthcare bodies such as the American Society of Anesthesiologists, European Resuscitation Council, and others to include capnography devices in healthcare facilities compulsorily. This fuels the growth of the global capnography market.
Segmentation
The global capnography market is segmented on the basis of type, devices, application, and end-user. The global capnography market on the basis of type is segmented into capnograph and disposable. Capnograph is further subdivided into three segments, namely, mainstream capnography, sidestream capnography, and micro stream capnography. Mainstream capnography is further subdivided sand alone monitor, handheld monitor, and multi-parameter monitor. Based on device, the global capnography market is segmented into handheld monitors, stand-alone monitors, and others. Based on application the global capnography market is segmented into procedural sedation, critical care, emergency medicine, pain management, and general floor. Based on end-user the global capnography market is segmented into hospitals, clinics, and ambulatory surgical centers.
Key players
Smiths Medical Inc, Nonin medical Inc, Dreagerwerk AG & CO. KGaA, Welch Allyn, Medtronic, Masimo, Nihon Kohden Corporation, Care fusion cooperation, Covidien Ltd, Diamedica Limited, Edan Instruments, Inc., Hill Rom Holding Inc, Koninklijke Philips N.V., and BD
Regional Market Summary
Global Capnography Market Share (%), by Region, 2018
Sources: National Electronic Health Records Survey, U.S. Department of Health & Human Services, National Centre for Health Statistics
Based on region, the global capnography research market is segmented into the Americas, Europe, Asia-Pacific, and the Middle East and Africa.
The Americas is sub-segmented into North America and South America. The North American region is further segmented into the US and Canada. The European region is divided into two, namely, Western Europe and Eastern Europe. Western Europe is further classified into Germany, Italy, France, the UK, Spain, and the rest of Western Europe. The Asia-Pacific region is sub-segmented into Japan, China, India, Australia, the Republic of Korea, and the rest of Asia-Pacific. The Middle Eastern and African region is sub-segmented into the United Arab Emirates, Saudi Arabia, Oman, Kuwait, Qatar, and the rest of the Middle East and Africa.
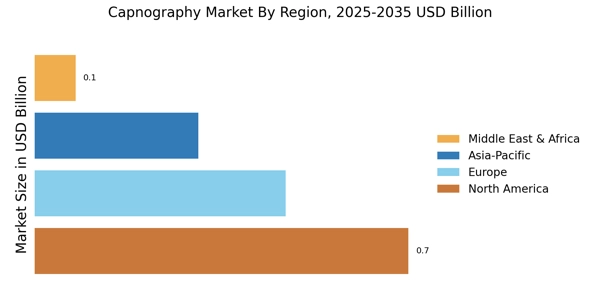
The American market is likely to dominate the global capnography market owing to the rising prevalence of chronic diseases in the aging population and the growing occurrence of asthma in pediatrics. North America dominates the global capnography market due to the development of advanced products in this region. Latin America is showing significant growth in the capnography market due to increasing use of capnography devices in healthcare facilities as recommended by government bodies. The World Health Organization has published a report on Safe Surgery that recommended the use of capnography monitoring devices during the endotracheal tube placement surgery. The American Society of Anesthesiologists also recommended the use of capnography during procedural sedation and anesthesia. The rising problems of respiratory diseases because of an unhealthy lifestyle and high-stress level impact have led to significant growth in this market.
The European market is the second largest in the global capnography market. The market growth in this region is due to government funding and support from the healthcare sector. However, growing number of surgeries and changing lifestyle have contributed to the growth of the market in this region.
Asia-Pacific is anticipated to be the fastest growing market owing to the increasing aging population and rising prevalence of diseases. The capnography market in Asia-Pacific is anticipated to grow during the forecast period due to rising healthcare expenditure and increasing awareness about the capnography technique.
Countries such as India and China are more focused on the global capnography market because of the growing purchasing power and the increasing population as compared to other developing countries.
Intended Audience
Contract Research Organizations (CROs)
Academic Medical Institutes and Universities
Government and Private Laboratories
Research and Development (R&D) Companies
Market Research and Consulting Service Providers
Capnography Equipment Manufacturers
Capnography Equipment Suppliers
Independent Research Laboratories
Medical Research Laboratories
Market Segmentation and Key Market Players
Global Capnography Research Market, by Type
Capnograph
Main Stream Capnograph
Standalone monitor
Handheld monitor
Multiparameter monitor
Sidestream capnograph
Micro stream capnograph
Capnograph Disposables
Global Capnography Research Market, by Device
Handheld monitor
Standalone monitor
Multiparameter monitor
Global Capnography Research Market, by Application
Procedural Sedation
Critical Care
Emergency Medicine
Pain Management
General Floor
Global Capnography Research Market, by End-User
Hospital
Clinic
Ambulatory Surgical Center
Global Capnography Research Market, by Region
Americas
Europe
Asia-Pacific
Middle East & Africa
Frequently Asked Questions (FAQ) :
The outlook of the global Capnography market looks very promising.
global Capnography market is projected to grow at approximately 19.5% CAGR during the assessment period (2018-2027).
Technological advances in capnography device and increasing number of patients suffering from cardiac diseases are the major tailwinds pushing the growth of the global Capnography market.
North America holds the largest share in the global Capnography market, followed by Europe and the Asia Pacific, respectively.
Dragerwerk AG (Germany), Athena GTX Inc. (US), Medtronic Inc. (US), Nonin Medical, Inc. (US), Masimo Corporation (US), OSI Systems Inc. (US), Welch Allyn, Inc. (US), and Koninklijke Philips N.V. (the Netherlands), are some of the major players operating in the Capnography market.
Table of Contents:
Chapter 1. Report Prologue
Chapter 2. Market Introduction
2.1 Definition
2.2 Scope of the Study
2.2.1 Research Objective
2.2.2 Assumptions
2.2.3 Limitations
Chapter 3. Research Methodology
3.1 Introduction
3.2 Primary Research
3.3 Secondary Research
3.4 Market Size Estimation
Chapter 4. Market Dynamics
4.1 Drivers
4.2 Restraints
4.3 Opportunities
4.4 Challenges
4.5 Macroeconomic Indicators
4.6 Technology Trends & Assessment
Chapter 5. Market Factor Analysis
5.1 Porter’s Five Forces Analysis
5.1.1 Bargaining Power of Suppliers
5.1.2 Bargaining Power of Buyers
5.1.3 Threat of New Entrants
5.1.4 Threat of Substitutes
5.1.5 Intensity of Rivalry
5.2 Value Chain Analysis
5.3 Investment Feasibility Analysis
5.4 Pricing Analysis
Chapter 6. Global Capnography Market, by Product
6.1 Introduction
6.2 Main Stream Capnography
6.2.1 Stand-alone monitor
Market Estimates & Forecast, by Region, 2018–2027
Market Estimates & Forecast, by Country, 2018–2027
6.2.1.1 Handheld monitor
Market Estimates & Forecast, by Region, 2018–2027
Market Estimates & Forecast, by Country, 2018–2027
6.2.1.2 Multiparameter monitor
Market Estimates & Forecast, by Region, 2018–2027
Market Estimates & Forecast, by Country, 2018–2027
6.3 Side stream capnography
Market Estimates & Forecast, by Region, 2018–2027
Market Estimates & Forecast, by Country, 2018–2027
6.4 Micro stream capnography
Market Estimates & Forecast, by Region, 2018–2027
Market Estimates & Forecast, by Country, 2018–2027
6.5 Disposable capnography
Market Estimates & Forecast, by Region, 2018–2027
Market Estimates & Forecast, by Country, 2018–2027
6.6 Others
Chapter 7. Global Capnography Market, by Application
7.1 Introduction
7.2 Procedural sedation
Market Estimates & Forecast, by Region, 2018–2027
Market Estimates & Forecast, by Country, 2018–2027
7.3 Critical care
Market Estimates & Forecast, by Region, 2018–2027
Market Estimates & Forecast, by Country, 2018–2027
7.4 Emergency medicine
Market Estimates & Forecast, by Region, 2018–2027
Market Estimates & Forecast, by Country, 2018–2027
7.5 Pain management
Market Estimates & Forecast, by Region, 2018–2027
Market Estimates & Forecast, by Country, 2018–2027
7.6 General floor
Market Estimates & Forecast, by Region, 2018–2027
Market Estimates & Forecast, by Country, 2018–2027
7.7 Others
Market Estimates & Forecast, by Region, 2018–2027
Market Estimates & Forecast, by Country, 2018–2027
Chapter 8. Global Capnography Market, by Device
8.1 Introduction
Market Estimates & Forecast, by Region, 2018–2027
Market Estimates & Forecast, by Country, 2018–2027
8.2 Handheld monitor
Market Estimates & Forecast, by Region, 2018–2027
Market Estimates & Forecast, by Country, 2018–2027
8.3 Standalone monitor
Market Estimates & Forecast, by Region, 2018–2027
Market Estimates & Forecast, by Country, 2018–2027
8.4 Multiparameter monitor
Market Estimates & Forecast, by Region, 2018–2027
Market Estimates & Forecast, by Country, 2018–2027
Chapter 9. Global Capnography Market, by End-User
9.1 Introduction
9.2 Hospitals & Clinics
Market Estimates & Forecast, by Region, 2018–2027
Market Estimates & Forecast, by Country, 2018–2027
9.3 Ambulatory surgical center
Market Estimates & Forecast, by Region, 2018–2027
Market Estimates & Forecast, by Country, 2018–2027
9.4 Others
Market Estimates & Forecast, by Region, 2018–2027
Market Estimates & Forecast, by Country, 2018–2027
Chapter 10. Global Capnography Market, by Region
10.1 Introduction
10.2 Americas
10.2.1 North America
10.2.1.1 US
10.2.1.2 Canada
10.2.2 South America
10.3 Europe
10.3.1 Western Europe
10.3.1.1 Germany
10.3.1.2 France
10.3.1.3 Italy
10.3.1.4 Spain
10.3.1.5 UK
10.3.1.6 Rest of Western Europe
10.3.2 Eastern Europe
10.4 Asia-Pacific
10.4.1 Japan
10.4.2 China
10.4.3 India
10.4.4 Australia
10.4.5 South Korea
10.4.6 Rest of Asia-Pacific
10.5 Middle East & Africa
9.5.1 Middle East
9.5.2 Africa
Chapter 11. Company Landscape
11.1 Introduction
11.2 Market Share Analysis
11.3 Key Development & Strategies
Chapter 12. Company Profiles
12.1 Smiths Medical Inc
12.1.1 Company Overview
12.1.2 Product Overview
12.1.3 Financials Overview
12.1.4 Key Developments
12.1.5 SWOT Analysis
12.2 Nonin Medical Inc
12.2.1 Company Overview
12.2.2 Product Overview
12.2.3 Financial Overview
12.2.4 Key Developments
12.2.5 SWOT Analysis
12.3 Dreagerwerk AG & CO. KGaA
12.3.1 Company Overview
12.3.2 Product Overview
12.3.3 Financial Overview
12.3.4 Key Development
12.3.5 SWOT Analysis
12.4 Welch Allyn
12.4.1 Company Overview
12.4.2 Technology/Business Segment Overview
12.4.3 Financial Overview
12.4.4 Key Development
12.4.5 SWOT Analysis
12.5 Medtronic
12.5.1 Company Overview
12.5.2 Product Overview
12.5.3 Financial overview
12.5.4 Key Developments
12.5.5 SWOT Analysis
12.6 Masimo
11.6.1 Company Overview
11.6.2 Product Overview
11.6.3 Financial Overview
11.6.4 Key Developments
11.6.5 SWOT Analysis
12.7 Nihon Kohden Corporation
12.7.1 Overview
12.7.2 Product Overview
12.7.3 Financial Overview
12.7.4 Key Developments
12.7.5 SWOT Analysis
12.8 Care fusion cooperation
12.8.1 Overview
12.8.2 Product/ Technology Overview
12.8.3 Financials
12.8.4 Key Developments
12.8.5 SWOT Analysis
12.9 Covidien Ltd
12.9.1 Overview
12.9.2 Product Overview
12.9.3 Financials
12.9.4 Key Developments
12.9.5 SWOT Analysis
12.10 Diamedica limited
12.10.1 Overview
12.10.2 Product Overview
12.10.3 Financials
12.10.4 Key Developments
12.10.5 SWOT Analysis
12.11 Edan Instrument
12.12.1 Overview
12.12.2 Type Overview
12.12.3 Financials
12.12.4 Key Developments
12.12.5 SWOT Analysis
12.12 Hill rom holding
12.12.1 Overview
12.12.2 Type Overview
12.12.3 Financials
12.12.4 Key Developments
12.12.5 SWOT Analysis
12.13 BD
12.13.1 Overview
12.13.2 Type Overview
12.13.3 Financials
12.13.4 Key Developments
12.13.5 SWOT Analysis
Chapter 13 MRFR Conclusion
13.1 Key Findings
13.1.1 From CEO’s Viewpoint
13.1.2 Unmet Needs of the Market
13.2 Key Companies to Watch
13.3 Predictions for the Capnography Industry
Chapter 14. Appendix
LIST OF TABLES
Table 1 Global Capnography Market Synopsis, 2015–2027
Table 2 Global Capnography Market Estimates and Forecast, 2015–2027(USD Million)
Table 3 Global Capnography Market, by Region, 2015–2027(USD Million)
Table 4 Global Capnography Market, by Types 2015–2027(USD Million)
Table 5 Global Capnography Market, by End-User, 2015–2027(USD Million)
Table 6 Global Capnography Market, by Application, 2015–2027(USD Million)
Table 7 North America: Capnography Market, by Types 2015–2027(USD
Million)
Table 8 North America: Capnography Market, by End-User, 2015–2027(USD
Million)
Table 9 North America: Capnography Market, by Application, 2015–2027(USD
Million)
Table 10 US: Capnography Market, by Types 2015–2027(USD Million)
Table 11 US: Capnography Market, by End-User, 2015–2027(USD Million)
Table 12 US: Capnography Market, by Application, 2015–2027(USD Million)
Table 13 Canada: Capnography Market, by Types 2015–2027(USD Million)
Table 14 Canada: Capnography Market, by End-User, 2015–2027(USD Million)
Table 15 Canada: Capnography Market, by Application, 2015–2027(USD
Million)
Table 16 South America: Capnography Market, by Types 2015–2027(USD
Million)
Table 17 South America: Capnography Market, by End-User, 2015–2027(USD
Million)
Table 18 South America: Capnography Market, by Application, 2015–2027(USD
Million)
Table 19 Europe: Capnography Market, by Types 2015–2027(USD Million)
Table 20 Europe: Capnography Market, by End-User, 2015–2027(USD Million)
Table 21 Europe: Capnography Market, by Application, 2015–2027(USD Million)
Table 22 Western Europe: Capnography Market, by Types 2015–2027(USD
Million)
Table 23 Western Europe: Capnography Market, by End-User, 2015–2027(USD
Million)
Table 24 Western Europe: Capnography Market, by Application, 2015–2027
(USD Million)
Table 25 Eastern Europe: Capnography Market, by Types 2015–2027(USD
Million)
Table 26 Eastern Europe: Capnography Market, by End-User, 2015–2027(USD
Million)
Table 27 Eastern Europe: Capnography Market, by Application, 2015–2027
(USD Million)
Table 28 Asia-Pacific: Capnography Market, by Types 2015–2027(USD
Million)
Table 29 Asia-Pacific: Capnography Market, by End-User, 2015–2027(USD
Million)
Table 30 Asia-Pacific: Capnography Market, by Application, 2015–2027(USD
Million)
Table 31 Middle East & Africa: Capnography Market, by Types 2015–2027
(USD Million)
Table 32 Middle East & Africa: Capnography Market, by End-User, 2015–2027
(USD Million)
Table 33 Middle East & Africa: Capnography Market, by Application, 2015–2027
(USD Million)
LIST OF FIGURES
Figure 1 Research Process
Figure 2 Segmentation for Global Capnography Market
Figure 3 Segmentation Market Dynamics for Global Capnography Market
Figure 4 Global Capnography Market Share, by Types 2015
Figure 5 Global Capnography Market Share, by End-User, 2015
Figure 6 Global Capnography Market Share, by Application, 2015
Figure 7 Global Capnography Market Share, by Region, 2015
Figure 8 North America: Capnography Market Share, by Country, 2015
Figure 9 Europe: Capnography Market Share, by Country, 2015
Figure 10 Asia-Pacific: Capnography Market Share, by Country, 2015
Figure 11 Middle East & Africa: Capnography Market Share, by Country, 2015
Figure 12 Global Capnography Market: Company Share Analysis, 2015 (%)
Figure 13 Smiths Medical Inc.: Key Financials
Figure 14 Smiths Medical Inc.: Segmental Revenue
Figure 15 Smiths Medical Inc.: Geographical Revenue
Figure 16 Nonin medical Inc.: Key Financials
Figure 17 Nonin medical Inc: Segmental Revenue
Figure 18 Nonin medical Inc: Geographical Revenue
Figure 19 Dreagerwerk AG & CO. KGaA.: Key Financials
Figure 20 Dreagerwerk AG & CO. KGaA.: Segmental Revenue
Figure 21 Dreagerwerk AG & CO. KGaA.: Geographical Revenue
Figure 22 Welch Allyn: Key Financials
Figure 23 Welch Allyn: Segmental Revenue
Figure 24 Welch Allyn: Geographical Revenue
Figure 25 Medtronic: Key Financials
Figure 26 Medtronic: Segmental Revenue
Figure 27 Medtronic: Geographical Revenue
Figure 28 Masimo.: Key Financials
Figure 29 Masimo: Segmental Revenue
Figure 30 Masimo: Geographical Revenue
Figure 31 Nihon Kohden Corporation: Key Financials
Figure 32 Nihon Kohden Corporation: Segmental Revenue
Figure 33 Nihon Kohden Corporation: Geographical Revenue
Figure 34 Care fusion cooperation: Key Financials
Figure 35 Care fusion cooperation: Segmental Revenue
Figure 36 Care fusion cooperation: Geographical Revenue
Figure 37 Covidien Ltd: Key Financials
Figure 38 Covidien Ltd: Segmental Revenue
Figure 39 Covidien Ltd: Geographical Revenue
Figure 40 Dia Medica: Key Financials
Figure 41 Dia Medica: Segmental Revenue
Figure 42 Dia Medica: Geographical Revenue
Figure 43 Edan Instrument: Key Financials
Figure 44 Edan Instrument: Segmental Revenue
Figure 45 Edan Instrument: Geographical Revenue
Figure 46 Hill Rom Holding: Key Financial
Figure 47 Hill Rom Holding: Segmental Revenue
Figure 48 Hill Rom Holding: Geographical Revenue
Figure 49 BD: Key Financial
Figure 50 BD: Segmental Revenue
Figure 51 BD: Geographical Revenue
Figure 22 GE healthcare: Key Financials
Figure 23 GE healthcare: Segmental Revenue
Figure 24 GE healthcare: Geographical Revenue