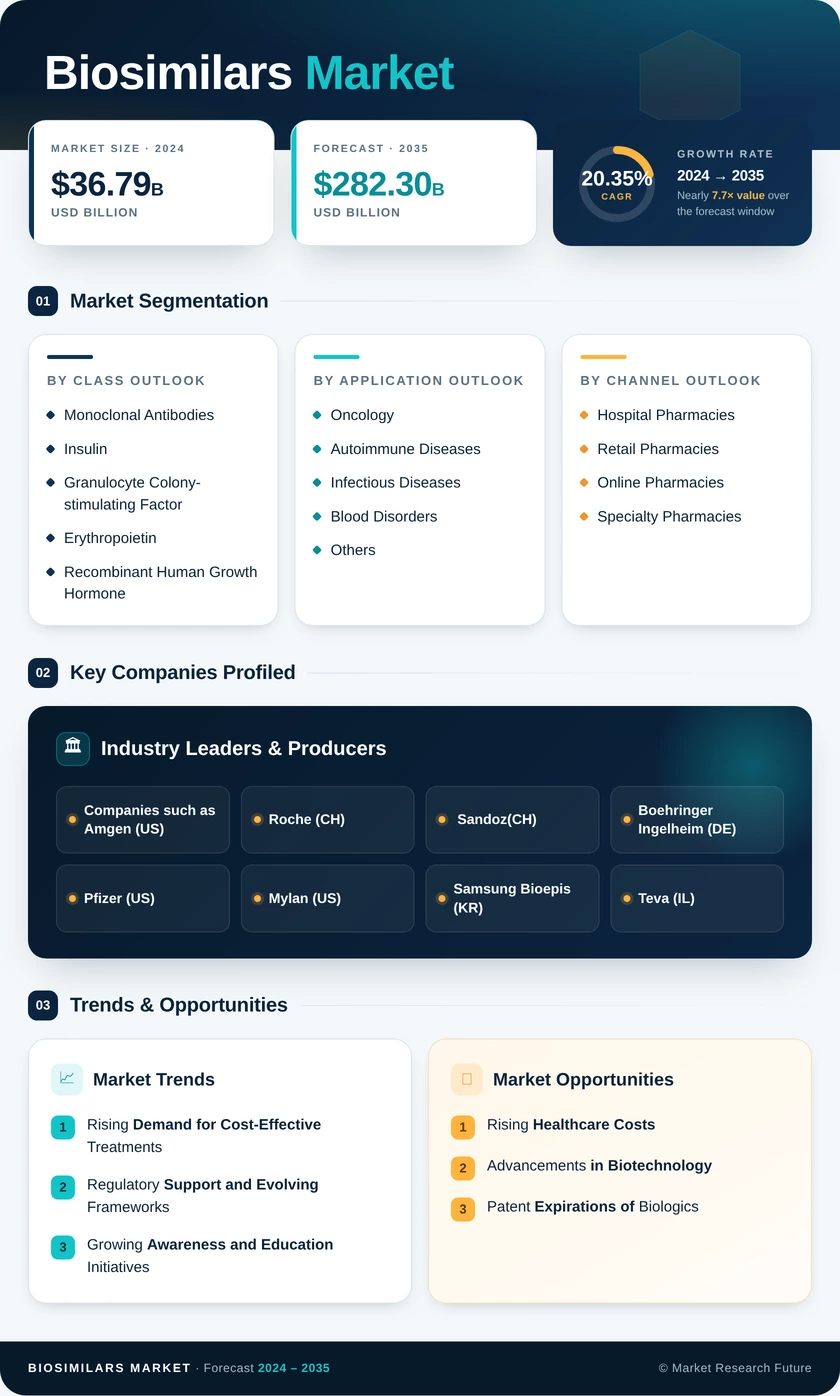
Biosimilars Market (2025 - 2035)

ID: MRFR/LS/0821-CR 209 Pages Nidhi Mandole Last Updated: September 15, 2026
Biosimilars Market Research Report: Size, Share, Trend Analysis By Drug Class (Monoclonal Antibodies (Adalimumab, Infliximab, Rituximab, Bevacizumab, Trastuzumab, Ustekinumab, Tocilizumab, Aflibercept, Dupilumab, Denosumab, Others), Insulin, Granulocyte Colony- stimulating Factor, Erythropoietin, Recombinant Human Growth Hormone, Etanercept, Follitropin, Teriparatide, Anticoagulants, Others), By Applications (Oncology (Breast Cancer, Lung Cancer, Prostate Cancer, Leukemia, Bladder Cancer, Colorectal Cancer, Others), Autoimmune Diseases, Infectious Diseases, Blood Disorders, Others), by Route of Administration (Subcutaneous and Intravenous), by Distribution Channel (Hospital Pharmacies, Retail Pharmacies, Online Pharmacies, Specialty Pharmacies) and Region (North America, Europe, Asia-Pacific, South America, Middle East & Africa)) - Growth Outlook & Industry Forecast 2025 To 2035
Biosimilars Market
Market Size
Forecast Period2025-2035
CAGR (2025-2035)17.0%
2025 Market SizeUSD 40.2 Billion
2035 Market SizeUSD 193.2 Billion
Key Players
Sandoz
Celltrion
Samsung Bioepis
Amgen
Pfizer
Biocon Biologics
Opportunities
  • The Checkpoint Inhibitor Cohort
  • Emerging-Market Regulatory Convergence
  • Device-Led Differentiation
  1. 1 Market Overview |
    1. 1.1 Study Assumptions & Market Definition |
    2. 1.2 Scope of the Study |
    3. 1.3 Research Methodology
  2. 2 Market Summary & Key Report Takeaways |
    1. 2.1 Takeaways by Product Class |
    2. 2.2 Takeaways by Indication & End User |
    3. 2.3 Takeaways by Geography
  3. 3 Global Market Size & Forecast (2021–2035) |
    1. 3.1 Historical Market Size (2021–2024) |
    2. 3.2 Base Year Estimate (2025) |
    3. 3.3 Forecast Market Size (2026–2035) |
    4. 3.4 Year-over-Year Growth Analysis
  4. 4 Market Dynamics — Drivers |
    1. 4.1 Biologic Loss-of-Exclusivity Cliff |
    2. 4.2 Payer Reimbursement Reform |
    3. 4.3 Streamlined Comparability Pathways |
    4. 4.4 Manufacturing Intensification Economics |
    5. 4.5 National Tender Substitution Mandates |
    6. 4.6 Emerging-Economy Regulatory Convergence
  5. 5 Market Dynamics — Restraints |
    1. 5.1 Rebate Bundling by Originators |
    2. 5.2 Development Cost & Timeline Intensity |
    3. 5.3 Price Erosion and Entrant Returns |
    4. 5.4 Patent Thickets & Litigation |
    5. 5.5 Prescriber and Patient Switching Hesitancy
  6. 6 Market Opportunity Analysis |
    1. 6.1 Checkpoint Inhibitor Expiry Cohort |
    2. 6.2 Emerging-Market Regulatory Convergence |
    3. 6.3 Device-Led Differentiation |
    4. 6.4 Real-World Evidence Monetisation |
    5. 6.5 Dedicated Contract Manufacturing |
    6. 6.6 Industry Value Chain Analysis |
    7. 6.7 Porter's Five Forces Analysis
  7. 7 Regional Analysis |
    1. 7.1 North America | |
      1. 7.1.1 US | |
      2. 7.1.2 Canada | |
      3. 7.1.3 Mexico |
    2. 7.2 Europe | |
      1. 7.2.1 Germany | |
      2. 7.2.2 UK | |
      3. 7.2.3 France | |
      4. 7.2.4 Italy | |
      5. 7.2.5 Spain | |
      6. 7.2.6 Nordic Countries | |
      7. 7.2.7 Russia | |
      8. 7.2.8 Rest of Europe |
    3. 7.3 Asia-Pacific | |
      1. 7.3.1 China | |
      2. 7.3.2 India | |
      3. 7.3.3 Japan | |
      4. 7.3.4 South Korea | |
      5. 7.3.5 ASEAN | |
      6. 7.3.6 Rest of Asia-Pacific |
    4. 7.4 South America | |
      1. 7.4.1 Brazil | |
      2. 7.4.2 Argentina | |
      3. 7.4.3 Rest of South America |
    5. 7.5 Middle East & Africa | |
      1. 7.5.1 Saudi Arabia | |
      2. 7.5.2 UAE | |
      3. 7.5.3 South Africa | |
      4. 7.5.4 Egypt | |
      5. 7.5.5 Rest of Middle East & Africa
  8. 8 Future Outlook (2026–2035) |
    1. 8.1 Analytics-Led Comparability |
    2. 8.2 Platform Economics & Consolidation |
    3. 8.3 Subcutaneous Conversion |
    4. 8.4 Global Access Economics
  9. 9 Segmentation Analysis |
    1. 9.1 By Product Class | |
      1. 9.1.1 Monoclonal Antibodies | |
      2. 9.1.2 Recombinant Hormones | |
      3. 9.1.3 Insulin & Insulin Analogues | |
      4. 9.1.4 Fusion Proteins & Anti-Inflammatory Agents | |
      5. 9.1.5 Others |
    2. 9.2 By Indication | |
      1. 9.2.1 Blood Disorders | |
      2. 9.2.2 Autoimmune & Chronic Inflammatory | |
      3. 9.2.3 Oncology | |
      4. 9.2.4 Diabetes | |
      5. 9.2.5 Growth Deficiency & Others |
    3. 9.3 By End User | |
      1. 9.3.1 Hospitals | |
      2. 9.3.2 Specialty Clinics | |
      3. 9.3.3 Retail & Homecare | |
      4. 9.3.4 Others |
    4. 9.4 By Manufacturing Type | |
      1. 9.4.1 In-House | |
      2. 9.4.2 Contract Manufacturing |
    5. 9.5 By Route of Administration | |
      1. 9.5.1 Intravenous | |
      2. 9.5.2 Subcutaneous
  10. 10 Competitive Landscape |
    1. 10.1 Market Concentration Analysis (2026) |
    2. 10.2 Competitive Benchmarking Matrix |
    3. 10.3 Company Profiles | |
      1. 10.3.1 Sandoz | |
      2. 10.3.2 Celltrion | |
      3. 10.3.3 Samsung Bioepis | |
      4. 10.3.4 Amgen | |
      5. 10.3.5 Pfizer | |
      6. 10.3.6 Biocon Biologics | |
      7. 10.3.7 Viatris | |
      8. 10.3.8 Fresenius Kabi | |
      9. 10.3.9 Teva | |
      10. 10.3.10 Coherus BioSciences | |
      11. 10.3.11 Boehringer Ingelheim | |
      12. 10.3.12 Dr. Reddy's Laboratories
  11. 11 Recent Developments & News (2023–2025)
  12. 12 Report Scope & Methodology |
    1. 12.1 Study Period & Base Year |
    2. 12.2 Data Sources & Triangulation |
    3. 12.3 Abbreviations
  13. 13 Detailed Sources & Citations
  14. 14 Frequently Asked Questions
  15. 15 LIST OF TABLES |
  16. TABLE 1 Global Biosimilars Market Size & Forecast, by Revenue (USD Billion), 2021–2035 |
  17. TABLE 2 Global Biosimilars Market — Year-over-Year Growth Analysis, 2021–2035 |
  18. TABLE 3 Driver Impact Analysis Matrix, 2026–2035 |
  19. TABLE 4 Restraint Impact Analysis Matrix, 2026–2035 |
  20. TABLE 5 Global Market Size, by Product Class, 2021–2035 (USD Billion) |
  21. TABLE 6 Global Market Size, by Indication, 2021–2035 (USD Billion) |
  22. TABLE 7 Global Market Size, by End User, 2021–2035 (USD Billion) |
  23. TABLE 8 Global Market Size, by Manufacturing Type, 2021–2035 (USD Billion) |
  24. TABLE 9 Global Market Size, by Route of Administration, 2021–2035 (USD Billion) |
  25. TABLE 10 Global Market Size, by Region, 2021–2035 (USD Billion) |
  26. TABLE 11 North America Market Size, by Country, 2021–2035 (USD Billion) |
  27. TABLE 12 Europe Market Size, by Country, 2021–2035 (USD Billion) |
  28. TABLE 13 Asia-Pacific Market Size, by Country, 2021–2035 (USD Billion) |
  29. TABLE 14 South America Market Size, by Country, 2021–2035 (USD Billion) |
  30. TABLE 15 Middle East & Africa Market Size, by Country, 2021–2035 (USD Billion) |
  31. TABLE 16 North America Market Size, by Product Class, 2021–2035 (USD Billion) |
  32. TABLE 17 North America Market Size, by Indication, 2021–2035 (USD Billion) |
  33. TABLE 18 Europe Market Size, by Product Class, 2021–2035 (USD Billion) |
  34. TABLE 19 Europe Market Size, by Indication, 2021–2035 (USD Billion) |
  35. TABLE 20 Asia-Pacific Market Size, by Product Class, 2021–2035 (USD Billion) |
  36. TABLE 21 Asia-Pacific Market Size, by Indication, 2021–2035 (USD Billion) |
  37. TABLE 22 South America Market Size, by Product Class, 2021–2035 (USD Billion) |
  38. TABLE 23 Middle East & Africa Market Size, by Product Class, 2021–2035 (USD Billion) |
  39. TABLE 24 Competitive Benchmarking Matrix, 2026 |
  40. TABLE 25 Company Profiles — Key Players |
  41. TABLE 26 Recent Developments & Strategic Announcements, 2023–2025 |
  42. TABLE 27 Report Scope & Methodology Summary |
  43. TABLE 28 Detailed Sources & Citations Index
  44. 16 LIST OF FIGURES |
  45. FIGURE 1 Market Dynamics — Drivers, Restraints and Opportunities Snapshot |
  46. FIGURE 2 Industry Value Chain Analysis |
  47. FIGURE 3 Porter's Five Forces Analysis |
  48. FIGURE 4 Global Market Size Trend, 2021–2035 (USD Billion) |
  49. FIGURE 5 Year-over-Year Growth Trajectory, 2022–2035 |
  50. FIGURE 6 Market Share by Product Class, 2025 vs 2035 |
  51. FIGURE 7 Market Share by Indication, 2025 vs 2035 |
  52. FIGURE 8 Market Share by End User, 2025 |
  53. FIGURE 9 Market Share by Manufacturing Type, 2025 vs 2035 |
  54. FIGURE 10 Market Share by Route of Administration, 2025 vs 2035 |
  55. FIGURE 11 Regional Share Distribution, 2025 |
  56. FIGURE 12 Regional Share Distribution, 2035 |
  57. FIGURE 13 Regional CAGR Comparison, 2026–2035 |
  58. FIGURE 14 Competitive Landscape — Estimated Share Bands, 2026 |
  59. FIGURE 15 Loss-of-Exclusivity Calendar and Revenue at Risk, 2026–2032

Segmentation Quick Reference

DimensionSub-SegmentsDominant SegmentFastest Growing Segment
By Product ClassMonoclonal Antibodies; Recombinant Hormones; Insulin & Insulin Analogues; Fusion Proteins & Anti-Inflammatory Agents; OthersMonoclonal AntibodiesInsulin & Insulin Analogues
By IndicationBlood Disorders; Autoimmune & Chronic Inflammatory; Oncology; Diabetes; Growth Deficiency & OthersAutoimmune & Chronic InflammatoryOncology
By End UserHospitals; Specialty Clinics; Retail & Homecare; OthersHospitalsSpecialty Clinics
By Manufacturing TypeIn-House; Contract ManufacturingIn-HouseContract Manufacturing
By Route of AdministrationIntravenous; Sub-CutaneousIntravenousSub-Cutaneous
By GeographyNorth America; Europe; Asia-Pacific; South America; Middle East & AfricaEuropeAsia-Pacific


Market Segmentation Overview

By Product Class

Sub-SegmentKey Trend
Monoclonal AntibodiesOncology and immunology expiries sustain the largest revenue pool
Recombinant HormonesFertility and growth indications drive steady replacement volumes.
Insulin & Insulin AnaloguesPharmacy-level substitution accelerates uptake post-reclassification
Fusion Proteins & Anti-Inflammatory AgentsEtanercept and aflibercept entries broaden the class.
OthersEnzymes and anticoagulants form a small but expanding tail.


Product class economics diverge sharply. Antibody programmes carry the highest development cost but the largest addressable revenue, while insulins compete on device convenience and supply scale rather than analytical novelty.

By Indication

Sub-SegmentKey Trend
Blood DisordersFilgrastim and epoetin substitution now near saturation in Europe
Autoimmune & Chronic InflammatoryVolume growth outpaces value growth as erosion deepens.
OncologyCheckpoint inhibitor expiries create the decade's largest opportunity.
DiabetesInsulin adoption widens across public procurement systems.
Growth Deficiency & OthersSomatropin and fertility agents supply niche stability.


Indication mix is shifting from mature inflammatory franchises toward oncology, where the value at risk after 2028 dwarfs anything the sector has absorbed to date.

By End User

Sub-SegmentKey Trend
HospitalsInfusion-administered products anchor the largest spending base
Specialty ClinicsReimbursement shifts push oncology care to outpatient settings.
Retail & HomecareAutoinjector formats expand self-administration
OthersAmbulatory and long-term care channels grow modestly.


Care setting migration is the quiet structural story. Every subcutaneous conversion moves revenue out of hospital pharmacy budgets and into clinic and retail channels.

By Manufacturing Type

Sub-SegmentKey Trend
In-HouseVertically integrated developers protect margin and launch timing.
Contract ManufacturingCapital-light entrants secure reserved capacity slots.


Ownership of capacity has become a strategic dividing line. Integrated players control launch sequencing; outsourced developers trade that control for lower fixed cost.

By Route of Administration

Sub-SegmentKey Trend
IntravenousOncology infusion protocols sustain the current volume base
Sub-CutaneousDevice conversion releases infusion capacity and wins tenders.


Route is increasingly a competitive variable rather than a clinical constant. Where molecules are equivalent, delivery format decides the award.




Download PDF ×

We do not share your information with anyone. However, we may send you emails based on your report interest from time to time. You may contact us at any time to opt-out.