Biomaterial Market (2026 - 2035)

ID: MRFR/HC/1489-HCR 200 Pages Satyendra Maurya Last Updated: September 15, 2026
Biomaterials Market Research Report: Size, Share, Trend Analysis By Applications (Medical Devices, Tissue Engineering, Drug Delivery, Orthopedics, Wound Care), By Types (Natural Biomaterials, Synthetic Biomaterials, Modified Biomaterials), By Source (Plant-based, Animal-based, Microbial-based), By End-use (Healthcare, Pharmaceuticals, Cosmetics), and By Regional (North America, Europe, South America, Asia Pacific, Middle East and Africa) - Growth Outlook & Industry Forecast 2025 To 2035
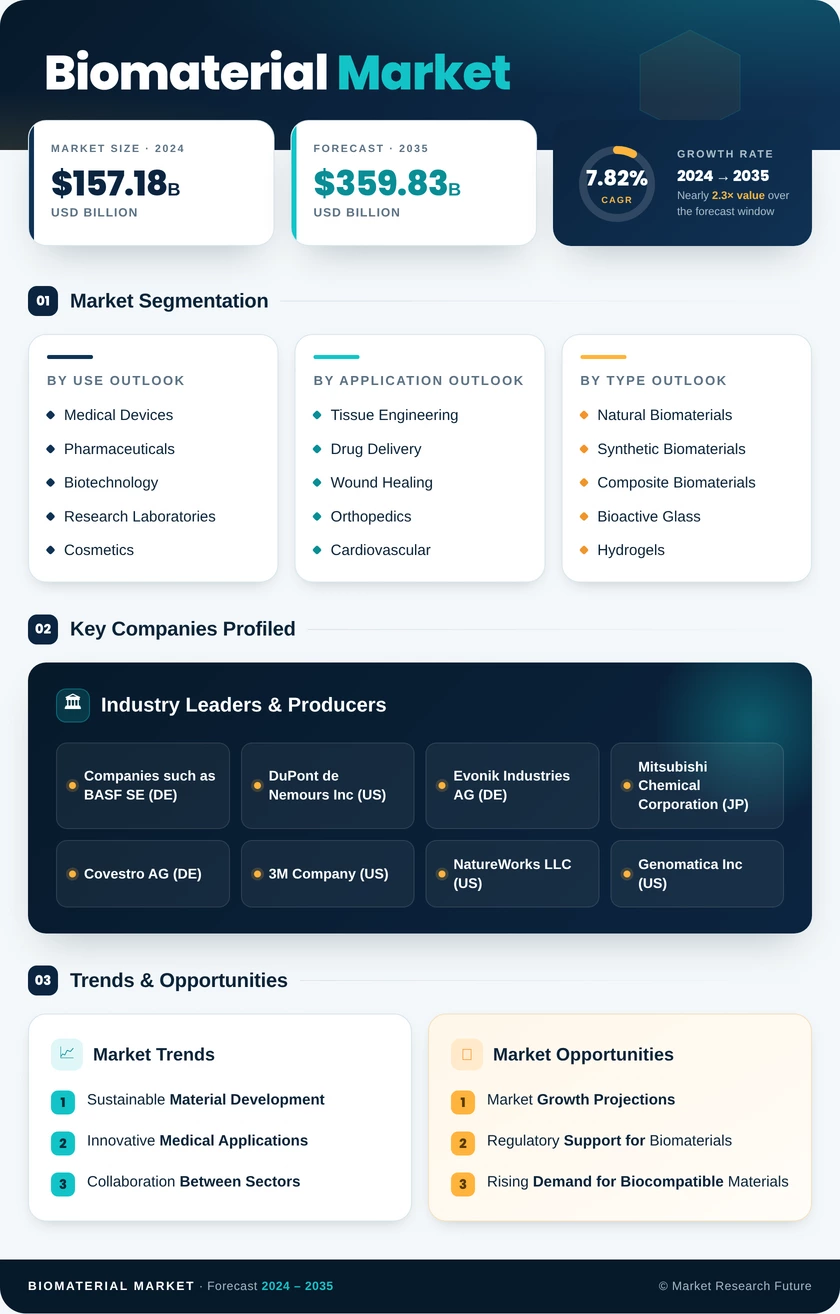
Biomaterial Market
Market Size
Forecast Period2026-2035
CAGR (2026-2035)12.8%
2025 Market SizeUSD 191.5 Billion
2035 Market SizeUSD 636.2 Billion
Key Players
Johnson & Johnson MedTech
Stryker Corporation
Zimmer Biomet
Medtronic plc
BASF SE
Evonik Industries AG
Opportunities
  • Resorbable Fixation Displacing Permanent Hardware
  • Emerging-Market Dental Penetration
  • Registry Data and Outcomes-Linked Contracting
  1. 1 Market Overview |
    1. 1.1 Study Assumptions & Market Definition |
    2. 1.2 Scope of the Study |
    3. 1.3 Research Methodology
  2. 2 Market Summary & Key Report Takeaways |
    1. 2.1 By Material Type |
    2. 2.2 By Origin and Application |
    3. 2.3 By Geography
  3. 3 Global Market Size & Forecast (2021–2035) |
    1. 3.1 Historical Market Size (2021–2025) |
    2. 3.2 Current & Forecast Market Size (2026–2035) |
    3. 3.3 Market Size by Revenue (USD billion) |
    4. 3.4 Year-over-Year Growth Analysis
  4. 4 Driver Impact Analysis |
    1. 4.1 Demographic Load on Musculoskeletal Care |
    2. 4.2 Regenerative Platforms Reach Reimbursement |
    3. 4.3 Regulatory Throughput as a Growth Variable |
    4. 4.4 Point-of-Care Additive Manufacturing
  5. 5 Restraints Impact Analysis |
    1. 5.1 MDR Compliance Economics |
    2. 5.2 Procurement Price Compression |
    3. 5.3 Input Concentration and Qualification Lock-In
  6. 6 Opportunity Analysis |
    1. 6.1 Resorbable Fixation Displacing Permanent Hardware |
    2. 6.2 Emerging-Market Dental Penetration |
    3. 6.3 Registry Data and Outcomes-Linked Contracting |
    4. 6.4 Biofabrication and Bioprinted Tissue Constructs |
    5. 6.5 Waste-Derived and Marine-Sourced Inputs |
    6. 6.6 Industry Value Chain Analysis |
    7. 6.7 Porter's Five Forces Analysis
  7. 7 Regional Market Share & Country-Level Analysis |
    1. 7.1 North America | |
      1. 7.1.1 US | |
      2. 7.1.2 Canada | |
      3. 7.1.3 Mexico |
    2. 7.2 Europe | |
      1. 7.2.1 Germany | |
      2. 7.2.2 UK | |
      3. 7.2.3 France | |
      4. 7.2.4 Italy | |
      5. 7.2.5 Spain | |
      6. 7.2.6 Nordic Countries | |
      7. 7.2.7 Russia | |
      8. 7.2.8 Rest of Europe |
    3. 7.3 Asia-Pacific | |
      1. 7.3.1 China | |
      2. 7.3.2 India | |
      3. 7.3.3 Japan | |
      4. 7.3.4 South Korea | |
      5. 7.3.5 ASEAN | |
      6. 7.3.6 Rest of Asia-Pacific |
    4. 7.4 South America | |
      1. 7.4.1 Brazil | |
      2. 7.4.2 Argentina | |
      3. 7.4.3 Rest of South America |
    5. 7.5 Middle East & Africa | |
      1. 7.5.1 Saudi Arabia | |
      2. 7.5.2 UAE | |
      3. 7.5.3 South Africa | |
      4. 7.5.4 Egypt | |
      5. 7.5.5 Rest of Middle East & Africa
  8. 8 Future Outlook (2026–2035) |
    1. 8.1 Computational Materials Design |
    2. 8.2 Manufacturing Moves Closer to the Patient |
    3. 8.3 Evidence Becomes the Competitive Moat |
    4. 8.4 Sustainability Reporting Reaches the Implant
  9. 9 Market Segmentation Analysis |
    1. 9.1 By Material Type | |
      1. 9.1.1 Metals | |
      2. 9.1.2 Polymeric | |
      3. 9.1.3 Ceramic | |
      4. 9.1.4 Composite | |
      5. 9.1.5 Natural |
    2. 9.2 By Origin | |
      1. 9.2.1 Synthetic | |
      2. 9.2.2 Natural |
    3. 9.3 By Application | |
      1. 9.3.1 Orthopedic | |
      2. 9.3.2 Cardiovascular | |
      3. 9.3.3 Dental | |
      4. 9.3.4 Wound Healing | |
      5. 9.3.5 Neurology | |
      6. 9.3.6 Plastic Surgery | |
      7. 9.3.7 Tissue Engineering & Regeneration | |
      8. 9.3.8 Others
  10. 10 Competitive Landscape |
    1. 10.1 Market Concentration Analysis (2026) |
    2. 10.2 Competitive Benchmarking Matrix |
    3. 10.3 Company Profiles | |
      1. 10.3.1 Johnson & Johnson MedTech | |
      2. 10.3.2 Stryker Corporation | |
      3. 10.3.3 Zimmer Biomet | |
      4. 10.3.4 Medtronic plc | |
      5. 10.3.5 BASF SE | |
      6. 10.3.6 Evonik Industries AG | |
      7. 10.3.7 Corbion N.V. | |
      8. 10.3.8 Royal DSM (Envalior) | |
      9. 10.3.9 Institut Straumann AG | |
      10. 10.3.10 CAM Bioceramics B.V. | |
      11. 10.3.11 Enovis Corporation | |
      12. 10.3.12 Berkeley Advanced Biomaterials
  11. 11 Recent News & Developments
  12. 12 Report Scope & Methodology |
    1. 12.1 Study Period & Base Year |
    2. 12.2 Data Sources & Triangulation |
    3. 12.3 Abbreviations
  13. 13 Detailed Sources & Citations
  14. 14 Frequently Asked Questions
  15. 15 LIST OF TABLES |
  16. TABLE 1 Global Biomaterials Market Size & Forecast, by Revenue (USD billion), 2021–2035 |
  17. TABLE 2 Global Biomaterials Market – Year-over-Year Growth Analysis, 2021–2035 |
  18. TABLE 3 Driver Impact Analysis – Estimated Contribution to Growth, 2026–2035 |
  19. TABLE 4 Restraint Impact Analysis – Estimated Drag on Growth, 2026–2035 |
  20. TABLE 5 Global Biomaterials Market Size, by Material Type, 2021–2035 (USD billion) |
  21. TABLE 6 Global Biomaterials Market Size, by Origin, 2021–2035 (USD billion) |
  22. TABLE 7 Global Biomaterials Market Size, by Application, 2021–2035 (USD billion) |
  23. TABLE 8 Global Biomaterials Market Size, by Region, 2021–2035 (USD billion) |
  24. TABLE 9 Regional Summary – Share, Value and Investment Themes, 2025 |
  25. TABLE 10 North America Biomaterials Market Size, by Country, 2021–2035 (USD billion) |
  26. TABLE 11 Europe Biomaterials Market Size, by Country, 2021–2035 (USD billion) |
  27. TABLE 12 Asia-Pacific Biomaterials Market Size, by Country, 2021–2035 (USD billion) |
  28. TABLE 13 South America Biomaterials Market Size, by Country, 2021–2035 (USD billion) |
  29. TABLE 14 Middle East & Africa Biomaterials Market Size, by Country, 2021–2035 (USD billion) |
  30. TABLE 15 North America Biomaterials Market Size, by Material Type, 2021–2035 (USD billion) |
  31. TABLE 16 North America Biomaterials Market Size, by Application, 2021–2035 (USD billion) |
  32. TABLE 17 Europe Biomaterials Market Size, by Material Type, 2021–2035 (USD billion) |
  33. TABLE 18 Europe Biomaterials Market Size, by Application, 2021–2035 (USD billion) |
  34. TABLE 19 Asia-Pacific Biomaterials Market Size, by Material Type, 2021–2035 (USD billion) |
  35. TABLE 20 Asia-Pacific Biomaterials Market Size, by Application, 2021–2035 (USD billion) |
  36. TABLE 21 South America Biomaterials Market Size, by Material Type, 2021–2035 (USD billion) |
  37. TABLE 22 Middle East & Africa Biomaterials Market Size, by Material Type, 2021–2035 (USD billion) |
  38. TABLE 23 US Biomaterials Market Size, by Application, 2021–2035 (USD billion) |
  39. TABLE 24 China Biomaterials Market Size, by Application, 2021–2035 (USD billion) |
  40. TABLE 25 Germany Biomaterials Market Size, by Application, 2021–2035 (USD billion) |
  41. TABLE 26 Japan Biomaterials Market Size, by Origin, 2021–2035 (USD billion) |
  42. TABLE 27 Competitive Benchmarking Matrix – Global Biomaterials Market, 2026 |
  43. TABLE 28 Company Profiles – Key Players, Global Biomaterials Market |
  44. TABLE 29 Recent Developments & Strategic Announcements, 2023–2025 |
  45. TABLE 30 Report Scope & Methodology Summary |
  46. TABLE 31 Detailed Sources & Citations Index
  47. 16 LIST OF FIGURES |
  48. FIGURE 1 Global Biomaterials Market – Market Dynamics Overview (Drivers, Restraints, Opportunities) |
  49. FIGURE 2 Industry Value Chain Analysis – Feedstock to Finished Implant |
  50. FIGURE 3 Porter's Five Forces Analysis – Global Biomaterials Market |
  51. FIGURE 4 Global Market Size Trend & Forecast, 2021–2035 (USD billion) |
  52. FIGURE 5 Year-over-Year Growth Rate Trend, 2022–2035 (%) |
  53. FIGURE 6 Market Share by Material Type, 2025 vs 2035 (%) |
  54. FIGURE 7 Market Share by Origin, 2025 vs 2035 (%) |
  55. FIGURE 8 Market Share by Application, 2025 vs 2035 (%) |
  56. FIGURE 9 Regional Market Share Distribution, 2025 (%) |
  57. FIGURE 10 Regional CAGR Comparison, 2026–2035 (%) |
  58. FIGURE 11 North America Country-Level Share Breakdown, 2025 (%) |
  59. FIGURE 12 Asia-Pacific Country-Level Growth Comparison, 2026–2035 (%) |
  60. FIGURE 13 Competitive Landscape – Estimated Revenue Share Bands, 2026 |
  61. FIGURE 14 Competitive Positioning Matrix – Portfolio Breadth vs Evidence Depth |
  62. FIGURE 15 Driver Impact Contribution Chart, 2026–2035 |
  63. FIGURE 16 Restraint Drag Contribution Chart, 2026–2035

Segmentation Quick Reference

DimensionSub-SegmentsDominant SegmentFastest Growing Segment
By Material TypeMetals, Polymeric, Ceramic, Composite, NaturalPolymericNatural
By OriginSynthetic, NaturalSyntheticNatural
By ApplicationOrthopedic, Cardiovascular, Dental, Wound Healing, Neurology, Plastic Surgery, Tissue Engineering & Regeneration, OthersOrthopedicTissue Engineering & Regeneration
By GeographyNorth America, Europe, Asia-Pacific, South America, Middle East & AfricaNorth AmericaAsia-Pacific


Market Segmentation Overview

By Material Type

Sub-SegmentKey Trend
MetalsTitanium lattice and porous tantalum displacing solid cobalt-chrome in load-bearing reconstruction
PolymericHighly cross-linked polyethylene and PEEK extending into spinal and extremity indications
CeramicZirconia gaining dental share on aesthetics and metal-sensitivity avoidance.
CompositeRadiolucent carbon-fibre reinforced constructs improving post-operative imaging clarity.
NaturalCollagen, chitosan and alginate scaling on wound-care demand and recovered-feedstock scoring


Material choice is increasingly dictated by imaging compatibility and revision economics rather than raw mechanical performance. Surgeons accept modest strength trade-offs when a material improves post-operative assessment or eliminates a removal procedure, and that preference is reshaping specification sheets across orthopedics.

By Origin

Sub-SegmentKey Trend
SyntheticBatch reproducibility and predictable regulatory dossiers sustaining specification dominance
NaturalImproved decellularisation and standardisation narrowing the consistency gap against synthetics


Origin selection is a regulatory decision as much as a clinical one. Manufacturers weigh the bioactivity advantage of tissue-derived inputs against the validation overhead donor variability imposes, and processing improvements are steadily shifting that calculus toward natural sources.

By Application

Sub-SegmentKey Trend
OrthopedicArthroplasty volume growth locked in by demographic ageing across OECD and China.
CardiovascularPolymer-based stent and valve refresh cycles driving repeat specification
DentalEmerging-economy penetration expanding faster than mature-market replacement demand.
Wound HealingDiabetic and pressure ulcer burden supporting advanced dressing and matrix adoption
NeurologyEncapsulation polymers and dural repair matrices tied to neurostimulation growth
Plastic SurgerySoft-tissue matrices and dermal fillers benefiting from reconstruction volume
Tissue Engineering & RegenerationReimbursement codes maturing in the US, Japan and South Korea
OthersOphthalmic lenses and drug-delivery carriers forming a stable specialty base.


Application mix determines margin far more than headline volume. Orthopedics supplies scale but faces the sharpest procurement compression, while regenerative and neurological applications retain pricing power because clinical alternatives remain limited.

By Geography

Sub-SegmentKey Trend
North AmericaReimbursement depth and Breakthrough pathway sustaining premium price realisation
EuropeMDR remediation costs and circular-procurement scoring reshaping supplier eligibility
Asia-PacificVolume expansion under insurance broadening, offset by centralised price compression
South AmericaPublic tender scale in Brazil paired with currency-driven margin volatility
Middle East & AfricaSovereign hospital programmes and localisation mandates concentrating opportunity in the Gulf


Geographic strategy now hinges on whether a supplier can operate profitably under two incompatible pricing regimes simultaneously. Firms that segment portfolios by region — premium evidence-backed lines for North America and Europe, cost-engineered platforms for tendered Asian and South American volume — outperform those attempting a single global price architecture.




Download PDF ×

We do not share your information with anyone. However, we may send you emails based on your report interest from time to time. You may contact us at any time to opt-out.