• Cat-intel
  • MedIntelliX
  • Resources
  • About Us
  • Hero Background
    English
    Chinese
    French
    Japanese
    Korean
    German
    Spanish

    Avascular Necrosis Market Size

    ID: MRFR/MED/4673-CR
    539 Pages
    Kinjoll Dey
    June 2018

    Avascular Necrosis Market Research Report Information By Type (Trauma Related Avascular Necrosis (AVN) and Non-Trauma Related Avascular Necrosis (AVN)0, By Treatment (Nonsteroidal Anti-Inflammatory Drugs (NSAIDS), Cholesterol Lowing Drugs, Osteoporosis Drugs, Blood Thinners, and Others), By Diagnosis (Imaging, Biopsy, CT Scan, PET and X- Ray), By End User (Hospital Pharmacies, Retail Pharmacies...

    Share:
    Download PDF ×

    We do not share your information with anyone. However, we may send you emails based on your report interest from time to time. You may contact us at any time to opt-out.

    Avascular Necrosis Market Infographic
    $ 4,950.0
    $ 5,950.0
    $ 7,250.0

    Avascular Necrosis Size

    Avascular Necrosis Market Growth Projections and Opportunities

    Avascular necrosis, also known as osteonecrosis or ischemic bone necrosis, is a condition where bone tissue dies due to a lack of blood supply. This can cause tiny breaks in the bone and eventually lead to its collapse. It's more common in people aged 30 to 50, and in recent years, the occurrences of this condition have been increasing.

    This rise in avascular necrosis cases has resulted in a higher demand for therapeutic surgeries to address this condition. This increase in demand for surgeries is directly linked to the growing instances of avascular necrosis. The prevalence of avascular necrosis has seen a rise in recent years, often associated with other diseases like cancer, further emphasizing the importance of addressing this medical condition.

    According to a study published in the Journal of the Korean Association of Oral and Maxillofacial Surgeons, the prevalence of bisphosphonate-related necrosis was estimated to be around 2.6% in 2013. The increase in cases related to bisphosphonate-related necrosis has also contributed to the growth of the market for treatments targeting avascular necrosis.

    Looking at the market projection, the global avascular necrosis market is anticipated to expand significantly, reaching an estimated market value of USD 1087.1 million by 2024. This is a notable increase from USD 699.6 million in 2017, reflecting a substantial growth trajectory. Forecasts suggest that the number of avascular procedures performed will rise from 1,314,107 in 2016 to an estimated 2,913,014 by 2024, indicating a substantial increase in addressing this condition.

    The growing demand for therapeutic procedures and treatments for avascular necrosis is driving the market's growth. The rise in cases, especially those linked to conditions like bisphosphonate-related necrosis, is amplifying the need for effective treatments and surgeries to address this condition. This increased demand for procedures and therapies is expected to sustain and further fuel the growth of the avascular necrosis market in the foreseeable future.

    Avascular Necrosis Market Size Graph

    Market Summary

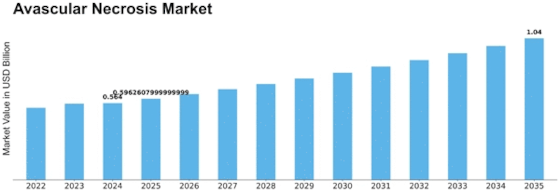
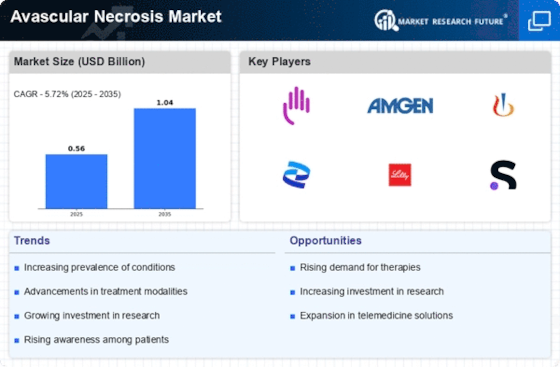
    As per MRFR analysis, the Avascular Necrosis Market Size was estimated at 0.564 USD Billion in 2024. The Avascular Necrosis industry is projected to grow from 0.5963 in 2025 to 1.04 by 2035, exhibiting a compound annual growth rate (CAGR) of 5.72 during the forecast period 2025 - 2035.

    Key Market Trends & Highlights

    <p>The Avascular Necrosis Market is poised for growth driven by technological advancements and increasing awareness.</p>

    • Technological advancements in treatment are reshaping the Avascular Necrosis landscape, particularly in North America.
    • Rising awareness and education about Avascular Necrosis are contributing to improved patient outcomes in the Asia-Pacific region.
    • Collaborative research efforts are fostering innovation, especially in the trauma-related AVN segment, which remains the largest.
    • The increasing incidence of Avascular Necrosis and advancements in diagnostic techniques are key drivers propelling market growth.

    Market Size & Forecast

    2024 Market Size 0.564 (USD Billion)
    2035 Market Size 1.04 (USD Billion)
    CAGR (2025 - 2035) 5.72%
    Largest Regional Market Share in 2024 North America

    Major Players

    <p>Bristol-Myers Squibb (US), Amgen (US), Novartis (CH), Pfizer (US), Eli Lilly and Company (US), Sanofi (FR), AstraZeneca (GB), Merck & Co. (US), Johnson & Johnson (US)</p>

    Market Trends

    The Avascular Necrosis Market is currently experiencing notable developments driven by a combination of factors including advancements in treatment options and increasing awareness of the condition. Avascular necrosis, characterized by the death of bone tissue due to a lack of blood supply, has garnered attention as healthcare providers and researchers explore innovative therapies. The market appears to be influenced by a growing emphasis on early diagnosis and intervention, which may lead to improved patient outcomes. Furthermore, the integration of technology in treatment modalities, such as regenerative medicine and minimally invasive surgical techniques, seems to enhance the overall management of this condition. In addition, the Avascular Necrosis Market is likely to benefit from collaborative efforts among stakeholders, including pharmaceutical companies, healthcare professionals, and patient advocacy groups. These collaborations may facilitate the development of new drugs and therapies, potentially expanding the treatment landscape. Moreover, the increasing prevalence of risk factors associated with avascular necrosis, such as corticosteroid use and alcohol consumption, suggests a rising demand for effective management strategies. As awareness continues to grow, the market may evolve to address the needs of a diverse patient population, ultimately leading to enhanced therapeutic options and improved quality of life for those affected.

    Technological Advancements in Treatment

    The Avascular Necrosis Market is witnessing a surge in technological innovations that enhance treatment efficacy. Techniques such as stem cell therapy and advanced imaging modalities are being explored to improve diagnosis and management. These advancements may lead to more personalized treatment approaches, potentially increasing patient satisfaction and outcomes.

    Rising Awareness and Education

    There is a growing emphasis on raising awareness about avascular necrosis among healthcare providers and the general public. Educational initiatives aim to inform individuals about risk factors and early symptoms, which could facilitate timely diagnosis and intervention. This trend may contribute to a more proactive approach in managing the condition.

    Collaborative Research Efforts

    The Avascular Necrosis Market is likely to benefit from increased collaboration among various stakeholders, including researchers, pharmaceutical companies, and healthcare institutions. Such partnerships may accelerate the development of novel therapies and clinical trials, ultimately enhancing the treatment landscape for patients suffering from this condition.

    The rising prevalence of avascular necrosis, coupled with advancements in diagnostic techniques and treatment options, suggests a growing need for comprehensive management strategies in the healthcare system.

    Centers for Disease Control and Prevention (CDC)

    Avascular Necrosis Market Market Drivers

    Increasing Geriatric Population

    The increasing geriatric population is a crucial driver for the Avascular Necrosis Market. As individuals age, the risk of developing AVN escalates due to factors such as decreased bone density and the prevalence of comorbidities. The World Health Organization projects that the number of people aged 60 years and older will double by 2050, which may lead to a corresponding rise in AVN cases. This demographic shift necessitates the development of age-appropriate treatment strategies and rehabilitation programs. Healthcare providers are likely to focus on managing AVN in older adults, thereby driving demand for specialized therapies. Consequently, the Avascular Necrosis Market is expected to expand as it adapts to the needs of an aging population.

    Advancements in Diagnostic Techniques

    Advancements in diagnostic techniques are significantly influencing the Avascular Necrosis Market. Enhanced imaging modalities, such as MRI and CT scans, allow for earlier and more accurate detection of AVN, which is crucial for effective treatment. The ability to identify AVN in its initial stages can lead to better patient outcomes and reduced healthcare costs. As diagnostic technologies continue to evolve, they are expected to facilitate timely interventions, thereby increasing the demand for therapeutic options. The integration of artificial intelligence in imaging analysis further augments diagnostic accuracy, potentially expanding the patient base seeking treatment. Consequently, the Avascular Necrosis Market is poised for growth as healthcare providers increasingly adopt these advanced diagnostic tools.

    Enhanced Patient Education and Awareness

    Enhanced patient education and awareness are vital drivers for the Avascular Necrosis Market. Increased awareness about AVN among patients and healthcare professionals leads to earlier diagnosis and treatment, which can significantly improve outcomes. Educational initiatives, including workshops and informational campaigns, are being implemented to inform the public about the risk factors and symptoms of AVN. As patients become more informed, they are more likely to seek medical advice and treatment, thereby increasing the demand for therapeutic options. Furthermore, healthcare providers are recognizing the importance of patient education in managing AVN, which may lead to improved adherence to treatment protocols. This growing emphasis on education is likely to foster a more proactive approach to AVN management, positively impacting the Avascular Necrosis Market.

    Increasing Incidence of Avascular Necrosis

    The rising incidence of avascular necrosis (AVN) is a pivotal driver for the Avascular Necrosis Market. Factors such as lifestyle changes, increased alcohol consumption, and the prevalence of conditions like obesity and corticosteroid use contribute to the growing number of AVN cases. Recent estimates suggest that approximately 10,000 to 20,000 new cases of AVN are diagnosed annually, indicating a substantial patient population requiring treatment. This increasing incidence necessitates the development of innovative therapies and interventions, thereby propelling market growth. As healthcare systems adapt to manage this rising burden, the Avascular Necrosis Market is likely to witness enhanced investment in research and development, leading to the introduction of novel treatment modalities.

    Growing Investment in Research and Development

    Growing investment in research and development (R&D) is a significant driver for the Avascular Necrosis Market. Pharmaceutical companies and research institutions are increasingly focusing on developing novel therapies and treatment protocols for AVN. This trend is underscored by the rising number of clinical trials aimed at evaluating new drugs and surgical techniques. In recent years, the number of clinical trials related to AVN has surged, reflecting a commitment to addressing this challenging condition. Furthermore, government and private funding for AVN research is on the rise, which may lead to breakthroughs in treatment options. As R&D efforts intensify, the Avascular Necrosis Market is likely to benefit from the introduction of innovative therapies that can improve patient outcomes.

    Market Segment Insights

    By Type: Trauma Related AVN (Largest) vs. Non-Trauma Related AVN (Fastest-Growing)

    <p>In the Avascular Necrosis (AVN) Market, the distribution of market share between trauma-related and non-trauma-related segments reveals significant insights. Trauma-related AVN remains the largest segment, attributed to the consistent incidence of traumatic injuries leading to bone damage. This segment accounts for a considerable portion of the overall AVN cases, thus marking its dominance within the market. Conversely, the non-trauma-related segment, while smaller, is gaining traction due to increased awareness and diagnosis of AVN resulting from non-traumatic causes, such as steroid use and alcohol consumption, which are becoming more prevalent in the population.</p>

    <p>Avascular Necrosis: Trauma Related (Dominant) vs. Non-Trauma Related (Emerging)</p>

    <p>The trauma-related Avascular Necrosis (AVN) segment is characterized by its strong association with various traumatic injuries that can lead to compromised blood supply to bones. It encompasses conditions linked to fractures, dislocations, and other physical injuries, leading to a relatively stable demand for treatment options. In contrast, the non-trauma-related AVN segment is emerging as a significant player due to rising cases driven by lifestyle factors and medical interventions. Increased consumption of corticosteroids and complications from diseases like sickle cell disease are contributing to its growth. This segment underscores a shift in patient demographics and medical attention, reflecting broader health trends and the evolving understanding of AVN.</p>

    By Treatment: Nonsteroidal Anti-Inflammatory Drugs (NSAIDS) (Largest) vs. Osteoporosis Drugs (Fastest-Growing)

    <p>In the Avascular Necrosis Market, Nonsteroidal Anti-Inflammatory Drugs (NSAIDS) have established themselves as the largest segment, capturing a significant share of the overall treatment landscape. These drugs are widely prescribed due to their effectiveness in reducing pain and inflammation associated with the condition, making them the go-to choice for many physicians and patients alike. Following NSAIDS, the other segments, including Cholesterol Lowering Drugs and Blood Thinners, contribute to the market but find themselves with a comparatively smaller share as they serve specific aspects of the disease treatment.</p>

    <p>NSAIDS (Dominant) vs. Osteoporosis Drugs (Emerging)</p>

    <p>Nonsteroidal Anti-Inflammatory Drugs (NSAIDS) dominate the Avascular Necrosis treatment segment, known for their robust anti-inflammatory properties and ability to manage pain effectively. Their well-established use in clinical practice positions them as a preferred option for management of avascular necrosis symptoms, consequently enhancing patient quality of life. In contrast, Osteoporosis Drugs represent an emerging segment, as they are increasingly recognized for their potential role in treating avascular necrosis. As more research uncovers their benefits in enhancing bone density and preventing further joint deterioration, the demand for osteoporosis medications is set to rise, elevating their role in treatment strategies.</p>

    By Diagnosis: X-Ray (Largest) vs. MRI (Fastest-Growing)

    <p>In the Avascular Necrosis Market, the Diagnosis segment shows a robust distribution among various imaging modalities. X-Ray remains the dominant diagnostic tool due to its wide availability and cost-effectiveness, capturing a significant portion of the market. Meanwhile, MRI is emerging as a key player, increasingly adopted for its superior accuracy in detecting early signs of avascular necrosis, suggesting a shift towards more advanced imaging technologies among healthcare providers. Growth trends within the Diagnosis segment are driven by advancements in imaging technology and an increasing emphasis on early diagnosis. As awareness of avascular necrosis grows, alongside a rise in risk factors such as corticosteroid use and trauma, demand for accurate diagnostic methods continues to expand. MRI, in particular, is witnessing a rapid adoption rate, positioning it as the fastest-growing modality in this segment, highlighting a transition toward more sophisticated healthcare solutions.</p>

    <p>Imaging: X-Ray (Dominant) vs. MRI (Emerging)</p>

    <p>In the context of the Avascular Necrosis Market, X-Ray is recognized as the dominant imaging modality due to its affordability, ease of use, and speed of operation. It is often the first step in the diagnostic process, allowing healthcare professionals to quickly assess bone structure. Conversely, MRI is gaining traction as an emerging technique, celebrated for its ability to provide detailed images of soft tissue and bone marrow. Its sensitivity to early pathological changes makes it indispensable in diagnosing avascular necrosis at earlier stages, thereby enabling timely intervention. The increasing prevalence of chronic conditions and advancements in MRI technology underscore its growing relevance in clinical settings.</p>

    By End User: Hospital Pharmacies (Largest) vs. Retail Pharmacies (Fastest-Growing)

    <p>In the Avascular Necrosis Market, hospital pharmacies constitute the largest segment, primarily due to their critical role in managing acute cases and facilitating specialized treatment protocols. These pharmacies typically provide access to a wider range of focused therapies and medications, contributing significantly to their market share. Retail pharmacies, while smaller in comparison, are experiencing notable growth as they expand their offerings to include more specialized medication for chronic conditions like avascular necrosis, thus capturing a portion of patients currently seeking alternative options. The growth trends indicate a shift towards retail pharmacies that focus on patient-centered care, reflecting a rising patient preference for convenience and accessibility in obtaining medications. Online pharmacies are also emerging as a viable option, driven by the increasing digitization of healthcare and consumer demand for easy access to medications. Their growth is propelled by the pandemic's impact on shopping behaviors, paving the way for a more engaged and connected patient experience in obtaining treatment for avascular necrosis.</p>

    <p>Hospital Pharmacies (Dominant) vs. Retail Pharmacies (Emerging)</p>

    <p>Hospital pharmacies play a dominant role in the Avascular Necrosis Market by providing specialized care and direct access to therapies essential for managing the disease effectively. They are integral in facilitating patient treatment plans that require careful monitoring and frequent adjustments based on patient responses. On the other hand, retail pharmacies are becoming an emerging force as they adapt to consumer needs by offering more personalized services and specialized medications. These pharmacies leverage their local presence and customer relationships to foster loyalty and provide rapid access to treatment. Their growth is also supported by marketing strategies that emphasize convenience, such as customizable prescriptions and easy refill options, further enhancing their competitive positioning against traditional hospital pharmacies.</p>

    Get more detailed insights about Avascular Necrosis Market Research Report – Forecast to 2032

    Regional Insights

    North America : Leading Market for Innovation

    North America is the largest market for Avascular Necrosis, holding approximately 45% of the global market share. The region benefits from advanced healthcare infrastructure, high prevalence of risk factors such as corticosteroid use, and increasing awareness of the condition. Regulatory support from agencies like the FDA further drives market growth, facilitating the approval of innovative therapies and treatments. The United States is the primary contributor, with significant investments from key players like Bristol-Myers Squibb, Pfizer, and Amgen. The competitive landscape is characterized by a focus on research and development, with companies striving to introduce novel therapies. Canada also plays a vital role, contributing to the market with its healthcare policies that support patient access to treatments. Overall, the region's robust pharmaceutical sector positions it as a leader in Avascular Necrosis management.

    Europe : Emerging Market with Growth Potential

    Europe is an emerging powerhouse in the Avascular Necrosis market, accounting for approximately 30% of the global share. The region is witnessing a rise in demand for effective treatments, driven by an aging population and increasing incidence of conditions leading to AVN. Regulatory frameworks, such as the European Medicines Agency's guidelines, are fostering innovation and expediting the approval process for new therapies. Leading countries include Germany, France, and the UK, where healthcare systems are increasingly prioritizing the management of Avascular Necrosis. Key players like Novartis and Sanofi are actively involved in research and development, enhancing their product portfolios. The competitive landscape is marked by collaborations and partnerships aimed at improving treatment outcomes. The region's commitment to healthcare innovation positions it favorably for future growth in the Avascular Necrosis market.

    Asia-Pacific : Rapidly Growing Market Segment

    Asia-Pacific is rapidly emerging as a significant market for Avascular Necrosis, holding around 20% of the global market share. The region's growth is fueled by increasing healthcare expenditure, rising awareness of the disease, and a growing population at risk. Countries like China and India are witnessing a surge in demand for effective treatments, supported by government initiatives aimed at improving healthcare access. China is the largest market in the region, with a focus on expanding healthcare infrastructure and increasing investment in pharmaceutical research. India follows closely, with a growing number of local and international players entering the market. The competitive landscape is characterized by a mix of established companies and startups, all striving to innovate and provide effective solutions for Avascular Necrosis management. This dynamic environment is expected to drive further growth in the coming years.

    Middle East and Africa : Emerging Market with Challenges

    The Middle East and Africa region represents a smaller segment of the Avascular Necrosis market, accounting for approximately 5% of the global share. The market is challenged by limited healthcare infrastructure and varying levels of access to treatment. However, increasing awareness and government initiatives aimed at improving healthcare services are driving gradual growth in the region. Countries like South Africa and the UAE are leading the way, with efforts to enhance healthcare systems and access to innovative treatments. The presence of key players is growing, although the market remains competitive with local firms also entering the space. The region's unique challenges present opportunities for growth, particularly as healthcare policies evolve to better address the needs of patients suffering from Avascular Necrosis.

    Key Players and Competitive Insights

    The Avascular Necrosis Market is characterized by a complex interplay of competitive dynamics, driven by a growing demand for innovative treatment options and a heightened focus on patient-centric care. Key players such as Bristol-Myers Squibb (US), Amgen (US), and Novartis (CH) are strategically positioning themselves through a combination of research and development, partnerships, and regional expansions. Bristol-Myers Squibb (US) has been particularly focused on enhancing its portfolio through collaborations aimed at advancing therapies for bone health, while Amgen (US) emphasizes its commitment to innovation in biologics, which could potentially address the underlying causes of avascular necrosis. Novartis (CH), on the other hand, appears to be leveraging its extensive research capabilities to explore novel treatment pathways, thereby shaping a competitive environment that is increasingly centered on advanced therapeutic solutions.

    In terms of business tactics, companies are increasingly localizing manufacturing and optimizing supply chains to enhance efficiency and responsiveness to market demands. The Avascular Necrosis Market is moderately fragmented, with a mix of established pharmaceutical giants and emerging biotech firms. This fragmentation allows for diverse approaches to treatment, yet the collective influence of key players like Pfizer (US) and Eli Lilly and Company (US) is significant, as they drive innovation and set industry standards through their extensive research initiatives and market presence.

    In August 2025, Pfizer (US) announced a strategic partnership with a leading biotech firm to co-develop a novel gene therapy aimed at treating avascular necrosis. This collaboration is expected to leverage cutting-edge technology to address the disease's root causes, potentially revolutionizing treatment options. The strategic importance of this partnership lies in Pfizer's ability to combine its vast resources with innovative approaches, thereby enhancing its competitive edge in the market.

    In September 2025, Eli Lilly and Company (US) launched a new clinical trial for a promising drug candidate targeting avascular necrosis, which has shown encouraging results in early-stage studies. This move underscores Eli Lilly's commitment to advancing its pipeline and addressing unmet medical needs. The trial's outcomes could significantly influence the company's market positioning, particularly if the drug demonstrates efficacy in larger populations.

    In October 2025, Novartis (CH) unveiled a new initiative focused on digital health solutions aimed at improving patient outcomes in avascular necrosis. By integrating digital tools into treatment protocols, Novartis seeks to enhance patient engagement and adherence, which may lead to better health outcomes. This initiative reflects a broader trend towards digitalization in healthcare, indicating that Novartis is keen on staying ahead in a rapidly evolving landscape.

    As of October 2025, current competitive trends in the Avascular Necrosis Market are increasingly defined by digitalization, sustainability, and the integration of artificial intelligence in treatment development. Strategic alliances are becoming pivotal, as companies recognize the value of collaboration in driving innovation and improving patient care. Looking ahead, competitive differentiation is likely to evolve from traditional price-based competition towards a focus on technological advancements, innovative therapies, and reliable supply chains, suggesting a transformative shift in how companies approach market challenges.

    Key Companies in the Avascular Necrosis Market market include

    Industry Developments

    Future Outlook

    Avascular Necrosis Market Future Outlook

    <p>The Avascular Necrosis Market is projected to grow at a 5.72% CAGR from 2024 to 2035, driven by advancements in treatment options and increasing awareness.</p>

    New opportunities lie in:

    • <p>Development of targeted drug delivery systems for localized treatment.</p>
    • <p>Expansion of telehealth services for remote patient monitoring.</p>
    • <p>Investment in regenerative medicine technologies to enhance recovery outcomes.</p>

    <p>By 2035, the Avascular Necrosis Market is expected to achieve substantial growth, reflecting evolving treatment paradigms.</p>

    Market Segmentation

    Avascular Necrosis Market Type Outlook

    • Trauma Related Avascular Necrosis (AVN)
    • Non-Trauma Related Avascular Necrosis (AVN)

    Avascular Necrosis Market End User Outlook

    • Hospital Pharmacies
    • Retail Pharmacies
    • Online Pharmacies

    Avascular Necrosis Market Diagnosis Outlook

    • Imaging
    • Biopsy
    • CT Scan
    • PET
    • X-Ray

    Avascular Necrosis Market Treatment Outlook

    • Nonsteroidal Anti-Inflammatory Drugs (NSAIDS)
    • Cholesterol Lowing Drugs
    • Osteoporosis Drugs
    • Blood Thinners
    • Others

    Report Scope

    Avascular Necrosis Report Scope

    Report Attribute/Metric Details
    Market Size 2024 USD 0.564 Billion
    Market Size 2035 1.04 (Value (USD Billion))
    Compound Annual Growth Rate (CAGR) 5.72% (2025 - 2035)
    Base Year 2024
    Market Forecast Period 2025 - 2035
    Historical Data 2018- 2022
    Market Forecast Units Value (USD Billion)
    Report Coverage Revenue Forecast, Market Competitive Landscape, Growth Factors, and Trends
    Segments Covered Type, Treatment End User, and Region
    Geographies Covered North America, Europe, Asia Pacific, and the Rest of the World
    Countries Covered The US, Canada, German, France, UK, Italy, Spain, China, Japan, India, Australia, South Korea, and Brazil
    Key Companies Profiled Novartis AGPfizer Inc.Teva Pharmaceutical Industries Ltd.Mylan N.V.Zimmer Biomet Merck & Co. Inc.Enzo Biochem Inc.Atnahs Bone Therapeutics SAVericel Corporation
    Key Market Opportunities Growing technology
    Key Market Dynamics Increase in fatal accidents
    Market Size 2025 0.60 (Value (USD Billion))

    Market Highlights

    Author

    Kinjoll Dey
    Research Analyst Level I

    She holds an experience of about 6+ years in market research and business consulting, working under the spectrum of information communication technology, telecommunications and semiconductor domains. aarti conceptualizes and implements a scalable business strategy and provides strategic leadership to the clients. her expertise lies in market estimation, competitive intelligence, pipeline analysis, customer assessment, etc.

    Leave a Comment

    Latest Comments

    John Doe
    john@example.com

    This is a great article! Really helped me understand the topic better.

    Posted on July 23, 2025, 10:15 AM
    Jane Smith
    jane@domain.com

    Thanks for sharing this. I’ve bookmarked it for later reference.

    Posted on July 22, 2025, 7:45 PM

    FAQs

    What is the projected growth of the Avascular Necrosis market?

    The Avascular Necrosis market is the expected increase in total market value of 1.04 USD billion over a defined forecast period 2025–2035. It is driven by factors such as demand trends, technological advances, regulatory changes, and geographic expansion.

    What is the size of the Avascular Necrosis market?

    Avascular Necrosis market size was valued at approximately 0.56 billion USD in 2024. This figure will reach 1.04 billion USD covering all regions (America, Europe, Asia, MEA and ROW), focusing its segments / services / distribution channels till 2035.

    What is the CAGR of the Avascular Necrosis market?

    Avascular Necrosis market is expected to grow at a CAGR of 5.72% between 2025 and 2035.

    How much will the Avascular Necrosis market be worth by 2035?

    Avascular Necrosis market is expected to be worth of 1.04 billion USD, reflecting growth driven by usage, technology and global demands by the end of 2035.

    How will the Avascular Necrosis market perform over the next 10 years?

    Over the next 10 years the Avascular Necrosis market is expected to shift from usd billion 0.56 to 1.04 billion USD, led by adoption of advanced tech, demographic trends, regulatory approvals, with potential headwinds from 2025 to 2035.

    Which region held the largest market share in the Avascular Necrosis market?

    North America had the largest share in the market

    1. Executive Summary
    2. Market Introduction
      1. Scope Of Study 32
      2. Research Objective 32
      3. List
      4. Of Assumptions 32
      5. Market Structure 33
    3. Research Methodology
      1. Research Process 35
      2. Primary Research 36
      3. 3.3
      4. Secondary Research 37
      5. Market Size Estimation 37
      6. Forecast
      7. Model 38
    4. Market Dynamics
      1. Introduction 40
        1. Increasing Awareness Along With The High Prevalence
        2. Rising Preference Of Surgeries
        3. Rising Preference Of Bone Grafting Surgical
        4. Consolidation
        5. Technological Advancements
      2. 4.2
      3. Drivers 41
      4. Of The Avascular Necrosis Disease 41
      5. To Cure Osteonecrosis 41
      6. Procedures With The Less Pain Substitute Procedures 41
      7. Of Large Healthcare Providers In The U.S. 42
      8. In The Development Of Surgical Implants 42
      9. Restraints 42
        1. The High Cost Of Surgical Procedures And Related Side Effects 42
        2. Worsening Regulatory Landscape And Growing Cost Of Noncompliance In Developed
      10. Countries 43
      11. Opportunities 43
        1. Growing Demand For
      12. Non-Invasive Treatments For Faster Recovery 43
      13. Technology Trends
        1. Acceptance Of Synthetic Bone-Graft Over Natural
        2. Nanotechnology 44
        3. Rising Demand For Incorporating
        4. Development
        5. Customized Degradable
      14. & Assessment 44
      15. Ones 44
      16. Recombinant DNA Technology In Surgical Implants 44
      17. Of Titanium-Foam Implant For Bone Grafting 44
      18. Implants 44
    5. Market Factor Analysis
      1. Porter’s Five
        1. Bargaining Power Of Suppliers 46
        2. Threat Of New Entrants 47
        3. Threat Of Substitutes 47
        4. Intensity Of Rivalry 48
      2. Forces Model 46
      3. 5.1.2
      4. Bargaining Power Of Buyers 47
      5. Value Chain Analysis 48
        1. Research & Development 48
        2. Manufacturing 49
        3. Distribution 49
        4. Post-Sales Monitoring 49
      6. 5.2.4
      7. Marketing & Sales 49
      8. 5.3
      9. Epidemiology Of Avascular Necrosis 49
    6. Avascular Necrosis Market, By
      1. Type
      2. Introduction 54
      3. Non-Trauma Related Avascular
        1. Age Group 56
        2. Causes 58
      4. Necrosis 55
      5. Disease 59
      6. Abuse 60
      7. Trauma-Related Avascular
      8. Necrosis 62
    7. Avascular Necrosis Market, By Site
      1. Introduction
      2. 64
      3. Hip Bone 65
      4. Knee 66
      5. Shoulder 67
    8. Avascular Necrosis Market, By Diagnosis
      1. Introduction 69
      2. Imaging 70
        1. X-Ray 72
        2. CT Scan 72
        3. MRI 73
        4. PET 74
      3. Biopsy 74
      4. 9
    9. Avascular Necrosis Market, By Treatment
      1. Introduction 77
      2. Medication 78
        1. Medication By NSAIDs (Non-Steroidal Anti-Inflammatory
        2. Medication By Bisphosphonates 79
        3. Medication
      3. Drugs) 79
      4. By Blood Thinners 80
      5. Electrical Stimulation 81
      6. Gene
      7. Therapy 82
      8. Surgery 82
        1. Core Decompression 83
        2. Osteotomy 84
        3. Bone Graft 85
        4. Arthoplasty
      9. 85
    10. Avascular Necrosis Market, By End-User
      1. Introduction
      2. 88
      3. Hospitals & Clinics 89
      4. Diagnostic Centers
      5. 90
      6. Ambulatory Surgical Centers 91
    11. Global Avascular
    12. Necrosis Market, By Region
      1. Introduction 93
      2. Americas
      3. 103
    13. Avascular Necrosis Market, By Type
      1. Avascular Necrosis
    14. Market, By Site
    15. Avascular Necrosis Market, By Diagnosis
      1. Avascular
    16. Necrosis Market, By Treatment
    17. Avascular Necrosis Market, By End-User
    18. North America 112
    19. Avascular Necrosis Market, By Type
    20. Avascular Necrosis Market, By Site
      1. Avascular Necrosis Market,
      2. By Diagnosis
    21. Avascular Necrosis Market, By Treatment
      1. Avascular
    22. Necrosis Market, By End-User
      1. Avascular Necrosis
    23. U.S. 123
    24. Market, By Type
    25. Avascular Necrosis Market, By Site
      1. Avascular
    26. Necrosis Market, By Diagnosis
    27. Avascular Necrosis Market, By Treatment
    28. Avascular Necrosis Market, By End-User
    29. Canada. 131
    30. Avascular Necrosis Market, By Type
      1. Avascular Necrosis Market,
      2. By Site
    31. Avascular Necrosis Market, By Diagnosis
      1. Avascular
    32. Necrosis Market, By Treatment
    33. Avascular Necrosis Market, By End-User
    34. South America 140
    35. Avascular Necrosis Market, By Type
    36. Avascular Necrosis Market, By Site
      1. Avascular Necrosis Market,
      2. By Diagnosis
    37. Avascular Necrosis Market, By Treatment
      1. Avascular
    38. Necrosis Market, By End-User
      1. Europe 149
      2. Avascular Necrosis
    39. Market, By Type
    40. Avascular Necrosis Market, By Site
      1. Avascular
    41. Necrosis Market, By Diagnosis
    42. Avascular Necrosis Market, By Treatment
    43. Avascular Necrosis Market, By End-User
      1. 160
    44. Western Europe
    45. Avascular Necrosis Market, By Type
      1. Avascular Necrosis
    46. Market, By Site
    47. Avascular Necrosis Market, By Diagnosis
      1. Avascular
    48. Necrosis Market, By Treatment
    49. Avascular Necrosis Market, By End-User
    50. Germany 170
    51. Avascular Necrosis Market, By Type
    52. Avascular Necrosis Market, By Site
    53. Avascular Necrosis Market, By Diagnosis
    54. Avascular Necrosis Market, By Treatment
      1. Avascular Necrosis Market,
      2. By End-User
      3. Avascular Necrosis Market,
      4. By Type
    55. France 179
    56. Avascular Necrosis Market, By Site
      1. Avascular Necrosis
    57. Market, By Diagnosis
    58. Avascular Necrosis Market, By Treatment
    59. Avascular Necrosis Market, By End-User
      1. Avascular
    60. UK 188
    61. Necrosis Market, By Type
    62. Avascular Necrosis Market, By Site
    63. Avascular Necrosis Market, By Diagnosis
      1. Avascular Necrosis Market,
      2. By Treatment
    64. Avascular Necrosis Market, By End-User
      1. 11.3.1.4
      2. Italy 197
    65. Avascular Necrosis Market, By Type
      1. Avascular Necrosis
    66. Market, By Site
    67. Avascular Necrosis Market, By Diagnosis
      1. Avascular
    68. Necrosis Market, By Treatment
    69. Avascular Necrosis Market, By End-User
    70. Spain 206
    71. Avascular Necrosis Market, By Type
    72. Avascular Necrosis Market, By Site
    73. Avascular Necrosis Market, By Diagnosis
    74. Avascular Necrosis Market, By Treatment
      1. Avascular Necrosis Market,
      2. By End-User
      3. Avascular
    75. Rest Of Western Europe 215
    76. Necrosis Market, By Type
    77. Avascular Necrosis Market, By Site
    78. Avascular Necrosis Market, By Diagnosis
      1. Avascular Necrosis Market,
      2. By Treatment
    79. Avascular Necrosis Market, By End-User
      1. 11.3.2
      2. Eastern Europe 224
    80. Avascular Necrosis Market, By Type
      1. Avascular
    81. Necrosis Market, By Site
    82. Avascular Necrosis Market, By Diagnosis
    83. Avascular Necrosis Market, By Treatment
      1. Avascular Necrosis Market,
      2. By End-User
      3. Asia Pacific 232
      4. Avascular Necrosis Market,
      5. By Type
    84. Avascular Necrosis Market, By Site
      1. Avascular Necrosis
    85. Market, By Diagnosis
    86. Avascular Necrosis Market, By Treatment
    87. Avascular Necrosis Market, By End-User
      1. Avascular
    88. Japan 243
    89. Necrosis Market, By Type
    90. Avascular Necrosis Market, By Site
    91. Avascular Necrosis Market, By Diagnosis
      1. Avascular Necrosis Market,
      2. By Treatment
    92. Avascular Necrosis Market, By End-User
      1. 11.4.2
      2. China 251
    93. Avascular Necrosis Market, By Type
      1. Avascular Necrosis
    94. Market, By Site
    95. Avascular Necrosis Market, By Diagnosis
      1. Avascular
    96. Necrosis Market, By Treatment
    97. Avascular Necrosis Market, By End-User
    98. India 260
    99. Avascular Necrosis Market, By Type
    100. Avascular Necrosis Market, By Site
    101. Avascular Necrosis Market, By Diagnosis
    102. Avascular Necrosis Market, By Treatment
      1. Avascular Necrosis Market,
      2. By End-User
      3. Avascular Necrosis Market,
      4. By Type
    103. Australia 268
    104. Avascular Necrosis Market, By Site
      1. Avascular Necrosis
    105. Market, By Diagnosis
    106. Avascular Necrosis Market, By Treatment
    107. Avascular Necrosis Market, By End-User
    108. Republic Of Korea 277
    109. Avascular Necrosis Market, By Type
      1. Avascular Necrosis Market,
      2. By Site
    110. Avascular Necrosis Market, By Diagnosis
      1. Avascular
    111. Necrosis Market, By Treatment
    112. Avascular Necrosis Market, By End-User
      1. Avascular Necrosis Market, By
      2. Type
    113. Rest Of Asia Pacific 285
    114. Avascular Necrosis Market, By Site
      1. Avascular Necrosis
    115. Market, By Diagnosis
    116. Avascular Necrosis Market, By Treatment
    117. Avascular Necrosis Market, By End-User
      1. The Middle East & Africa
      2. 294
    118. Avascular Necrosis Market, By Type
      1. Avascular Necrosis
    119. Market, By Site
    120. Avascular Necrosis Market, By Diagnosis
      1. Avascular
    121. Necrosis Market, By Treatment
    122. Avascular Necrosis Market, By End-User
    123. Middle East 303
    124. Avascular Necrosis Market, By Type
    125. Avascular Necrosis Market, By Site
      1. Avascular Necrosis Market,
      2. By Diagnosis
    126. Avascular Necrosis Market, By Treatment
      1. Avascular
    127. Necrosis Market, By End-User
      1. Avascular
    128. Africa 313
    129. Necrosis Market, By Type
    130. Avascular Necrosis Market, By Site
    131. Avascular Necrosis Market, By Diagnosis
      1. Avascular Necrosis Market,
      2. By Treatment
    132. Avascular Necrosis Market, By End-User
    133. Competitive
      1. Landscape
      2. Introduction 324
      3. Company Market Share
        1. Introduction 325
      4. Analysis 325
      5. Key Developments
      6. 326
    134. Company Profiles
      1. Sanofi 330
        1. Financial Overview 330
        2. Key Developments 331
        3. SWOT
        4. Key Strategy 331
      2. 13.1.1
      3. Company Overview 330
      4. 13.1.3
      5. Products Offering 331
      6. Analysis 331
      7. Bayer Healthcare
        1. Company Overview 332
        2. Financial Overview
        3. Products Offering 333
        4. Key Developments 333
        5. SWOT Analysis 333
        6. Key Strategy 333
        7. Company Overview 334
        8. Products Offering 335
        9. SWOT Analysis 335
        10. Key Strategy
      8. AG 332
      9. 332
      10. 13.3
      11. Boehringer Ingelheim GmbH 334
      12. 13.3.2
      13. Financial Overview 334
      14. 13.3.4
      15. Key Developments 335
      16. 335
      17. Pfizer Inc. 336
        1. Company Overview 336
        2. Financial Overview 336
        3. Products Offering 337
        4. Key Developments 337
        5. SWOT Analysis 337
      18. 13.4.6
      19. Key Strategy 337
      20. Merck KGaA 338
        1. Company Overview
        2. Financial Overview 338
        3. Products Offering
        4. Key Developments 339
        5. SWOT Analysis 339
        6. Key Strategy 339
      21. 338
      22. 339
      23. Stryker Corporation 340
        1. Company Overview 340
        2. Financial Overview 340
        3. Products Offering 341
        4. Key Developments 341
        5. Key Strategy 342
      24. 13.6.5
      25. SWOT Analysis 342
      26. Medtronic PLC
        1. Company Overview 343
        2. Financial Overview
        3. Products Offering 344
        4. Key Developments 344
        5. SWOT Analysis 344
        6. Key Strategy 344
        7. Company Overview 345
        8. Financial
        9. Products Offering 346
        10. Key Developments
        11. SWOT Analysis 347
        12. Key Strategy 347
      27. 343
      28. 343
      29. 13.8
      30. Aurobindo Pharma 345
      31. Overview 345
      32. 346
      33. Integra LifeSciences Corporation 348
        1. Company Overview 348
        2. Financial Overview 348
        3. Products Offering 349
        4. Key Developments 349
        5. SWOT Analysis 349
        6. Key Strategy 349
      34. Zimmer Biomet Holdings 350
        1. Financial Overview 350
        2. Key Developments 351
        3. Key Strategy 352
      35. 13.10.1
      36. Company Overview 350
      37. 13.10.3
      38. Products Offering 351
      39. 13.10.5
      40. SWOT Analysis 352
      41. Wright Medical
        1. Company Overview 353
        2. Financial
        3. Products Offering 354
        4. Key Developments
        5. SWOT Analysis 355
        6. Key Strategy 355
      42. Group N.V. 353
      43. Overview 353
      44. 354
      45. Grifols SA 356
        1. Company Overview 356
        2. Products Offering 357
        3. SWOT Analysis 357
        4. Key
      46. 13.12.2
      47. Financial Overview 356
      48. 13.12.4
      49. Key Developments 357
      50. Strategy 357
      51. Smith & Nephew 358
        1. Company
        2. Financial Overview 358
        3. Products
        4. Key Developments 359
        5. SWOT Analysis
        6. Key Strategy 360
      52. Overview 358
      53. Offering 359
      54. 360
      55. Ethicon Inc. 361
        1. Company Overview 361
        2. Financial Overview 361
        3. Products Offering 362
        4. Key Developments 362
        5. SWOT Analysis 363
        6. Key Strategy 363
    135. Conclusion
      1. Key Findings 365
        1. CEO’s Viewpoint 365
        2. Unmet Needs 365
        3. Key Companies To Watch 365
      2. 14.1.4
      3. Prediction 365
    136. Appendix
      1. Discussion Blue Print 367
    137. List Of Tables
    138. MARKET SYNOPSIS 30
      1. TABLE
    139. LIST OF ASSUMPTIONS 32
    140. NORTH AMERICA PROCEDURE NUMBERS, 2020–2016
      1. (UNITS) 50
    141. NORTH AMERICA PROCEDURE NUMBERS, 2027–2027 (UNITS)
      1. 50
    142. SOUTH AMERICA PROCEDURE NUMBERS, 2020–2016 (UNITS) 50
    143. SOUTH AMERICA PROCEDURE NUMBERS, 2027–2027 (UNITS) 50
    144. EUROPE PROCEDURE NUMBERS, 2020–2016 (UNITS) 51
      1. TABLE
    145. EUROPE PROCEDURE NUMBERS, 2027–2027 (UNITS) 51
    146. ASIA PACIFIC
      1. PROCEDURE NUMBERS, 2020–2016 (UNITS) 51
    147. ASIA PACIFIC PROCEDURE
      1. NUMBERS, 2027–2027 (UNITS) 51
    148. MIDDLE EAST PROCEDURE NUMBERS,
    149. MIDDLE EAST PROCEDURE NUMBERS, 2027–2027
      1. (UNITS) 52
    150. AFRICA PROCEDURE NUMBERS, 2020–2016 (UNITS)
      1. 52
    151. AFRICA PROCEDURE NUMBERS, 2027–2027 (UNITS) 52
    152. GLOBAL AVASCULAR NECROSIS MARKET, BY TYPE, 2020–2027 (USD MILLION)
      1. 54
    153. GLOBAL AVASCULAR NECROSIS MARKET, BY TYPE, 2023-2032 (USD
      1. MILLION) 54
    154. GLOBAL AVASCULAR NECROSIS MARKET FOR NON-TRAUMA
      1. RELATED AVASCULAR NECROSIS OR OSTEONECROSIS, BY REGION, 2020–2027 (USD MILLION)
      2. 55
    155. GLOBAL AVASCULAR NECROSIS MARKET FOR NON-TRAUMA RELATED AVASCULAR
      1. NECROSIS OR OSTEONECROSIS, BY REGION, 2020–2027 (USD MILLION) 56
    156. GLOBAL AVASCULAR NECROSIS MARKET, BY AGE GROUP, 2020–2027 (USD
      1. MILLION) 56
    157. GLOBAL AVASCULAR NECROSIS MARKET, BY AGE GROUP,2020–2027
      1. (USD MILLION) 56
    158. GLOBAL AVASCULAR NECROSIS MARKET FOR THIRD
      1. DECADE, BY REGION 2020–2027 (USD MILLION) 57
    159. GLOBAL AVASCULAR
    160. NECROSIS MARKET FOR THIRD DECADE, BY REGION, 2020–2027 (USD MILLION) 57
    161. GLOBAL AVASCULAR NECROSIS MARKET FOR FIFTH DECADE, BY REGION, 2020–2027
      1. (USD MILLION) 57
    162. GLOBAL AVASCULAR NECROSIS MARKET FOR FIFTH
      1. DECADE, BY REGION, 2020–2027 (USD MILLION) 58
    163. GLOBAL AVASCULAR
    164. NECROSIS MARKET, BY CAUSES, 2020–2027 (USD MILLION) 58
      1. TABLE 26
    165. GLOBAL AVASCULAR NECROSIS MARKET, BY CAUSES, 2020–2027 (USD MILLION) 59
    166. GLOBAL AVASCULAR NECROSIS MARKET FOR CAISSON DISEASE, BY REGION,
    167. GLOBAL AVASCULAR NECROSIS MARKET
      1. FOR CAISSON DISEASE, BY REGION, 2020–2027 (USD MILLION) 59
      2. TABLE
    168. GLOBAL AVASCULAR NECROSIS MARKET FOR SICKLE CELL ANAEMIA, BY REGION, 2020–2027
      1. (USD MILLION) 60
    169. GLOBAL AVASCULAR NECROSIS MARKET FOR SICKLE
      1. CELL ANEMIA, BY REGION, 2020–2027 (USD MILLION) 60
    170. GLOBAL
    171. AVASCULAR NECROSIS MARKET FOR STEROID ABUSE, BY REGION, 2020–2027 (USD MILLION)
      1. 60
    172. GLOBAL AVASCULAR NECROSIS MARKET FOR STEROID ABUSE, BY REGION,
    173. GLOBAL AVASCULAR NECROSIS MARKET
      1. FOR ALCOHOL ABUSE, BY REGION, 2020–2027 (USD MILLION) 61
      2. TABLE
    174. GLOBAL AVASCULAR NECROSIS MARKET FOR ALCOHOL ABUSE, BY REGION, 2020–2027
      1. (USD MILLION) 61
    175. GLOBAL AVASCULAR NECROSIS MARKET FOR TRAUMA
      1. RELATED AVASCULAR NECROSIS OR OSTEONECROSIS, BY REGION, 2020–2027 (USD MILLION)
      2. 62
    176. GLOBAL AVASCULAR NECROSIS MARKET FOR TRAUMA RELATED AVASCULAR
      1. NECROSIS OR OSTEONECROSIS, BY REGION, 2020–2027 (USD MILLION) 62
    177. GLOBAL AVASCULAR NECROSIS MARKET, BY SITE, 2020–2027 (USD MILLION)
      1. 64
    178. GLOBAL AVASCULAR NECROSIS MARKET, BY SITE, 2020–2027
      1. (USD MILLION) 65
    179. GLOBAL AVASCULAR NECROSIS MARKET FOR HIP BONE,
      1. BY REGION, 2020–2027 (USD MILLION) 65
    180. GLOBAL AVASCULAR
    181. NECROSIS MARKET, FOR HIP BONE, BY REGION, 2020–2027 (USD MILLION) 66
    182. GLOBAL AVASCULAR NECROSIS MARKET FOR KNEE, BY REGION, 2020–2027
      1. (USD MILLION) 66
    183. GLOBAL AVASCULAR NECROSIS MARKET FOR KNEE,
      1. BY REGION, 2020–2027 (USD MILLION) 66
    184. GLOBAL AVASCULAR
    185. NECROSIS MARKET FOR SHOULDER, BY REGION, 2020–2027 (USD MILLION) 67
    186. GLOBAL AVASCULAR NECROSIS MARKET FOR SHOULDER, BY REGION, 2020–2027
      1. (USD MILLION) 67
    187. GLOBAL AVASCULAR NECROSIS MARKET BY DIAGNOSIS,
    188. GLOBAL AVASCULAR NECROSIS MARKET
      1. BY DIAGNOSIS, 2020–2027 (USD MILLION) 69
    189. GLOBAL AVASCULAR
    190. NECROSIS MARKET FOR IMAGING, BY REGION, 2020–2027 (USD MILLION) 70
    191. GLOBAL AVASCULAR NECROSIS MARKET FOR IMAGING, BY REGION, 2020–2027
      1. (USD MILLION) 71
    192. GLOBAL AVASCULAR NECROSIS MARKET FOR DIAGNOSIS,
      1. BY IMAGING, 2020–2027 (USD MILLION) 71
    193. GLOBAL AVASCULAR
    194. NECROSIS MARKET FOR DIAGNOSIS, BY IMAGING, 2020–2027 (USD MILLION) 71
    195. GLOBAL AVASCULAR NECROSIS MARKET FOR X-RAY, BY REGION, 2020–2027
      1. (USD MILLION) 72
    196. GLOBAL AVASCULAR NECROSIS MARKET FOR X-RAY
      1. , BY REGION, 2020–2027 (USD MILLION) 72
    197. GLOBAL AVASCULAR
    198. NECROSIS MARKET FOR CT SCAN, BY REGION, 2020–2027 (USD MILLION) 72
    199. GLOBAL AVASCULAR NECROSIS MARKET FOR CT SCAN, BY REGION, 2020–2027
      1. (USD MILLION) 73
    200. GLOBAL AVASCULAR NECROSIS MARKET FOR MRI, BY
      1. REGION, 2020–2027 (USD MILLION) 73
    201. GLOBAL AVASCULAR NECROSIS
    202. MARKET FOR MRI, BY REGION, 2020–2027 (USD MILLION) 73
      1. TABLE 57
    203. GLOBAL AVASCULAR NECROSIS MARKET FOR PET, BY REGION, 2020–2027 (USD MILLION)
      1. 74
    204. GLOBAL AVASCULAR NECROSIS MARKET FOR PET, BY REGION, 2020–2027
      1. (USD MILLION) 74
    205. GLOBAL AVASCULAR NECROSIS MARKET FOR BIOPSY,
      1. BY REGION, 2020–2027 (USD MILLION) 75
    206. GLOBAL AVASCULAR
    207. NECROSIS MARKET FOR BIOPSY, BY REGION, 2020–2027 (USD MILLION) 75
    208. GLOBAL AVASCULAR NECROSIS MARKET BY TREATMENT, 2020–2027 (USD MILLION)
      1. 77
    209. GLOBAL AVASCULAR NECROSIS MARKET BY TREATMENT, 2020–2027
      1. (USD MILLION) 78
    210. GLOBAL AVASCULAR NECROSIS MARKET FOR TREATMENT,
      1. BY MEDICATION, BY REGION, 2020–2027 (USD MILLION) 78
    211. GLOBAL
    212. AVASCULAR NECROSIS MARKET FOR TREATMENT, BY MEDICATION, BY REGION, 2020–2027
      1. (USD MILLION) 78
    213. GLOBAL AVASCULAR NECROSIS MARKET FOR MEDICATION,
      1. BY NSAIDS, 2020–2027 (USD MILLION) 79
    214. GLOBAL AVASCULAR
      1. NECROSIS MARKET FOR MEDICATION BY NSAIDS, 2020–2027 (USD MILLION) 79
    215. GLOBAL AVASCULAR NECROSIS MARKET FOR MEDICATION BY BISPHOSPHONATES, 2020–2027
      1. (USD MILLION) 80
    216. GLOBAL AVASCULAR NECROSIS MARKET FOR MEDICATION
      1. BY BISPHOSPHONATES, 2020–2027 (USD MILLION) 80
    217. GLOBAL
      1. AVASCULAR NECROSIS MARKET FOR MEDICATION BY BLOOD THINNERS, 2020–2027 (USD
      2. MILLION) 80
    218. GLOBAL AVASCULAR NECROSIS MARKET FOR MEDICATION
      1. BY BLOOD THINNERS, 2020–2027 (USD MILLION) 81
    219. GLOBAL AVASCULAR
    220. NECROSIS MARKET FOR ELECTRICAL STIMULATION, BY REGION, 2020–2027 (USD MILLION)
      1. 81
    221. GLOBAL AVASCULAR NECROSIS MARKET FOR ELECTRICAL STIMULATION,
      1. BY REGION, 2020–2027 (USD MILLION) 81
    222. GLOBAL AVASCULAR
    223. NECROSIS MARKET FOR GENE THERAPY, BY REGION, 2020–2027 (USD MILLION) 82
    224. GLOBAL AVASCULAR NECROSIS MARKET FOR GENE THERAPY, BY REGION, 2020–2027
      1. (USD MILLION) 82
    225. GLOBAL AVASCULAR NECROSIS MARKET FOR GENE THERAPY,
      1. BY REGION, 2020–2027 (USD MILLION) 83
    226. GLOBAL AVASCULAR
    227. NECROSIS MARKET FOR GENE THERAPY, BY REGION, 2020–2027 (USD MILLION) 83
    228. GLOBAL AVASCULAR NECROSIS MARKET FOR CORE DECOMPRESSION, BY REGION,
    229. GLOBAL AVASCULAR NECROSIS MARKET
      1. FOR CORE DECOMPRESSION , BY REGION, 2020–2027 (USD MILLION) 84
      2. TABLE
    230. GLOBAL AVASCULAR NECROSIS MARKET FOR OSTEOTOMY , BY REGION, 2020–2027 (USD
      1. MILLION) 84
    231. GLOBAL AVASCULAR NECROSIS MARKET FOR OSTEOTOMY,
      1. BY REGION, 2020–2027 (USD MILLION) 84
    232. GLOBAL AVASCULAR
    233. NECROSIS MARKET FOR BONE GRAFT, BY REGION, 2020–2027 (USD MILLION) 85
    234. GLOBAL AVASCULAR NECROSIS MARKET FOR BONE GRAFT, BY REGION, 2020–2027
      1. (USD MILLION) 85
    235. GLOBAL AVASCULAR NECROSIS MARKET FOR ARTHOPLASTY,
      1. BY REGION, 2020–2027 (USD MILLION) 85
    236. GLOBAL AVASCULAR
    237. NECROSIS MARKET FOR ARTHOPLASTY, BY REGION, 2020–2027 (USD MILLION) 86
    238. GLOBAL AVASCULAR NECROSIS MARKET FOR END USER, BY REGION, 2020–2027
      1. (USD MILLION) 88
    239. GLOBAL AVASCULAR NECROSIS MARKET FOR END USER,
      1. BY REGION, 2020–2027 (USD MILLION) 88
    240. GLOBAL AVASCULAR
    241. NECROSIS MARKET FOR HOSPITALS & CLINICS, BY REGION, 2020–2027 (USD MILLION)
      1. 89
    242. GLOBAL AVASCULAR NECROSIS MARKET FOR HOSPITALS & CLINICS,
      1. BY REGION, 2020–2027 (USD MILLION) 89
    243. GLOBAL AVASCULAR
    244. NECROSIS MARKET FOR DIAGNOSTIC CENTERS, BY REGION, 2020–2027 (USD MILLION)
      1. 90
    245. GLOBAL AVASCULAR NECROSIS MARKET FOR DIAGNOSTIC CENTERS ,
      1. BY REGION, 2020–2027 (USD MILLION) 90
    246. GLOBAL AVASCULAR
    247. NECROSIS MARKET FOR AMBULATORY SURGICAL CENTERS , BY REGION, 2020 2027 (USD MILLION)
      1. 91
    248. GLOBAL AVASCULAR NECROSIS MARKET FOR AMBULATORY SURGICAL
      1. CENTERS , BY REGION, 2020–2027 (USD MILLION) 91
    249. GLOBAL
    250. AVASCULAR NECROSIS MARKET, BY REGION, 2023-2032 (USD MILLION) 93
      1. TABLE
    251. GLOBAL AVASCULAR NECROSIS MARKET, BY REGION, 2023-2032 (USD MILLION) 93
    252. GLOBAL AVASCULAR NECROSIS MARKET, BY TYPE, 2023-2032 (USD MILLION) 94
    253. GLOBAL AVASCULAR NECROSIS MARKET, BY TYPE, 2023-2032 (USD MILLION)
      1. 94
    254. GLOBAL NON-TRAUMA RELATED AVN MARKET, BY AGE GROUP, 2023-2032
      1. (USD MILLION) 95
    255. GLOBAL NON-TRAUMA RELATED AVN MARKET, BY AGE
      1. GROUP, 2023-2032 (USD MILLION) 95
    256. GLOBAL NON-TRAUMA RELATED
    257. AVN MARKET, BY CAUSES, 2023-2032 (USD MILLION) 95
    258. GLOBAL NON-TRAUMA
    259. RELATED AVN MARKET, BY CAUSES, 2023-2032 (USD MILLION) 96
    260. GLOBAL
    261. AVASCULAR NECROSIS MARKET, BY SITE, 2023-2032 (USD MILLION) 96
      1. TABLE
    262. GLOBAL AVASCULAR NECROSIS MARKET, BY SITE, 2023-2032 (USD MILLION) 96
    263. GLOBAL AVASCULAR NECROSIS MARKET, BY DIAGNOSIS, 2023-2032 (USD MILLION)
      1. 97
    264. GLOBAL AVASCULAR NECROSIS MARKET, BY DIAGNOSIS, 2023-2032
      1. (USD MILLION) 97
    265. GLOBAL AVASCULAR NECROSIS MARKET FOR DIAGNOSIS,
      1. BY IMAGING, 2023-2032 (USD MILLION) 97
    266. GLOBAL AVASCULAR NECROSIS
    267. MARKET FOR DIAGNOSIS, BY IMAGING, 2023-2032 (USD MILLION) 98
      1. TABLE 107
    268. GLOBAL AVASCULAR NECROSIS MARKET, BY TREATMENT, 2023-2032 (USD MILLION) 98
    269. GLOBAL AVASCULAR NECROSIS MARKET, BY TREATMENT, 2023-2032 (USD MILLION)
      1. 98
    270. GLOBAL AVASCULAR NECROSIS MARKET FOR TREATMENT, BY MEDICATION,
    271. GLOBAL AVASCULAR NECROSIS MARKET
      1. FOR TREATMENT, BY MEDICATION, 2023-2032 (USD MILLION) 99
    272. GLOBAL
    273. AVASCULAR NECROSIS MARKET FOR MEDICATION, BY NSAIDS, 2023-2032 (USD MILLION) 99
    274. GLOBAL AVASCULAR NECROSIS MARKET FOR MEDICATION, BY NSAIDS, 2023-2032
      1. (USD MILLION) 100
    275. GLOBAL AVASCULAR NECROSIS MARKET FOR MEDICATION
      1. BY BISPHOSPHONATES, 2023-2032 (USD MILLION) 100
    276. GLOBAL AVASCULAR
      1. NECROSIS MARKET FOR MEDICATION BY BISPHOSPHONATES, 2023-2032 (USD MILLION) 100
    277. GLOBAL AVASCULAR NECROSIS MARKET FOR MEDICATION BY BLOOD THINNERS,
    278. GLOBAL AVASCULAR NECROSIS MARKET
      1. FOR MEDICATION BY BLOOD THINNERS, 2023-2032 (USD MILLION) 101
      2. TABLE 117
      3. GLOBAL AVASCULAR NECROSIS MARKET FOR TREATMENT BY SURGERY, 2023-2032 (USD MILLION)
      4. 101
    279. GLOBAL AVASCULAR NECROSIS MARKET FOR TREATMENT BY SURGERY,
    280. GLOBAL AVASCULAR NECROSIS MARKET
      1. FOR END USER, 2023-2032 (USD MILLION) 102
    281. GLOBAL AVASCULAR
      1. NECROSIS MARKET FOR END USER, 2023-2032 (USD MILLION) 102
    282. AMERICAS
    283. AVASCULAR NECROSIS MARKET, BY REGION, 2023-2032 (USD MILLION) 103
      1. TABLE
    284. AMERICAS AVASCULAR NECROSIS MARKET, BY REGION, 2023-2032 (USD MILLION) 103
    285. AMERICAS AVASCULAR NECROSIS MARKET, BY TYPE, 2023-2032 (USD MILLION)
      1. 104
    286. AMERICAS AVASCULAR NECROSIS MARKET, BY TYPE, 2023-2032
      1. (USD MILLION) 104
    287. AMERICAS NON-TRAUMA RELATED AVN MARKET, BY
      1. AGE GROUP, 2023-2032 (USD MILLION) 104
    288. AMERICAS NON-TRAUMA
    289. RELATED AVN MARKET, BY AGE GROUP, 2023-2032 (USD MILLION) 105
      1. TABLE 127
    290. AMERICAS NON-TRAUMA RELATED AVN MARKET, BY CAUSES, 2023-2032 (USD MILLION) 105
    291. AMERICAS NON-TRAUMA RELATED AVN MARKET, BY CAUSES, 2023-2032 (USD
      1. MILLION) 105
    292. AMERICAS AVASCULAR NECROSIS MARKET, BY SITE, 2023-2032
      1. (USD MILLION) 106
    293. AMERICAS AVASCULAR NECROSIS MARKET, BY SITE,
    294. AMERICAS AVASCULAR NECROSIS MARKET,
      1. BY DIAGNOSIS, 2023-2032 (USD MILLION) 106
    295. AMERICAS AVASCULAR
    296. NECROSIS MARKET, BY DIAGNOSIS, 2023-2032 (USD MILLION) 106
      1. TABLE 133
    297. AMERICAS AVASCULAR NECROSIS MARKET FOR DIAGNOSIS, BY IMAGING, 2023-2032 (USD MILLION)
      1. 107
    298. AMERICAS AVASCULAR NECROSIS MARKET FOR DIAGNOSIS, BY IMAGING,
    299. AMERICAS AVASCULAR NECROSIS MARKET,
      1. BY TREATMENT, 2023-2032 (USD MILLION) 107
    300. AMERICAS AVASCULAR
    301. NECROSIS MARKET, BY TREATMENT, 2023-2032 (USD MILLION) 108
      1. TABLE 137
    302. AMERICAS AVASCULAR NECROSIS MARKET FOR TREATMENT, BY MEDICATION, 2023-2032 (USD
      1. MILLION) 108
    303. AMERICAS AVASCULAR NECROSIS MARKET FOR TREATMENT,
      1. BY MEDICATION, 2023-2032 (USD MILLION) 108
    304. AMERICAS AVASCULAR
    305. NECROSIS MARKET FOR MEDICATION, BY NSAIDS, 2023-2032 (USD MILLION) 109
    306. AMERICAS AVASCULAR NECROSIS MARKET FOR MEDICATION, BY NSAIDS, 2023-2032
      1. (USD MILLION) 109
    307. AMERICAS AVASCULAR NECROSIS MARKET FOR MEDICATION
      1. BY BISPHOSPHONATES, 2023-2032 (USD MILLION) 109
    308. AMERICAS AVASCULAR
      1. NECROSIS MARKET FOR MEDICATION BY BISPHOSPHONATES, 2023-2032 (USD MILLION) 110
    309. AMERICAS AVASCULAR NECROSIS MARKET FOR MEDICATION BY BLOOD THINNERS,
    310. AMERICAS AVASCULAR NECROSIS MARKET
      1. FOR MEDICATION BY BLOOD THINNERS, 2023-2032 (USD MILLION) 110
      2. TABLE 145
      3. AMERICAS AVASCULAR NECROSIS MARKET FOR TREATMENT BY SURGERY, 2023-2032 (USD MILLION)
      4. 111
    311. AMERICAS AVASCULAR NECROSIS MARKET FOR TREATMENT BY SURGERY,
    312. AMERICAS AVASCULAR NECROSIS MARKET
      1. FOR END USER, 2023-2032 (USD MILLION) 111
    313. AMERICAS AVASCULAR
      1. NECROSIS MARKET FOR END USER, 2023-2032 (USD MILLION) 112
    314. NORTH
    315. AMERICA AVASCULAR NECROSIS MARKET, BY REGION, 2023-2032 (USD MILLION) 112
    316. NORTH AMERICA AVASCULAR NECROSIS MARKET, BY REGION, 2023-2032 (USD MILLION)
      1. 112
    317. NORTH AMERICA AVASCULAR NECROSIS MARKET, BY VOLUME/PROCEDURES,
    318. NORTH AMERICA AVASCULAR NECROSIS MARKET, BY VOLUME/PROCEDURES,
    319. NORTH AMERICA AVASCULAR NECROSIS MARKET, BY TYPE,
    320. NORTH AMERICA AVASCULAR NECROSIS
    321. MARKET, BY TYPE, 2023-2032 (USD MILLION) 114
    322. NORTH AMERICA
    323. NON-TRAUMA RELATED AVN MARKET, BY AGE GROUP, 2023-2032 (USD MILLION) 115
    324. NORTH AMERICA NON-TRAUMA RELATED AVN MARKET, BY AGE GROUP, 2023-2032
      1. (USD MILLION) 115
    325. NORTH AMERICA NON-TRAUMA RELATED AVN MARKET,
      1. BY CAUSES, 2023-2032 (USD MILLION) 115
    326. NORTH AMERICA NON-TRAUMA
    327. RELATED AVN MARKET, BY CAUSES, 2023-2032 (USD MILLION) 116
      1. TABLE 159
    328. NORTH AMERICA AVASCULAR NECROSIS MARKET, BY SITE, 2023-2032 (USD MILLION) 116
    329. NORTH AMERICA AVASCULAR NECROSIS MARKET, BY SITE, 2023-2032 (USD
      1. MILLION) 116
    330. NORTH AMERICA AVASCULAR NECROSIS MARKET, BY DIAGNOSIS,
    331. NORTH AMERICA AVASCULAR NECROSIS
    332. MARKET, BY DIAGNOSIS, 2023-2032 (USD MILLION) 117
    333. NORTH AMERICA
    334. AVASCULAR NECROSIS MARKET FOR DIAGNOSIS, BY IMAGING, 2023-2032 (USD MILLION) 117
    335. NORTH AMERICA AVASCULAR NECROSIS MARKET FOR DIAGNOSIS, BY IMAGING,
    336. NORTH AMERICA AVASCULAR NECROSIS
    337. MARKET, BY TREATMENT, 2023-2032 (USD MILLION) 118
    338. NORTH AMERICA
    339. AVASCULAR NECROSIS MARKET, BY TREATMENT, 2023-2032 (USD MILLION) 118
      1. TABLE
    340. NORTH AMERICA AVASCULAR NECROSIS MARKET FOR TREATMENT, BY MEDICATION, 2023-2032
      1. (USD MILLION) 119
    341. NORTH AMERICA AVASCULAR NECROSIS MARKET FOR
      1. TREATMENT, BY MEDICATION, 2023-20

    Avascular Necrosis Market Segmentation

    Avascular Necrosis Products Type Outlook (USD Billion, 2018-2032)

    • Trauma Related Avascular Necrosis (AVN)
    • Non-Trauma Related Avascular Necrosis (AVN)

    Avascular Necrosis Treatment Outlook (USD Billion, 2018-2032)

    • Nonsteroidal Anti-Inflammatory Drugs (NSAIDS)
    • Cholesterol Lowing Drugs
    • Osteoporosis Drugs
    • Blood Thinners
    • Others

    Avascular Necrosis Diagnosis Outlook (USD Billion, 2018-2032)

    • Imaging
    • Biopsy
    • CT Scan
    • PET
    • X- Ray

    Avascular Necrosis End user Outlook (USD Billion, 2018-2032)

    • Hospital Pharmacies
    • Retail Pharmacies
    • Online Pharmacies

    Avascular Necrosis Products Regional Outlook (USD Billion, 2018-2032)

    • North America Outlook (USD Billion, 2018-2032)

      • North America Avascular Necrosis Products by Type
        • Trauma Related Avascular Necrosis (AVN)
        • Non-Trauma Related Avascular Necrosis (AVN)
      • North America Avascular Necrosis by Treatment
        • Nonsteroidal Anti-Inflammatory Drugs (NSAIDS)
        • Cholesterol Lowing Drugs
        • Osteoporosis Drugs
        • Blood Thinners
        • Others
      • North America Avascular Necrosis by Diagnosis
        • Imaging
        • Biopsy
        • CT Scan
        • PET
        • X- Ray
      • North America Avascular Necrosis by End user
        • Hospital Pharmacies
        • Retail Pharmacies
        • Online Pharmacies
      • US Outlook (USD Billion, 2018-2032)

      • US Avascular Necrosis Products by Type
        • Trauma Related Avascular Necrosis (AVN)
        • Non-Trauma Related Avascular Necrosis (AVN)
      • US Avascular Necrosis by Treatment
        • Nonsteroidal Anti-Inflammatory Drugs (NSAIDS)
        • Cholesterol Lowing Drugs
        • Osteoporosis Drugs
        • Blood Thinners
        • Others
      • US Avascular Necrosis by Diagnosis
        • Imaging
        • Biopsy
        • CT Scan
        • PET
        • X- Ray
      • US Avascular Necrosis by End user
        • Hospital Pharmacies
        • Retail Pharmacies
        • Online Pharmacies
      • CANADA Outlook (USD Billion, 2018-2032)

      • CANADA Avascular Necrosis Products by Type
        • Trauma Related Avascular Necrosis (AVN)
        • Non-Trauma Related Avascular Necrosis (AVN)
      • CANADA Avascular Necrosis by Treatment
        • Nonsteroidal Anti-Inflammatory Drugs (NSAIDS)
        • Cholesterol Lowing Drugs
        • Osteoporosis Drugs
        • Blood Thinners
        • Others
      • CANADA Avascular Necrosis by Diagnosis
        • Imaging
        • Biopsy
        • CT Scan
        • PET
        • X- Ray
      • CANADA Avascular Necrosis by End user
        • Hospital Pharmacies
        • Retail Pharmacies
        • Online Pharmacies
    • Europe Outlook (USD Billion, 2018-2032)

      • Europe Avascular Necrosis Products by Type
        • Trauma Related Avascular Necrosis (AVN)
        • Non-Trauma Related Avascular Necrosis (AVN)
      • Europe Avascular Necrosis by Treatment
        • Nonsteroidal Anti-Inflammatory Drugs (NSAIDS)
        • Cholesterol Lowing Drugs
        • Osteoporosis Drugs
        • Blood Thinners
        • Others
      • Europe Avascular Necrosis by Diagnosis
        • Imaging
        • Biopsy
        • CT Scan
        • PET
        • X- Ray
      • Europe Avascular Necrosis by End user
        • Hospital Pharmacies
        • Retail Pharmacies
        • Online Pharmacies
      • Germany Outlook (USD Billion, 2018-2032)

      • Germany Avascular Necrosis Products by Type
        • Trauma Related Avascular Necrosis (AVN)
        • Non-Trauma Related Avascular Necrosis (AVN)
      • Germany Avascular Necrosis by Treatment
        • Nonsteroidal Anti-Inflammatory Drugs (NSAIDS)
        • Cholesterol Lowing Drugs
        • Osteoporosis Drugs
        • Blood Thinners
        • Others
      • Germany Avascular Necrosis by Diagnosis
        • Imaging
        • Biopsy
        • CT Scan
        • PET
        • X- Ray
      • Germany Avascular Necrosis by End user
        • Hospital Pharmacies
        • Retail Pharmacies
        • Online Pharmacies
      • France Outlook (USD Billion, 2018-2032)

      • France Avascular Necrosis Products by Type
        • Trauma Related Avascular Necrosis (AVN)
        • Non-Trauma Related Avascular Necrosis (AVN)
      • France Avascular Necrosis by Treatment
        • Nonsteroidal Anti-Inflammatory Drugs (NSAIDS)
        • Cholesterol Lowing Drugs
        • Osteoporosis Drugs
        • Blood Thinners
        • Others
      • France Avascular Necrosis by Diagnosis
        • Imaging
        • Biopsy
        • CT Scan
        • PET
        • X- Ray
      • France Avascular Necrosis by End user
        • Hospital Pharmacies
        • Retail Pharmacies
        • Online Pharmacies
      • UK Outlook (USD Billion, 2018-2032)

      • UK Avascular Necrosis Products by Type
        • Trauma Related Avascular Necrosis (AVN)
        • Non-Trauma Related Avascular Necrosis (AVN)
      • UK Avascular Necrosis by Treatment
        • Nonsteroidal Anti-Inflammatory Drugs (NSAIDS)
        • Cholesterol Lowing Drugs
        • Osteoporosis Drugs
        • Blood Thinners
        • Others
      • UK Avascular Necrosis by Diagnosis
        • Imaging
        • Biopsy
        • CT Scan
        • PET
        • X- Ray
      • UK Avascular Necrosis by End user
        • Hospital Pharmacies
        • Retail Pharmacies
        • Online Pharmacies
      • ITALY Outlook (USD Billion, 2018-2032)

      • ITALY Avascular Necrosis Products by Type
        • Trauma Related Avascular Necrosis (AVN)
        • Non-Trauma Related Avascular Necrosis (AVN)
      • ITALY Avascular Necrosis by Treatment
        • Nonsteroidal Anti-Inflammatory Drugs (NSAIDS)
        • Cholesterol Lowing Drugs
        • Osteoporosis Drugs
        • Blood Thinners
        • Others
      • ITALY Avascular Necrosis by Diagnosis
        • Imaging
        • Biopsy
        • CT Scan
        • PET
        • X- Ray
      • ITALY Avascular Necrosis by End user
        • Hospital Pharmacies
        • Retail Pharmacies
        • Online Pharmacies
      • SPAIN Outlook (USD Billion, 2018-2032)

      • Spain Avascular Necrosis Products by Type
        • Trauma Related Avascular Necrosis (AVN)
        • Non-Trauma Related Avascular Necrosis (AVN)
      • Spain Avascular Necrosis by Treatment
        • Nonsteroidal Anti-Inflammatory Drugs (NSAIDS)
        • Cholesterol Lowing Drugs
        • Osteoporosis Drugs
        • Blood Thinners
        • Others
      • Spain Avascular Necrosis by Diagnosis
        • Imaging
        • Biopsy
        • CT Scan
        • PET
        • X- Ray
      • Spain Avascular Necrosis by End user
        • Hospital Pharmacies
        • Retail Pharmacies
        • Online Pharmacies
      • Rest Of Europe Outlook (USD Billion, 2018-2032)

      • Rest Of Europe Avascular Necrosis Products by Type
        • Trauma Related Avascular Necrosis (AVN)
        • Non-Trauma Related Avascular Necrosis (AVN)
      • Rest Of Europe Avascular Necrosis by Treatment
        • Nonsteroidal Anti-Inflammatory Drugs (NSAIDS)
        • Cholesterol Lowing Drugs
        • Osteoporosis Drugs
        • Blood Thinners
        • Others
      • Rest Of Europe Avascular Necrosis by Diagnosis
        • Imaging
        • Biopsy
        • CT Scan
        • PET
        • X- Ray
      • Rest Of Europe Avascular Necrosis by End user
        • Hospital Pharmacies
        • Retail Pharmacies
        • Online Pharmacies
    • Asia-Pacific Outlook (USD Billion, 2018-2032)

      • Asia-Pacific Avascular Necrosis Products by Type
        • Trauma Related Avascular Necrosis (AVN)
        • Non-Trauma Related Avascular Necrosis (AVN)
      • Asia-Pacific Avascular Necrosis by Treatment
        • Nonsteroidal Anti-Inflammatory Drugs (NSAIDS)
        • Cholesterol Lowing Drugs
        • Osteoporosis Drugs
        • Blood Thinners
        • Others
      • Asia-Pacific Avascular Necrosis by Diagnosis
        • Imaging
        • Biopsy
        • CT Scan
        • PET
        • X- Ray
      • Asia-Pacific Avascular Necrosis by End user
        • Hospital Pharmacies
        • Retail Pharmacies
        • Online Pharmacies
      • China Outlook (USD Billion, 2018-2032)

      • China Avascular Necrosis Products by Type
        • Trauma Related Avascular Necrosis (AVN)
        • Non-Trauma Related Avascular Necrosis (AVN)
      • China Avascular Necrosis by Treatment
        • Nonsteroidal Anti-Inflammatory Drugs (NSAIDS)
        • Cholesterol Lowing Drugs
        • Osteoporosis Drugs
        • Blood Thinners
        • Others
      • China Avascular Necrosis by Diagnosis
        • Imaging
        • Biopsy
        • CT Scan
        • PET
        • X- Ray
      • China Avascular Necrosis by End user
        • Hospital Pharmacies
        • Retail Pharmacies
        • Online Pharmacies
      • Japan Outlook (USD Billion, 2018-2032)

      • Japan Avascular Necrosis Products by Type
        • Trauma Related Avascular Necrosis (AVN)
        • Non-Trauma Related Avascular Necrosis (AVN)
      • Japan Avascular Necrosis by Treatment
        • Nonsteroidal Anti-Inflammatory Drugs (NSAIDS)
        • Cholesterol Lowing Drugs
        • Osteoporosis Drugs
        • Blood Thinners
        • Others
      • Japan Avascular Necrosis by Diagnosis
        • Imaging
        • Biopsy
        • CT Scan
        • PET
        • X- Ray
      • Japan Avascular Necrosis by End user
        • Hospital Pharmacies
        • Retail Pharmacies
        • Online Pharmacies
      • India Outlook (USD Billion, 2018-2032)

      • India Avascular Necrosis Products by Type
        • Trauma Related Avascular Necrosis (AVN)
        • Non-Trauma Related Avascular Necrosis (AVN)
      • India Avascular Necrosis by Treatment
        • Nonsteroidal Anti-Inflammatory Drugs (NSAIDS)
        • Cholesterol Lowing Drugs
        • Osteoporosis Drugs
        • Blood Thinners
        • Others
      • India Avascular Necrosis by Diagnosis
        • Imaging
        • Biopsy
        • CT Scan
        • PET
        • X- Ray
      • India Avascular Necrosis by End user
        • Hospital Pharmacies
        • Retail Pharmacies
        • Online Pharmacies
      • Australia Outlook (USD Billion, 2018-2032)

      • Australia Avascular Necrosis Products by Type
        • Trauma Related Avascular Necrosis (AVN)
        • Non-Trauma Related Avascular Necrosis (AVN)
      • Australia Avascular Necrosis by Treatment

        • Nonsteroidal Anti-Inflammatory Drugs (NSAIDS)
        • Cholesterol Lowing Drugs
        • Osteoporosis Drugs
        • Blood Thinners
        • Others
      • Australia Avascular Necrosis by Diagnosis

        • Imaging
        • Biopsy
        • CT Scan
        • PET
        • X- Ray
      • Australia Avascular Necrosis by End user

        • Hospital Pharmacies
        • Retail Pharmacies
        • Online Pharmacies
      • Rest of Asia-Pacific Outlook (USD Billion, 2018-2032)

      • Rest of Asia-Pacific Avascular Necrosis Products by Type
        • Trauma Related Avascular Necrosis (AVN)
        • Non-Trauma Related Avascular Necrosis (AVN)
      • Rest of Asia-Pacific Avascular Necrosis by Treatment
        • Nonsteroidal Anti-Inflammatory Drugs (NSAIDS)
        • Cholesterol Lowing Drugs
        • Osteoporosis Drugs
        • Blood Thinners
        • Others
      • Rest of Asia-Pacific Avascular Necrosis by Diagnosis
        • Imaging
        • Biopsy
        • CT Scan
        • PET
        • X- Ray
      • Rest of Asia-Pacific Avascular Necrosis by End user
        • Hospital Pharmacies
        • Retail Pharmacies
        • Online Pharmacies
    • Rest of the World Outlook (USD Billion, 2018-2032)

      • Rest of the World Avascular Necrosis Products by Type
        • Trauma Related Avascular Necrosis (AVN)
        • Non-Trauma Related Avascular Necrosis (AVN)
      • Rest of the World Avascular Necrosis by Treatment
        • Nonsteroidal Anti-Inflammatory Drugs (NSAIDS)
        • Cholesterol Lowing Drugs
        • Osteoporosis Drugs
        • Blood Thinners
        • Others
      • Rest of the World Avascular Necrosis by Diagnosis
        • Imaging
        • Biopsy
        • CT Scan
        • PET
        • X- Ray
      • Rest of the World Avascular Necrosis by End user
        • Hospital Pharmacies
        • Retail Pharmacies
        • Online Pharmacies
      • Middle East Outlook (USD Billion, 2018-2032)

      • Middle East Avascular Necrosis Products by Type
        • Trauma Related Avascular Necrosis (AVN)
        • Non-Trauma Related Avascular Necrosis (AVN)
      • Middle East Avascular Necrosis by Treatment
        • Nonsteroidal Anti-Inflammatory Drugs (NSAIDS)
        • Cholesterol Lowing Drugs
        • Osteoporosis Drugs
        • Blood Thinners
        • Others
      • Middle East Avascular Necrosis by Diagnosis
        • Imaging
        • Biopsy
        • CT Scan
        • PET
        • X- Ray
      • Middle East Avascular Necrosis by End user
        • Hospital Pharmacies
        • Retail Pharmacies
        • Online Pharmacies
      • Africa Outlook (USD Billion, 2018-2032)

      • Africa Avascular Necrosis Products by Type
        • Trauma Related Avascular Necrosis (AVN)
        • Non-Trauma Related Avascular Necrosis (AVN)
      • Africa Avascular Necrosis by Treatment
        • Nonsteroidal Anti-Inflammatory Drugs (NSAIDS)
        • Cholesterol Lowing Drugs
        • Osteoporosis Drugs
        • Blood Thinners
        • Others
      • Africa Avascular Necrosis by Diagnosis
        • Imaging
        • Biopsy
        • CT Scan
        • PET
        • X- Ray
      • Africa Avascular Necrosis by End user
        • Hospital Pharmacies
        • Retail Pharmacies
        • Online Pharmacies
      • Latin America Outlook (USD Billion, 2018-2032)

      • Latin America Avascular Necrosis Products by Type
        • Trauma Related Avascular Necrosis (AVN)
        • Non-Trauma Related Avascular Necrosis (AVN)
      • Latin America Avascular Necrosis by Treatment
        • Nonsteroidal Anti-Inflammatory Drugs (NSAIDS)
        • Cholesterol Lowing Drugs
        • Osteoporosis Drugs
        • Blood Thinners
        • Others
      • Latin America Avascular Necrosis by Diagnosis
        • Imaging
        • Biopsy
        • CT Scan
        • PET
        • X- Ray
      • Latin America Avascular Necrosis by End user
        • Hospital Pharmacies
        • Retail Pharmacies
        • Online Pharmacies
    Infographic

    Free Sample Request

    Kindly complete the form below to receive a free sample of this Report

    Get Free Sample

    Customer Strories

    “I am very pleased with how market segments have been defined in a relevant way for my purposes (such as "Portable Freezers & refrigerators" and "last-mile"). In general the report is well structured. Thanks very much for your efforts.”

    Victoria Milne

    Founder
    Case Study
    Chemicals and Materials