info@marketresearchfuture.com   ๐Ÿ“ž +1 (855) 661-4441(US)   ๐Ÿ“ž +44 1720 412 167(UK)   ๐Ÿ“ž +91 2269738890(APAC)
Certified Global Research Member
Isomar 1 Iso 1
Key Questions Answered
  • Global Market Outlook
  • In-depth analysis of global and regional trends
  • Analyze and identify the major players in the market, their market share, key developments, etc.
  • To understand the capability of the major players based on products offered, financials, and strategies.
  • Identify disrupting products, companies, and trends.
  • To identify opportunities in the market.
  • Analyze the key challenges in the market.
  • Analyze the regional penetration of players, products, and services in the market.
  • Comparison of major playersโ€™ financial performance.
  • Evaluate strategies adopted by major players.
  • Recommendations
Why Choose Market Research Future?
  • Vigorous research methodologies for specific market.
  • Knowledge partners across the globe
  • Large network of partner consultants.
  • Ever-increasing/ Escalating data base with quarterly monitoring of various markets
  • Trusted by fortune 500 companies/startups/ universities/organizations
  • Large database of 5000+ markets reports.
  • Effective and prompt pre- and post-sales support.

Avascular Necrosis Market Research Report Information By Type (Trauma Related Avascular Necrosis (AVN) and Non-Trauma Related Avascular Necrosis (AVN)0, By Treatment (Nonsteroidal Anti-Inflammatory Drugs (NSAIDS), Cholesterol Lowing Drugs, Osteoporosis Drugs, Blood Thinners, and Others), By Diagnosis (Imaging, Biopsy, CT Scan, PET and X- Ray), By End User (Hospital Pharmacies, Retail Pharmacies, and Online Pharmacies) And By Region (North America, Europe, Asia-Pacific, And Rest Of The World) โ€“Market Forecast Till 2032


ID: MRFR/MED/4673-CR | 539 Pages | Author: Kinjoll Dey| June 2018

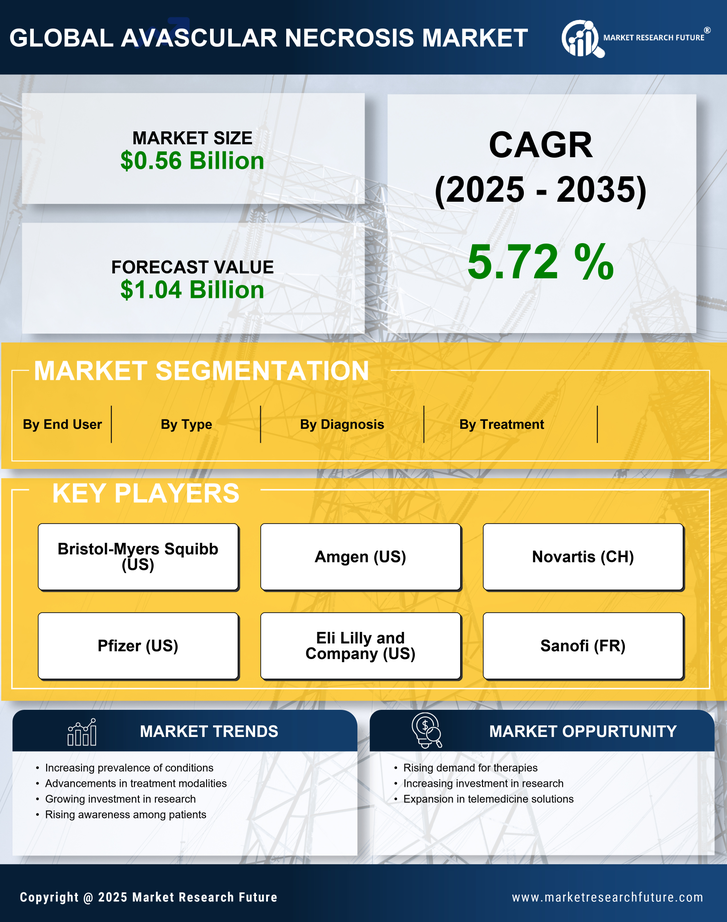
Avascular Necrosis Market Segmentation

Avascular Necrosis Products Type Outlook (USD Billion, 2018-2032)

  • Trauma Related Avascular Necrosis (AVN)

  • Non-Trauma Related Avascular Necrosis (AVN)

Avascular Necrosis Treatment Outlook (USD Billion, 2018-2032)

  • Nonsteroidal Anti-Inflammatory Drugs (NSAIDS)

  • Cholesterol Lowing Drugs

  • Osteoporosis Drugs

  • Blood Thinners

  • Others

Avascular Necrosis Diagnosis Outlook (USD Billion, 2018-2032)

  • Imaging

  • Biopsy

  • CT Scan

  • PET

  • X- Ray

Avascular Necrosis End user Outlook (USD Billion, 2018-2032)

  • Hospital Pharmacies

  • Retail Pharmacies

  • Online Pharmacies

Avascular Necrosis Products Regional Outlook (USD Billion, 2018-2032)

  • North America Outlook (USD Billion, 2018-2032)

    • North America Avascular Necrosis Products by Type

      • Trauma Related Avascular Necrosis (AVN)

      • Non-Trauma Related Avascular Necrosis (AVN)

    • North America Avascular Necrosis by Treatment

      • Nonsteroidal Anti-Inflammatory Drugs (NSAIDS)

      • Cholesterol Lowing Drugs

      • Osteoporosis Drugs

      • Blood Thinners

      • Others

    • North America Avascular Necrosis by Diagnosis

      • Imaging

      • Biopsy

      • CT Scan

      • PET

      • X- Ray

    • North America Avascular Necrosis by End user

      • Hospital Pharmacies

      • Retail Pharmacies

      • Online Pharmacies

    • US Outlook (USD Billion, 2018-2032)

    • US Avascular Necrosis Products by Type

      • Trauma Related Avascular Necrosis (AVN)

      • Non-Trauma Related Avascular Necrosis (AVN)

    • US Avascular Necrosis by Treatment

      • Nonsteroidal Anti-Inflammatory Drugs (NSAIDS)

      • Cholesterol Lowing Drugs

      • Osteoporosis Drugs

      • Blood Thinners

      • Others

    • US Avascular Necrosis by Diagnosis

      • Imaging

      • Biopsy

      • CT Scan

      • PET

      • X- Ray

    • US Avascular Necrosis by End user

      • Hospital Pharmacies

      • Retail Pharmacies

      • Online Pharmacies

    • CANADA Outlook (USD Billion, 2018-2032)

    • CANADA Avascular Necrosis Products by Type

      • Trauma Related Avascular Necrosis (AVN)

      • Non-Trauma Related Avascular Necrosis (AVN)

    • CANADA Avascular Necrosis by Treatment

      • Nonsteroidal Anti-Inflammatory Drugs (NSAIDS)

      • Cholesterol Lowing Drugs

      • Osteoporosis Drugs

      • Blood Thinners

      • Others

    • CANADA Avascular Necrosis by Diagnosis

      • Imaging

      • Biopsy

      • CT Scan

      • PET

      • X- Ray

    • CANADA Avascular Necrosis by End user

      • Hospital Pharmacies

      • Retail Pharmacies

      • Online Pharmacies

  • Europe Outlook (USD Billion, 2018-2032)

    • Europe Avascular Necrosis Products by Type

      • Trauma Related Avascular Necrosis (AVN)

      • Non-Trauma Related Avascular Necrosis (AVN)

    • Europe Avascular Necrosis by Treatment

      • Nonsteroidal Anti-Inflammatory Drugs (NSAIDS)

      • Cholesterol Lowing Drugs

      • Osteoporosis Drugs

      • Blood Thinners

      • Others

    • Europe Avascular Necrosis by Diagnosis

      • Imaging

      • Biopsy

      • CT Scan

      • PET

      • X- Ray

    • Europe Avascular Necrosis by End user

      • Hospital Pharmacies

      • Retail Pharmacies

      • Online Pharmacies

    • Germany Outlook (USD Billion, 2018-2032)

    • Germany Avascular Necrosis Products by Type

      • Trauma Related Avascular Necrosis (AVN)

      • Non-Trauma Related Avascular Necrosis (AVN)

    • Germany Avascular Necrosis by Treatment

      • Nonsteroidal Anti-Inflammatory Drugs (NSAIDS)

      • Cholesterol Lowing Drugs

      • Osteoporosis Drugs

      • Blood Thinners

      • Others

    • Germany Avascular Necrosis by Diagnosis

      • Imaging

      • Biopsy

      • CT Scan

      • PET

      • X- Ray

    • Germany Avascular Necrosis by End user

      • Hospital Pharmacies

      • Retail Pharmacies

      • Online Pharmacies

    • France Outlook (USD Billion, 2018-2032)

    • France Avascular Necrosis Products by Type

      • Trauma Related Avascular Necrosis (AVN)

      • Non-Trauma Related Avascular Necrosis (AVN)

    • France Avascular Necrosis by Treatment

      • Nonsteroidal Anti-Inflammatory Drugs (NSAIDS)

      • Cholesterol Lowing Drugs

      • Osteoporosis Drugs

      • Blood Thinners

      • Others

    • France Avascular Necrosis by Diagnosis

      • Imaging

      • Biopsy

      • CT Scan

      • PET

      • X- Ray

    • France Avascular Necrosis by End user

      • Hospital Pharmacies

      • Retail Pharmacies

      • Online Pharmacies

    • UK Outlook (USD Billion, 2018-2032)

    • UK Avascular Necrosis Products by Type

      • Trauma Related Avascular Necrosis (AVN)

      • Non-Trauma Related Avascular Necrosis (AVN)

    • UK Avascular Necrosis by Treatment

      • Nonsteroidal Anti-Inflammatory Drugs (NSAIDS)

      • Cholesterol Lowing Drugs

      • Osteoporosis Drugs

      • Blood Thinners

      • Others

    • UK Avascular Necrosis by Diagnosis

      • Imaging

      • Biopsy

      • CT Scan

      • PET

      • X- Ray

    • UK Avascular Necrosis by End user

      • Hospital Pharmacies

      • Retail Pharmacies

      • Online Pharmacies

    • ITALY Outlook (USD Billion, 2018-2032)

    • ITALY Avascular Necrosis Products by Type

      • Trauma Related Avascular Necrosis (AVN)

      • Non-Trauma Related Avascular Necrosis (AVN)

    • ITALY Avascular Necrosis by Treatment

      • Nonsteroidal Anti-Inflammatory Drugs (NSAIDS)

      • Cholesterol Lowing Drugs

      • Osteoporosis Drugs

      • Blood Thinners

      • Others

    • ITALY Avascular Necrosis by Diagnosis

      • Imaging

      • Biopsy

      • CT Scan

      • PET

      • X- Ray

    • ITALY Avascular Necrosis by End user

      • Hospital Pharmacies

      • Retail Pharmacies

      • Online Pharmacies

    • SPAIN Outlook (USD Billion, 2018-2032)

    • Spain Avascular Necrosis Products by Type

      • Trauma Related Avascular Necrosis (AVN)

      • Non-Trauma Related Avascular Necrosis (AVN)

    • Spain Avascular Necrosis by Treatment

      • Nonsteroidal Anti-Inflammatory Drugs (NSAIDS)

      • Cholesterol Lowing Drugs

      • Osteoporosis Drugs

      • Blood Thinners

      • Others

    • Spain Avascular Necrosis by Diagnosis

      • Imaging

      • Biopsy

      • CT Scan

      • PET

      • X- Ray

    • Spain Avascular Necrosis by End user

      • Hospital Pharmacies

      • Retail Pharmacies

      • Online Pharmacies

    • Rest Of Europe Outlook (USD Billion, 2018-2032)

    • Rest Of Europe Avascular Necrosis Products by Type

      • Trauma Related Avascular Necrosis (AVN)

      • Non-Trauma Related Avascular Necrosis (AVN)

    • Rest Of Europe Avascular Necrosis by Treatment

      • Nonsteroidal Anti-Inflammatory Drugs (NSAIDS)

      • Cholesterol Lowing Drugs

      • Osteoporosis Drugs

      • Blood Thinners

      • Others

    • Rest Of Europe Avascular Necrosis by Diagnosis

      • Imaging

      • Biopsy

      • CT Scan

      • PET

      • X- Ray

    • Rest Of Europe Avascular Necrosis by End user

      • Hospital Pharmacies

      • Retail Pharmacies

      • Online Pharmacies

  • Asia-Pacific Outlook (USD Billion, 2018-2032)

    • Asia-Pacific Avascular Necrosis Products by Type

      • Trauma Related Avascular Necrosis (AVN)

      • Non-Trauma Related Avascular Necrosis (AVN)

    • Asia-Pacific Avascular Necrosis by Treatment

      • Nonsteroidal Anti-Inflammatory Drugs (NSAIDS)

      • Cholesterol Lowing Drugs

      • Osteoporosis Drugs

      • Blood Thinners

      • Others

    • Asia-Pacific Avascular Necrosis by Diagnosis

      • Imaging

      • Biopsy

      • CT Scan

      • PET

      • X- Ray

    • Asia-Pacific Avascular Necrosis by End user

      • Hospital Pharmacies

      • Retail Pharmacies

      • Online Pharmacies

    • China Outlook (USD Billion, 2018-2032)

    • China Avascular Necrosis Products by Type

      • Trauma Related Avascular Necrosis (AVN)

      • Non-Trauma Related Avascular Necrosis (AVN)

    • China Avascular Necrosis by Treatment

      • Nonsteroidal Anti-Inflammatory Drugs (NSAIDS)

      • Cholesterol Lowing Drugs

      • Osteoporosis Drugs

      • Blood Thinners

      • Others

    • China Avascular Necrosis by Diagnosis

      • Imaging

      • Biopsy

      • CT Scan

      • PET

      • X- Ray

    • China Avascular Necrosis by End user

      • Hospital Pharmacies

      • Retail Pharmacies

      • Online Pharmacies

    • Japan Outlook (USD Billion, 2018-2032)

    • Japan Avascular Necrosis Products by Type

      • Trauma Related Avascular Necrosis (AVN)

      • Non-Trauma Related Avascular Necrosis (AVN)

    • Japan Avascular Necrosis by Treatment

      • Nonsteroidal Anti-Inflammatory Drugs (NSAIDS)

      • Cholesterol Lowing Drugs

      • Osteoporosis Drugs

      • Blood Thinners

      • Others

    • Japan Avascular Necrosis by Diagnosis

      • Imaging

      • Biopsy

      • CT Scan

      • PET

      • X- Ray

    • Japan Avascular Necrosis by End user

      • Hospital Pharmacies

      • Retail Pharmacies

      • Online Pharmacies

    • India Outlook (USD Billion, 2018-2032)

    • India Avascular Necrosis Products by Type

      • Trauma Related Avascular Necrosis (AVN)

      • Non-Trauma Related Avascular Necrosis (AVN)

    • India Avascular Necrosis by Treatment

      • Nonsteroidal Anti-Inflammatory Drugs (NSAIDS)

      • Cholesterol Lowing Drugs

      • Osteoporosis Drugs

      • Blood Thinners

      • Others

    • India Avascular Necrosis by Diagnosis

      • Imaging

      • Biopsy

      • CT Scan

      • PET

      • X- Ray

    • India Avascular Necrosis by End user

      • Hospital Pharmacies

      • Retail Pharmacies

      • Online Pharmacies

    • Australia Outlook (USD Billion, 2018-2032)

    • Australia Avascular Necrosis Products by Type

      • Trauma Related Avascular Necrosis (AVN)

      • Non-Trauma Related Avascular Necrosis (AVN)

    • Australia Avascular Necrosis by Treatment

      • Nonsteroidal Anti-Inflammatory Drugs (NSAIDS)

      • Cholesterol Lowing Drugs

      • Osteoporosis Drugs

      • Blood Thinners

      • Others

    • Australia Avascular Necrosis by Diagnosis

      • Imaging

      • Biopsy

      • CT Scan

      • PET

      • X- Ray

    • Australia Avascular Necrosis by End user

      • Hospital Pharmacies

      • Retail Pharmacies

      • Online Pharmacies

    • Rest of Asia-Pacific Outlook (USD Billion, 2018-2032)

    • Rest of Asia-Pacific Avascular Necrosis Products by Type

      • Trauma Related Avascular Necrosis (AVN)

      • Non-Trauma Related Avascular Necrosis (AVN)

    • Rest of Asia-Pacific Avascular Necrosis by Treatment

      • Nonsteroidal Anti-Inflammatory Drugs (NSAIDS)

      • Cholesterol Lowing Drugs

      • Osteoporosis Drugs

      • Blood Thinners

      • Others

    • Rest of Asia-Pacific Avascular Necrosis by Diagnosis

      • Imaging

      • Biopsy

      • CT Scan

      • PET

      • X- Ray

    • Rest of Asia-Pacific Avascular Necrosis by End user

      • Hospital Pharmacies

      • Retail Pharmacies

      • Online Pharmacies

  • Rest of the World Outlook (USD Billion, 2018-2032)

    • Rest of the World Avascular Necrosis Products by Type

      • Trauma Related Avascular Necrosis (AVN)

      • Non-Trauma Related Avascular Necrosis (AVN)

    • Rest of the World Avascular Necrosis by Treatment

      • Nonsteroidal Anti-Inflammatory Drugs (NSAIDS)

      • Cholesterol Lowing Drugs

      • Osteoporosis Drugs

      • Blood Thinners

      • Others

    • Rest of the World Avascular Necrosis by Diagnosis

      • Imaging

      • Biopsy

      • CT Scan

      • PET

      • X- Ray

    • Rest of the World Avascular Necrosis by End user

      • Hospital Pharmacies

      • Retail Pharmacies

      • Online Pharmacies

    • Middle East Outlook (USD Billion, 2018-2032)

    • Middle East Avascular Necrosis Products by Type

      • Trauma Related Avascular Necrosis (AVN)

      • Non-Trauma Related Avascular Necrosis (AVN)

    • Middle East Avascular Necrosis by Treatment

      • Nonsteroidal Anti-Inflammatory Drugs (NSAIDS)

      • Cholesterol Lowing Drugs

      • Osteoporosis Drugs

      • Blood Thinners

      • Others

    • Middle East Avascular Necrosis by Diagnosis

      • Imaging

      • Biopsy

      • CT Scan

      • PET

      • X- Ray

    • Middle East Avascular Necrosis by End user

      • Hospital Pharmacies

      • Retail Pharmacies

      • Online Pharmacies

    • Africa Outlook (USD Billion, 2018-2032)

    • Africa Avascular Necrosis Products by Type

      • Trauma Related Avascular Necrosis (AVN)

      • Non-Trauma Related Avascular Necrosis (AVN)

    • Africa Avascular Necrosis by Treatment

      • Nonsteroidal Anti-Inflammatory Drugs (NSAIDS)

      • Cholesterol Lowing Drugs

      • Osteoporosis Drugs

      • Blood Thinners

      • Others

    • Africa Avascular Necrosis by Diagnosis

      • Imaging

      • Biopsy

      • CT Scan

      • PET

      • X- Ray

    • Africa Avascular Necrosis by End user

      • Hospital Pharmacies

      • Retail Pharmacies

      • Online Pharmacies

    • Latin America Outlook (USD Billion, 2018-2032)

    • Latin America Avascular Necrosis Products by Type

      • Trauma Related Avascular Necrosis (AVN)

      • Non-Trauma Related Avascular Necrosis (AVN)

    • Latin America Avascular Necrosis by Treatment

      • Nonsteroidal Anti-Inflammatory Drugs (NSAIDS)

      • Cholesterol Lowing Drugs

      • Osteoporosis Drugs

      • Blood Thinners

      • Others

    • Latin America Avascular Necrosis by Diagnosis

      • Imaging

      • Biopsy

      • CT Scan

      • PET

      • X- Ray

    • Latin America Avascular Necrosis by End user

      • Hospital Pharmacies

      • Retail Pharmacies

      • Online Pharmacies

Leading companies partner with us for data-driven Insights
client_1 client_2 client_3 client_4 client_5 client_6 client_7 client_8 client_9 client_10
Please fill in Business Email for Quick Response

1 Executive Summary

2 Market Introduction

2.1 Scope Of Study 32

2.2 Research Objective 32

2.3 List Of Assumptions 32

2.4 Market Structure 33

3 Research Methodology

3.1 Research Process 35

3.2 Primary Research 36

3.3 Secondary Research 37

3.4 Market Size Estimation 37

3.5 Forecast Model 38

4 Market Dynamics

4.1 Introduction 40

4.2 Drivers 41

4.2.1 Increasing Awareness Along With The High Prevalence Of The Avascular Necrosis Disease 41

4.2.2 Rising Preference Of Surgeries To Cure Osteonecrosis 41

4.2.3 Rising Preference Of Bone Grafting Surgical Procedures With The Less Pain Substitute Procedures 41

4.2.4 Consolidation Of Large Healthcare Providers In The U.S. 42

4.2.5 Technological Advancements In The Development Of Surgical Implants 42

4.3 Restraints 42

4.3.1 The High Cost Of Surgical Procedures And Related Side Effects 42

4.3.2 Worsening Regulatory Landscape And Growing Cost Of Noncompliance In Developed Countries 43

4.4 Opportunities 43

4.4.1 Growing Demand For Non-Invasive Treatments For Faster Recovery 43

4.5 Technology Trends & Assessment 44

4.5.1 Acceptance Of Synthetic Bone-Graft Over Natural Ones 44

4.5.2 Nanotechnology 44

4.5.3 Rising Demand For Incorporating Recombinant DNA Technology In Surgical Implants 44

4.5.4 Development Of Titanium-Foam Implant For Bone Grafting 44

4.5.5 Customized Degradable Implants 44

5 Market Factor Analysis

5.1 Porterโ€™s Five Forces Model 46

5.1.1 Bargaining Power Of Suppliers 46

5.1.2 Bargaining Power Of Buyers 47

5.1.3 Threat Of New Entrants 47

5.1.4 Threat Of Substitutes 47

5.1.5 Intensity Of Rivalry 48

5.2 Value Chain Analysis 48

5.2.1 Research & Development 48

5.2.2 Manufacturing 49

5.2.3 Distribution 49

5.2.4 Marketing & Sales 49

5.2.5 Post-Sales Monitoring 49

5.3 Epidemiology Of Avascular Necrosis 49

6 Avascular Necrosis Market, By Type

6.1 Introduction 54

6.2 Non-Trauma Related Avascular Necrosis 55

6.2.1 Age Group 56

6.2.1.1 Third Decade 57

6.2.1.2 Fifth Decade 57

6.2.2 Causes 58

6.2.2.1 Caisson Disease 59

6.2.2.2 Sickle Cell Anaemia 60

6.2.2.3 Steroid Abuse 60

6.2.2.4 Alcohol Abuse 61

6.3 Trauma-Related Avascular Necrosis 62

7 Avascular Necrosis Market, By Site

7.1 Introduction 64

7.2 Hip Bone 65

7.3 Knee 66

7.4 Shoulder 67

8 Avascular Necrosis Market, By Diagnosis

8.1 Introduction 69

8.2 Imaging 70

8.2.1 X-Ray 72

8.2.2 CT Scan 72

8.2.3 MRI 73

8.2.4 PET 74

8.3 Biopsy 74

9 Avascular Necrosis Market, By Treatment

9.1 Introduction 77

9.2 Medication 78

9.2.1 Medication By NSAIDs (Non-Steroidal Anti-Inflammatory Drugs) 79

9.2.2 Medication By Bisphosphonates 79

9.2.3 Medication By Blood Thinners 80

9.3 Electrical Stimulation 81

9.4 Gene Therapy 82

9.5 Surgery 82

9.5.1 Core Decompression 83

9.5.2 Osteotomy 84

9.5.3 Bone Graft 85

9.5.4 Arthoplasty 85

10 Avascular Necrosis Market, By End-User

10.1 Introduction 88

10.2 Hospitals & Clinics 89

10.3 Diagnostic Centers 90

10.4 Ambulatory Surgical Centers 91

11 Global Avascular Necrosis Market, By Region

11.1 Introduction 93

11.2 Americas 103

Avascular Necrosis Market, By Type

Avascular Necrosis Market, By Site

Avascular Necrosis Market, By Diagnosis

Avascular Necrosis Market, By Treatment

Avascular Necrosis Market, By End-User

11.2.1 North America 112

Avascular Necrosis Market, By Type

Avascular Necrosis Market, By Site

Avascular Necrosis Market, By Diagnosis

Avascular Necrosis Market, By Treatment

Avascular Necrosis Market, By End-User

11.2.1.1 U.S. 123

Avascular Necrosis Market, By Type

Avascular Necrosis Market, By Site

Avascular Necrosis Market, By Diagnosis

Avascular Necrosis Market, By Treatment

Avascular Necrosis Market, By End-User

11.2.1.2 Canada. 131

Avascular Necrosis Market, By Type

Avascular Necrosis Market, By Site

Avascular Necrosis Market, By Diagnosis

Avascular Necrosis Market, By Treatment

Avascular Necrosis Market, By End-User

11.2.2 South America 140

Avascular Necrosis Market, By Type

Avascular Necrosis Market, By Site

Avascular Necrosis Market, By Diagnosis

Avascular Necrosis Market, By Treatment

Avascular Necrosis Market, By End-User

11.3 Europe 149

Avascular Necrosis Market, By Type

Avascular Necrosis Market, By Site

Avascular Necrosis Market, By Diagnosis

Avascular Necrosis Market, By Treatment

Avascular Necrosis Market, By End-User

11.3.1 Western Europe 160

Avascular Necrosis Market, By Type

Avascular Necrosis Market, By Site

Avascular Necrosis Market, By Diagnosis

Avascular Necrosis Market, By Treatment

Avascular Necrosis Market, By End-User

11.3.1.1 Germany 170

Avascular Necrosis Market, By Type

Avascular Necrosis Market, By Site

Avascular Necrosis Market, By Diagnosis

Avascular Necrosis Market, By Treatment

Avascular Necrosis Market, By End-User

11.3.1.2 France 179

Avascular Necrosis Market, By Type

Avascular Necrosis Market, By Site

Avascular Necrosis Market, By Diagnosis

Avascular Necrosis Market, By Treatment

Avascular Necrosis Market, By End-User

11.3.1.3 UK 188

Avascular Necrosis Market, By Type

Avascular Necrosis Market, By Site

Avascular Necrosis Market, By Diagnosis

Avascular Necrosis Market, By Treatment

Avascular Necrosis Market, By End-User

11.3.1.4 Italy 197

Avascular Necrosis Market, By Type

Avascular Necrosis Market, By Site

Avascular Necrosis Market, By Diagnosis

Avascular Necrosis Market, By Treatment

Avascular Necrosis Market, By End-User

11.3.1.5 Spain 206

Avascular Necrosis Market, By Type

Avascular Necrosis Market, By Site

Avascular Necrosis Market, By Diagnosis

Avascular Necrosis Market, By Treatment

Avascular Necrosis Market, By End-User

11.3.1.6 Rest Of Western Europe 215

Avascular Necrosis Market, By Type

Avascular Necrosis Market, By Site

Avascular Necrosis Market, By Diagnosis

Avascular Necrosis Market, By Treatment

Avascular Necrosis Market, By End-User

11.3.2 Eastern Europe 224

Avascular Necrosis Market, By Type

Avascular Necrosis Market, By Site

Avascular Necrosis Market, By Diagnosis

Avascular Necrosis Market, By Treatment

Avascular Necrosis Market, By End-User

11.4 Asia Pacific 232

Avascular Necrosis Market, By Type

Avascular Necrosis Market, By Site

Avascular Necrosis Market, By Diagnosis

Avascular Necrosis Market, By Treatment

Avascular Necrosis Market, By End-User

11.4.1 Japan 243

Avascular Necrosis Market, By Type

Avascular Necrosis Market, By Site

Avascular Necrosis Market, By Diagnosis

Avascular Necrosis Market, By Treatment

Avascular Necrosis Market, By End-User

11.4.2 China 251

Avascular Necrosis Market, By Type

Avascular Necrosis Market, By Site

Avascular Necrosis Market, By Diagnosis

Avascular Necrosis Market, By Treatment

Avascular Necrosis Market, By End-User

11.4.3 India 260

Avascular Necrosis Market, By Type

Avascular Necrosis Market, By Site

Avascular Necrosis Market, By Diagnosis

Avascular Necrosis Market, By Treatment

Avascular Necrosis Market, By End-User

11.4.4 Australia 268

Avascular Necrosis Market, By Type

Avascular Necrosis Market, By Site

Avascular Necrosis Market, By Diagnosis

Avascular Necrosis Market, By Treatment

Avascular Necrosis Market, By End-User

11.4.5 Republic Of Korea 277

Avascular Necrosis Market, By Type

Avascular Necrosis Market, By Site

Avascular Necrosis Market, By Diagnosis

Avascular Necrosis Market, By Treatment

Avascular Necrosis Market, By End-User

11.4.6 Rest Of Asia Pacific 285

Avascular Necrosis Market, By Type

Avascular Necrosis Market, By Site

Avascular Necrosis Market, By Diagnosis

Avascular Necrosis Market, By Treatment

Avascular Necrosis Market, By End-User

11.5 The Middle East & Africa 294

Avascular Necrosis Market, By Type

Avascular Necrosis Market, By Site

Avascular Necrosis Market, By Diagnosis

Avascular Necrosis Market, By Treatment

Avascular Necrosis Market, By End-User

11.5.1.1 Middle East 303

Avascular Necrosis Market, By Type

Avascular Necrosis Market, By Site

Avascular Necrosis Market, By Diagnosis

Avascular Necrosis Market, By Treatment

Avascular Necrosis Market, By End-User

11.5.1.2 Africa 313

Avascular Necrosis Market, By Type

Avascular Necrosis Market, By Site

Avascular Necrosis Market, By Diagnosis

Avascular Necrosis Market, By Treatment

Avascular Necrosis Market, By End-User

12 Competitive Landscape

12.1 Introduction 324

12.2 Company Market Share Analysis 325

12.2.1 Introduction 325

12.3 Key Developments 326

13 Company Profiles

13.1 Sanofi 330

13.1.1 Company Overview 330

13.1.2 Financial Overview 330

13.1.3 Products Offering 331

13.1.4 Key Developments 331

13.1.5 SWOT Analysis 331

13.1.6 Key Strategy 331

13.2 Bayer Healthcare AG 332

13.2.1 Company Overview 332

13.2.2 Financial Overview 332

13.2.3 Products Offering 333

13.2.4 Key Developments 333

13.2.5 SWOT Analysis 333

13.2.6 Key Strategy 333

13.3 Boehringer Ingelheim GmbH 334

13.3.1 Company Overview 334

13.3.2 Financial Overview 334

13.3.3 Products Offering 335

13.3.4 Key Developments 335

13.3.5 SWOT Analysis 335

13.3.6 Key Strategy 335

13.4 Pfizer Inc. 336

13.4.1 Company Overview 336

13.4.2 Financial Overview 336

13.4.3 Products Offering 337

13.4.4 Key Developments 337

13.4.5 SWOT Analysis 337

13.4.6 Key Strategy 337

13.5 Merck KGaA 338

13.5.1 Company Overview 338

13.5.2 Financial Overview 338

13.5.3 Products Offering 339

13.5.4 Key Developments 339

13.5.5 SWOT Analysis 339

13.5.6 Key Strategy 339

13.6 Stryker Corporation 340

13.6.1 Company Overview 340

13.6.2 Financial Overview 340

13.6.3 Products Offering 341

13.6.4 Key Developments 341

13.6.5 SWOT Analysis 342

13.6.6 Key Strategy 342

13.7 Medtronic PLC 343

13.7.1 Company Overview 343

13.7.2 Financial Overview 343

13.7.3 Products Offering 344

13.7.4 Key Developments 344

13.7.5 SWOT Analysis 344

13.7.6 Key Strategy 344

13.8 Aurobindo Pharma 345

13.8.1 Company Overview 345

13.8.2 Financial Overview 345

13.8.3 Products Offering 346

13.8.4 Key Developments 346

13.8.5 SWOT Analysis 347

13.8.6 Key Strategy 347

13.9 Integra LifeSciences Corporation 348

13.9.1 Company Overview 348

13.9.2 Financial Overview 348

13.9.3 Products Offering 349

13.9.4 Key Developments 349

13.9.5 SWOT Analysis 349

13.9.6 Key Strategy 349

13.10 Zimmer Biomet Holdings 350

13.10.1 Company Overview 350

13.10.2 Financial Overview 350

13.10.3 Products Offering 351

13.10.4 Key Developments 351

13.10.5 SWOT Analysis 352

13.10.6 Key Strategy 352

13.11 Wright Medical Group N.V. 353

13.11.1 Company Overview 353

13.11.2 Financial Overview 353

13.11.3 Products Offering 354

13.11.4 Key Developments 354

13.11.5 SWOT Analysis 355

13.11.6 Key Strategy 355

13.12 Grifols SA 356

13.12.1 Company Overview 356

13.12.2 Financial Overview 356

13.12.3 Products Offering 357

13.12.4 Key Developments 357

13.12.5 SWOT Analysis 357

13.12.6 Key Strategy 357

13.13 Smith & Nephew 358

13.13.1 Company Overview 358

13.13.2 Financial Overview 358

13.13.3 Products Offering 359

13.13.4 Key Developments 359

13.13.5 SWOT Analysis 360

13.13.6 Key Strategy 360

13.14 Ethicon Inc. 361

13.14.1 Company Overview 361

13.14.2 Financial Overview 361

13.14.3 Products Offering 362

13.14.4 Key Developments 362

13.14.5 SWOT Analysis 363

13.14.6 Key Strategy 363

14 Conclusion

14.1 Key Findings 365

14.1.1 CEOโ€™s Viewpoint 365

14.1.2 Unmet Needs 365

14.1.3 Key Companies To Watch 365

14.1.4 Prediction 365

15 Appendix

15.1 Discussion Blue Print 367

16 List Of Tables

TABLE 1 MARKET SYNOPSIS 30

TABLE 2 LIST OF ASSUMPTIONS 32

TABLE 3 NORTH AMERICA PROCEDURE NUMBERS, 2020โ€“2016 (UNITS) 50

TABLE 4 NORTH AMERICA PROCEDURE NUMBERS, 2027โ€“2027 (UNITS) 50

TABLE 5 SOUTH AMERICA PROCEDURE NUMBERS, 2020โ€“2016 (UNITS) 50

TABLE 6 SOUTH AMERICA PROCEDURE NUMBERS, 2027โ€“2027 (UNITS) 50

TABLE 7 EUROPE PROCEDURE NUMBERS, 2020โ€“2016 (UNITS) 51

TABLE 8 EUROPE PROCEDURE NUMBERS, 2027โ€“2027 (UNITS) 51

TABLE 9 ASIA PACIFIC PROCEDURE NUMBERS, 2020โ€“2016 (UNITS) 51

TABLE 10 ASIA PACIFIC PROCEDURE NUMBERS, 2027โ€“2027 (UNITS) 51

TABLE 11 MIDDLE EAST PROCEDURE NUMBERS, 2020โ€“2016 (UNITS) 52

TABLE 12 MIDDLE EAST PROCEDURE NUMBERS, 2027โ€“2027 (UNITS) 52

TABLE 13 AFRICA PROCEDURE NUMBERS, 2020โ€“2016 (UNITS) 52

TABLE 14 AFRICA PROCEDURE NUMBERS, 2027โ€“2027 (UNITS) 52

TABLE 15 GLOBAL AVASCULAR NECROSIS MARKET, BY TYPE, 2020โ€“2027 (USD MILLION) 54

TABLE 16 GLOBAL AVASCULAR NECROSIS MARKET, BY TYPE, 2023-2032 (USD MILLION) 54

TABLE 17 GLOBAL AVASCULAR NECROSIS MARKET FOR NON-TRAUMA RELATED AVASCULAR NECROSIS OR OSTEONECROSIS, BY REGION, 2020โ€“2027 (USD MILLION) 55

TABLE 18 GLOBAL AVASCULAR NECROSIS MARKET FOR NON-TRAUMA RELATED AVASCULAR NECROSIS OR OSTEONECROSIS, BY REGION, 2020โ€“2027 (USD MILLION) 56

TABLE 19 GLOBAL AVASCULAR NECROSIS MARKET, BY AGE GROUP, 2020โ€“2027 (USD MILLION) 56

TABLE 20 GLOBAL AVASCULAR NECROSIS MARKET, BY AGE GROUP,2020โ€“2027 (USD MILLION) 56

TABLE 21 GLOBAL AVASCULAR NECROSIS MARKET FOR THIRD DECADE, BY REGION 2020โ€“2027 (USD MILLION) 57

TABLE 22 GLOBAL AVASCULAR NECROSIS MARKET FOR THIRD DECADE, BY REGION, 2020โ€“2027 (USD MILLION) 57

TABLE 23 GLOBAL AVASCULAR NECROSIS MARKET FOR FIFTH DECADE, BY REGION, 2020โ€“2027 (USD MILLION) 57

TABLE 24 GLOBAL AVASCULAR NECROSIS MARKET FOR FIFTH DECADE, BY REGION, 2020โ€“2027 (USD MILLION) 58

TABLE 25 GLOBAL AVASCULAR NECROSIS MARKET, BY CAUSES, 2020โ€“2027 (USD MILLION) 58

TABLE 26 GLOBAL AVASCULAR NECROSIS MARKET, BY CAUSES, 2020โ€“2027 (USD MILLION) 59

TABLE 27 GLOBAL AVASCULAR NECROSIS MARKET FOR CAISSON DISEASE, BY REGION, 2020โ€“2027 (USD MILLION) 59

TABLE 28 GLOBAL AVASCULAR NECROSIS MARKET FOR CAISSON DISEASE, BY REGION, 2020โ€“2027 (USD MILLION) 59

TABLE 29 GLOBAL AVASCULAR NECROSIS MARKET FOR SICKLE CELL ANAEMIA, BY REGION, 2020โ€“2027 (USD MILLION) 60

TABLE 30 GLOBAL AVASCULAR NECROSIS MARKET FOR SICKLE CELL ANEMIA, BY REGION, 2020โ€“2027 (USD MILLION) 60

TABLE 31 GLOBAL AVASCULAR NECROSIS MARKET FOR STEROID ABUSE, BY REGION, 2020โ€“2027 (USD MILLION) 60

TABLE 32 GLOBAL AVASCULAR NECROSIS MARKET FOR STEROID ABUSE, BY REGION, 2020โ€“2027 (USD MILLION) 61

TABLE 33 GLOBAL AVASCULAR NECROSIS MARKET FOR ALCOHOL ABUSE, BY REGION, 2020โ€“2027 (USD MILLION) 61

TABLE 34 GLOBAL AVASCULAR NECROSIS MARKET FOR ALCOHOL ABUSE, BY REGION, 2020โ€“2027 (USD MILLION) 61

TABLE 35 GLOBAL AVASCULAR NECROSIS MARKET FOR TRAUMA RELATED AVASCULAR NECROSIS OR OSTEONECROSIS, BY REGION, 2020โ€“2027 (USD MILLION) 62

TABLE 36 GLOBAL AVASCULAR NECROSIS MARKET FOR TRAUMA RELATED AVASCULAR NECROSIS OR OSTEONECROSIS, BY REGION, 2020โ€“2027 (USD MILLION) 62

TABLE 37 GLOBAL AVASCULAR NECROSIS MARKET, BY SITE, 2020โ€“2027 (USD MILLION) 64

TABLE 38 GLOBAL AVASCULAR NECROSIS MARKET, BY SITE, 2020โ€“2027 (USD MILLION) 65

TABLE 39 GLOBAL AVASCULAR NECROSIS MARKET FOR HIP BONE, BY REGION, 2020โ€“2027 (USD MILLION) 65

TABLE 40 GLOBAL AVASCULAR NECROSIS MARKET, FOR HIP BONE, BY REGION, 2020โ€“2027 (USD MILLION) 66

TABLE 41 GLOBAL AVASCULAR NECROSIS MARKET FOR KNEE, BY REGION, 2020โ€“2027 (USD MILLION) 66

TABLE 42 GLOBAL AVASCULAR NECROSIS MARKET FOR KNEE, BY REGION, 2020โ€“2027 (USD MILLION) 66

TABLE 43 GLOBAL AVASCULAR NECROSIS MARKET FOR SHOULDER, BY REGION, 2020โ€“2027 (USD MILLION) 67

TABLE 44 GLOBAL AVASCULAR NECROSIS MARKET FOR SHOULDER, BY REGION, 2020โ€“2027 (USD MILLION) 67

TABLE 45 GLOBAL AVASCULAR NECROSIS MARKET BY DIAGNOSIS, 2020โ€“2027 (USD MILLION) 69

TABLE 46 GLOBAL AVASCULAR NECROSIS MARKET BY DIAGNOSIS, 2020โ€“2027 (USD MILLION) 69

TABLE 47 GLOBAL AVASCULAR NECROSIS MARKET FOR IMAGING, BY REGION, 2020โ€“2027 (USD MILLION) 70

TABLE 48 GLOBAL AVASCULAR NECROSIS MARKET FOR IMAGING, BY REGION, 2020โ€“2027 (USD MILLION) 71

TABLE 49 GLOBAL AVASCULAR NECROSIS MARKET FOR DIAGNOSIS, BY IMAGING, 2020โ€“2027 (USD MILLION) 71

TABLE 50 GLOBAL AVASCULAR NECROSIS MARKET FOR DIAGNOSIS, BY IMAGING, 2020โ€“2027 (USD MILLION) 71

TABLE 51 GLOBAL AVASCULAR NECROSIS MARKET FOR X-RAY, BY REGION, 2020โ€“2027 (USD MILLION) 72

TABLE 52 GLOBAL AVASCULAR NECROSIS MARKET FOR X-RAY , BY REGION, 2020โ€“2027 (USD MILLION) 72

TABLE 53 GLOBAL AVASCULAR NECROSIS MARKET FOR CT SCAN, BY REGION, 2020โ€“2027 (USD MILLION) 72

TABLE 54 GLOBAL AVASCULAR NECROSIS MARKET FOR CT SCAN, BY REGION, 2020โ€“2027 (USD MILLION) 73

TABLE 55 GLOBAL AVASCULAR NECROSIS MARKET FOR MRI, BY REGION, 2020โ€“2027 (USD MILLION) 73

TABLE 56 GLOBAL AVASCULAR NECROSIS MARKET FOR MRI, BY REGION, 2020โ€“2027 (USD MILLION) 73

TABLE 57 GLOBAL AVASCULAR NECROSIS MARKET FOR PET, BY REGION, 2020โ€“2027 (USD MILLION) 74

TABLE 58 GLOBAL AVASCULAR NECROSIS MARKET FOR PET, BY REGION, 2020โ€“2027 (USD MILLION) 74

TABLE 59 GLOBAL AVASCULAR NECROSIS MARKET FOR BIOPSY, BY REGION, 2020โ€“2027 (USD MILLION) 75

TABLE 60 GLOBAL AVASCULAR NECROSIS MARKET FOR BIOPSY, BY REGION, 2020โ€“2027 (USD MILLION) 75

TABLE 61 GLOBAL AVASCULAR NECROSIS MARKET BY TREATMENT, 2020โ€“2027 (USD MILLION) 77

TABLE 62 GLOBAL AVASCULAR NECROSIS MARKET BY TREATMENT, 2020โ€“2027 (USD MILLION) 78

TABLE 63 GLOBAL AVASCULAR NECROSIS MARKET FOR TREATMENT, BY MEDICATION, BY REGION, 2020โ€“2027 (USD MILLION) 78

TABLE 64 GLOBAL AVASCULAR NECROSIS MARKET FOR TREATMENT, BY MEDICATION, BY REGION, 2020โ€“2027 (USD MILLION) 78

TABLE 65 GLOBAL AVASCULAR NECROSIS MARKET FOR MEDICATION, BY NSAIDS, 2020โ€“2027 (USD MILLION) 79

TABLE 66 GLOBAL AVASCULAR NECROSIS MARKET FOR MEDICATION BY NSAIDS, 2020โ€“2027 (USD MILLION) 79

TABLE 67 GLOBAL AVASCULAR NECROSIS MARKET FOR MEDICATION BY BISPHOSPHONATES, 2020โ€“2027 (USD MILLION) 80

TABLE 68 GLOBAL AVASCULAR NECROSIS MARKET FOR MEDICATION BY BISPHOSPHONATES, 2020โ€“2027 (USD MILLION) 80

TABLE 69 GLOBAL AVASCULAR NECROSIS MARKET FOR MEDICATION BY BLOOD THINNERS, 2020โ€“2027 (USD MILLION) 80

TABLE 70 GLOBAL AVASCULAR NECROSIS MARKET FOR MEDICATION BY BLOOD THINNERS, 2020โ€“2027 (USD MILLION) 81

TABLE 71 GLOBAL AVASCULAR NECROSIS MARKET FOR ELECTRICAL STIMULATION, BY REGION, 2020โ€“2027 (USD MILLION) 81

TABLE 72 GLOBAL AVASCULAR NECROSIS MARKET FOR ELECTRICAL STIMULATION, BY REGION, 2020โ€“2027 (USD MILLION) 81

TABLE 73 GLOBAL AVASCULAR NECROSIS MARKET FOR GENE THERAPY, BY REGION, 2020โ€“2027 (USD MILLION) 82

TABLE 74 GLOBAL AVASCULAR NECROSIS MARKET FOR GENE THERAPY, BY REGION, 2020โ€“2027 (USD MILLION) 82

TABLE 75 GLOBAL AVASCULAR NECROSIS MARKET FOR GENE THERAPY, BY REGION, 2020โ€“2027 (USD MILLION) 83

TABLE 76 GLOBAL AVASCULAR NECROSIS MARKET FOR GENE THERAPY, BY REGION, 2020โ€“2027 (USD MILLION) 83

TABLE 77 GLOBAL AVASCULAR NECROSIS MARKET FOR CORE DECOMPRESSION, BY REGION, 2020โ€“2027 (USD MILLION) 83

TABLE 78 GLOBAL AVASCULAR NECROSIS MARKET FOR CORE DECOMPRESSION , BY REGION, 2020โ€“2027 (USD MILLION) 84

TABLE 79 GLOBAL AVASCULAR NECROSIS MARKET FOR OSTEOTOMY , BY REGION, 2020โ€“2027 (USD MILLION) 84

TABLE 80 GLOBAL AVASCULAR NECROSIS MARKET FOR OSTEOTOMY, BY REGION, 2020โ€“2027 (USD MILLION) 84

TABLE 81 GLOBAL AVASCULAR NECROSIS MARKET FOR BONE GRAFT, BY REGION, 2020โ€“2027 (USD MILLION) 85

TABLE 82 GLOBAL AVASCULAR NECROSIS MARKET FOR BONE GRAFT, BY REGION, 2020โ€“2027 (USD MILLION) 85

TABLE 83 GLOBAL AVASCULAR NECROSIS MARKET FOR ARTHOPLASTY, BY REGION, 2020โ€“2027 (USD MILLION) 85

TABLE 84 GLOBAL AVASCULAR NECROSIS MARKET FOR ARTHOPLASTY, BY REGION, 2020โ€“2027 (USD MILLION) 86

TABLE 85 GLOBAL AVASCULAR NECROSIS MARKET FOR END USER, BY REGION, 2020โ€“2027 (USD MILLION) 88

TABLE 86 GLOBAL AVASCULAR NECROSIS MARKET FOR END USER, BY REGION, 2020โ€“2027 (USD MILLION) 88

TABLE 87 GLOBAL AVASCULAR NECROSIS MARKET FOR HOSPITALS & CLINICS, BY REGION, 2020โ€“2027 (USD MILLION) 89

TABLE 88 GLOBAL AVASCULAR NECROSIS MARKET FOR HOSPITALS & CLINICS, BY REGION, 2020โ€“2027 (USD MILLION) 89

TABLE 89 GLOBAL AVASCULAR NECROSIS MARKET FOR DIAGNOSTIC CENTERS, BY REGION, 2020โ€“2027 (USD MILLION) 90

TABLE 90 GLOBAL AVASCULAR NECROSIS MARKET FOR DIAGNOSTIC CENTERS , BY REGION, 2020โ€“2027 (USD MILLION) 90

TABLE 91 GLOBAL AVASCULAR NECROSIS MARKET FOR AMBULATORY SURGICAL CENTERS , BY REGION, 2020 2027 (USD MILLION) 91

TABLE 92 GLOBAL AVASCULAR NECROSIS MARKET FOR AMBULATORY SURGICAL CENTERS , BY REGION, 2020โ€“2027 (USD MILLION) 91

TABLE 93 GLOBAL AVASCULAR NECROSIS MARKET, BY REGION, 2023-2032 (USD MILLION) 93

TABLE 94 GLOBAL AVASCULAR NECROSIS MARKET, BY REGION, 2023-2032 (USD MILLION) 93

TABLE 95 GLOBAL AVASCULAR NECROSIS MARKET, BY TYPE, 2023-2032 (USD MILLION) 94

TABLE 96 GLOBAL AVASCULAR NECROSIS MARKET, BY TYPE, 2023-2032 (USD MILLION) 94

TABLE 97 GLOBAL NON-TRAUMA RELATED AVN MARKET, BY AGE GROUP, 2023-2032 (USD MILLION) 95

TABLE 98 GLOBAL NON-TRAUMA RELATED AVN MARKET, BY AGE GROUP, 2023-2032 (USD MILLION) 95

TABLE 99 GLOBAL NON-TRAUMA RELATED AVN MARKET, BY CAUSES, 2023-2032 (USD MILLION) 95

TABLE 100 GLOBAL NON-TRAUMA RELATED AVN MARKET, BY CAUSES, 2023-2032 (USD MILLION) 96

TABLE 101 GLOBAL AVASCULAR NECROSIS MARKET, BY SITE, 2023-2032 (USD MILLION) 96

TABLE 102 GLOBAL AVASCULAR NECROSIS MARKET, BY SITE, 2023-2032 (USD MILLION) 96

TABLE 103 GLOBAL AVASCULAR NECROSIS MARKET, BY DIAGNOSIS, 2023-2032 (USD MILLION) 97

TABLE 104 GLOBAL AVASCULAR NECROSIS MARKET, BY DIAGNOSIS, 2023-2032 (USD MILLION) 97

TABLE 105 GLOBAL AVASCULAR NECROSIS MARKET FOR DIAGNOSIS, BY IMAGING, 2023-2032 (USD MILLION) 97

TABLE 106 GLOBAL AVASCULAR NECROSIS MARKET FOR DIAGNOSIS, BY IMAGING, 2023-2032 (USD MILLION) 98

TABLE 107 GLOBAL AVASCULAR NECROSIS MARKET, BY TREATMENT, 2023-2032 (USD MILLION) 98

TABLE 108 GLOBAL AVASCULAR NECROSIS MARKET, BY TREATMENT, 2023-2032 (USD MILLION) 98

TABLE 109 GLOBAL AVASCULAR NECROSIS MARKET FOR TREATMENT, BY MEDICATION, 2023-2032 (USD MILLION) 99

TABLE 110 GLOBAL AVASCULAR NECROSIS MARKET FOR TREATMENT, BY MEDICATION, 2023-2032 (USD MILLION) 99

TABLE 111 GLOBAL AVASCULAR NECROSIS MARKET FOR MEDICATION, BY NSAIDS, 2023-2032 (USD MILLION) 99

TABLE 112 GLOBAL AVASCULAR NECROSIS MARKET FOR MEDICATION, BY NSAIDS, 2023-2032 (USD MILLION) 100

TABLE 113 GLOBAL AVASCULAR NECROSIS MARKET FOR MEDICATION BY BISPHOSPHONATES, 2023-2032 (USD MILLION) 100

TABLE 114 GLOBAL AVASCULAR NECROSIS MARKET FOR MEDICATION BY BISPHOSPHONATES, 2023-2032 (USD MILLION) 100

TABLE 115 GLOBAL AVASCULAR NECROSIS MARKET FOR MEDICATION BY BLOOD THINNERS, 2023-2032 (USD MILLION) 101

TABLE 116 GLOBAL AVASCULAR NECROSIS MARKET FOR MEDICATION BY BLOOD THINNERS, 2023-2032 (USD MILLION) 101

TABLE 117 GLOBAL AVASCULAR NECROSIS MARKET FOR TREATMENT BY SURGERY, 2023-2032 (USD MILLION) 101

TABLE 118 GLOBAL AVASCULAR NECROSIS MARKET FOR TREATMENT BY SURGERY, 2023-2032 (USD MILLION) 102

TABLE 119 GLOBAL AVASCULAR NECROSIS MARKET FOR END USER, 2023-2032 (USD MILLION) 102

TABLE 120 GLOBAL AVASCULAR NECROSIS MARKET FOR END USER, 2023-2032 (USD MILLION) 102

TABLE 121 AMERICAS AVASCULAR NECROSIS MARKET, BY REGION, 2023-2032 (USD MILLION) 103

TABLE 122 AMERICAS AVASCULAR NECROSIS MARKET, BY REGION, 2023-2032 (USD MILLION) 103

TABLE 123 AMERICAS AVASCULAR NECROSIS MARKET, BY TYPE, 2023-2032 (USD MILLION) 104

TABLE 124 AMERICAS AVASCULAR NECROSIS MARKET, BY TYPE, 2023-2032 (USD MILLION) 104

TABLE 125 AMERICAS NON-TRAUMA RELATED AVN MARKET, BY AGE GROUP, 2023-2032 (USD MILLION) 104

TABLE 126 AMERICAS NON-TRAUMA RELATED AVN MARKET, BY AGE GROUP, 2023-2032 (USD MILLION) 105

TABLE 127 AMERICAS NON-TRAUMA RELATED AVN MARKET, BY CAUSES, 2023-2032 (USD MILLION) 105

TABLE 128 AMERICAS NON-TRAUMA RELATED AVN MARKET, BY CAUSES, 2023-2032 (USD MILLION) 105

TABLE 129 AMERICAS AVASCULAR NECROSIS MARKET, BY SITE, 2023-2032 (USD MILLION) 106

TABLE 130 AMERICAS AVASCULAR NECROSIS MARKET, BY SITE, 2023-2032 (USD MILLION) 106

TABLE 131 AMERICAS AVASCULAR NECROSIS MARKET, BY DIAGNOSIS, 2023-2032 (USD MILLION) 106

TABLE 132 AMERICAS AVASCULAR NECROSIS MARKET, BY DIAGNOSIS, 2023-2032 (USD MILLION) 106

TABLE 133 AMERICAS AVASCULAR NECROSIS MARKET FOR DIAGNOSIS, BY IMAGING, 2023-2032 (USD MILLION) 107

TABLE 134 AMERICAS AVASCULAR NECROSIS MARKET FOR DIAGNOSIS, BY IMAGING, 2023-2032 (USD MILLION) 107

TABLE 135 AMERICAS AVASCULAR NECROSIS MARKET, BY TREATMENT, 2023-2032 (USD MILLION) 107

TABLE 136 AMERICAS AVASCULAR NECROSIS MARKET, BY TREATMENT, 2023-2032 (USD MILLION) 108

TABLE 137 AMERICAS AVASCULAR NECROSIS MARKET FOR TREATMENT, BY MEDICATION, 2023-2032 (USD MILLION) 108

TABLE 138 AMERICAS AVASCULAR NECROSIS MARKET FOR TREATMENT, BY MEDICATION, 2023-2032 (USD MILLION) 108

TABLE 139 AMERICAS AVASCULAR NECROSIS MARKET FOR MEDICATION, BY NSAIDS, 2023-2032 (USD MILLION) 109

TABLE 140 AMERICAS AVASCULAR NECROSIS MARKET FOR MEDICATION, BY NSAIDS, 2023-2032 (USD MILLION) 109

TABLE 141 AMERICAS AVASCULAR NECROSIS MARKET FOR MEDICATION BY BISPHOSPHONATES, 2023-2032 (USD MILLION) 109

TABLE 142 AMERICAS AVASCULAR NECROSIS MARKET FOR MEDICATION BY BISPHOSPHONATES, 2023-2032 (USD MILLION) 110

TABLE 143 AMERICAS AVASCULAR NECROSIS MARKET FOR MEDICATION BY BLOOD THINNERS, 2023-2032 (USD MILLION) 110

TABLE 144 AMERICAS AVASCULAR NECROSIS MARKET FOR MEDICATION BY BLOOD THINNERS, 2023-2032 (USD MILLION) 110

TABLE 145 AMERICAS AVASCULAR NECROSIS MARKET FOR TREATMENT BY SURGERY, 2023-2032 (USD MILLION) 111

TABLE 146 AMERICAS AVASCULAR NECROSIS MARKET FOR TREATMENT BY SURGERY, 2023-2032 (USD MILLION) 111

TABLE 147 AMERICAS AVASCULAR NECROSIS MARKET FOR END USER, 2023-2032 (USD MILLION) 111

TABLE 148 AMERICAS AVASCULAR NECROSIS MARKET FOR END USER, 2023-2032 (USD MILLION) 112

TABLE 149 NORTH AMERICA AVASCULAR NECROSIS MARKET, BY REGION, 2023-2032 (USD MILLION) 112

TABLE 150 NORTH AMERICA AVASCULAR NECROSIS MARKET, BY REGION, 2023-2032 (USD MILLION) 112

TABLE 151 NORTH AMERICA AVASCULAR NECROSIS MARKET, BY VOLUME/PROCEDURES, 2023-2032 113

TABLE 152 NORTH AMERICA AVASCULAR NECROSIS MARKET, BY VOLUME/PROCEDURES, 2023-2032 114

TABLE 153 NORTH AMERICA AVASCULAR NECROSIS MARKET, BY TYPE, 2023-2032 (USD MILLION) 114

TABLE 154 NORTH AMERICA AVASCULAR NECROSIS MARKET, BY TYPE, 2023-2032 (USD MILLION) 114

TABLE 155 NORTH AMERICA NON-TRAUMA RELATED AVN MARKET, BY AGE GROUP, 2023-2032 (USD MILLION) 115

TABLE 156 NORTH AMERICA NON-TRAUMA RELATED AVN MARKET, BY AGE GROUP, 2023-2032 (USD MILLION) 115

TABLE 157 NORTH AMERICA NON-TRAUMA RELATED AVN MARKET, BY CAUSES, 2023-2032 (USD MILLION) 115

TABLE 158 NORTH AMERICA NON-TRAUMA RELATED AVN MARKET, BY CAUSES, 2023-2032 (USD MILLION) 116

TABLE 159 NORTH AMERICA AVASCULAR NECROSIS MARKET, BY SITE, 2023-2032 (USD MILLION) 116

TABLE 160 NORTH AMERICA AVASCULAR NECROSIS MARKET, BY SITE, 2023-2032 (USD MILLION) 116

TABLE 161 NORTH AMERICA AVASCULAR NECROSIS MARKET, BY DIAGNOSIS, 2023-2032 (USD MILLION) 117

TABLE 162 NORTH AMERICA AVASCULAR NECROSIS MARKET, BY DIAGNOSIS, 2023-2032 (USD MILLION) 117

TABLE 163 NORTH AMERICA AVASCULAR NECROSIS MARKET FOR DIAGNOSIS, BY IMAGING, 2023-2032 (USD MILLION) 117

TABLE 164 NORTH AMERICA AVASCULAR NECROSIS MARKET FOR DIAGNOSIS, BY IMAGING, 2023-2032 (USD MILLION) 118

TABLE 165 NORTH AMERICA AVASCULAR NECROSIS MARKET, BY TREATMENT, 2023-2032 (USD MILLION) 118

TABLE 166 NORTH AMERICA AVASCULAR NECROSIS MARKET, BY TREATMENT, 2023-2032 (USD MILLION) 118

TABLE 167 NORTH AMERICA AVASCULAR NECROSIS MARKET FOR TREATMENT, BY MEDICATION, 2023-2032 (USD MILLION) 119

TABLE 168 NORTH AMERICA AVASCULAR NECROSIS MARKET FOR TREATMENT, BY MEDICATION, 2023-20

Purchase Option
Single User $ 4,950
Multiuser License $ 5,950
Enterprise User $ 7,250
Compare Licenses
Tailored for You
  • Dedicated Research on any specifics segment or region.
  • Focused Research on specific players in the market.
  • Custom Report based only on your requirements.
  • Flexibility to add or subtract any chapter in the study.
  • Historic data from 2014 and forecasts outlook till 2040.
  • Flexibility of providing data/insights in formats (PDF, PPT, Excel).
  • Provide cross segmentation in applicable scenario/markets.
report-img