Autonomous Mobile Robot Market Summary
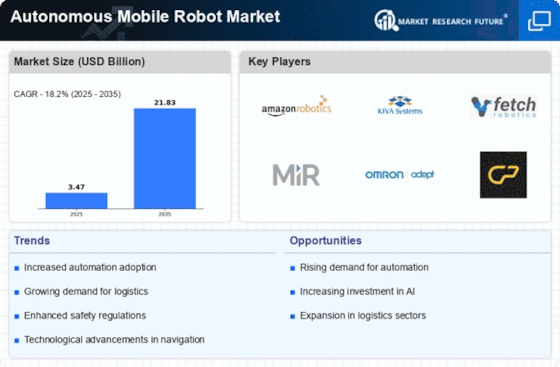
As per Market Research Future Analysis, the Global Autonomous Mobile Robot Market was valued at USD 3.47 Billion in 2024 and is projected to grow to USD 18.46 Billion by 2034, with a CAGR of 18.2% from 2025 to 2034. The market is driven by the increasing demand for automation to enhance operational efficiency, productivity, and workplace safety. Key sectors adopting AMRs include logistics, e-commerce, and manufacturing, with hardware being the dominant segment due to its essential components for robot functionality. Laser/LiDAR technology leads in market share, enabling precise navigation and obstacle avoidance. North America holds the largest market share, driven by strong logistics and e-commerce sectors.
Key Market Trends & Highlights
The Autonomous Mobile Robot market is experiencing significant growth driven by automation needs across various industries.
- Market Size in 2024: USD 3.47 Billion
- Projected Market Size by 2034: USD 18.46 Billion
- CAGR from 2025 to 2034: 18.2%
- Logistics sector dominates market adoption due to high demand for automation solutions.
Market Size & Forecast
2024 Market Size: USD 3.47 Billion
2035 Market Size: USD 21.82 Billion
CAGR (2025-2034): 18.2%
Largest Regional Market Share in 2024: North America
Major Players
Key players include Locus Robotics, Geek+ Technology Co., Ltd., GreyOrange, 6 River Systems, AutoStore, Clearpath Robotics Inc., OMRON Corporation, Conveyor Technologies, IAM Robotics, and Teradyne Inc.
Key Autonomous Mobile Robot Market Trends Highlighted
The Autonomous Mobile Robot Market is seeing big changes since more and more industries, such as logistics, healthcare, and manufacturing, want to automate their processes. Key factors driving the market include the desire to improve operational efficiency, cut labor costs, and deal with worker shortages. As more and more businesses see the benefits of employing automation, the use of autonomous mobile robots (AMRs) is growing quickly, especially in supply chain and warehouse settings. Recent improvements in technologies like computer vision, machine learning, and artificial intelligence are making robotic solutions smarter and more efficient. This lets robots do complicated jobs in changing situations.
One area to look into in the worldwide market is the growing interest in collaborative robots that can work with people to boost productivity and safety. There is also a rising trend toward customizing AMRs to match the demands of various sectors. This gives manufacturers the ability to create unique solutions that can serve specialized markets. Also, as more and more firms go to e-commerce, the need for robots that can handle many items quickly is growing. Sustainability has become quite important, and companies are searching for methods to lessen their impact on the environment.
AMRs help reach this aim by making better use of energy and cutting down on waste in supply chains. As businesses throughout the globe concentrate on eco-friendly activities, the conditions are right for AMRs to expand. This makes it even more important to produce new ideas that solve environmental issues. These developments are making the Autonomous Mobile Robot Market seem good for the future.

Source: Primary Research, Secondary Research, MRFR Database and Analyst Review
Autonomous Mobile Robot Market Drivers
Increasing Demand for Automation in Industries
The Autonomous Mobile Robot Market Industry is experiencing significant growth driven by the rising demand for automation across various sectors such as manufacturing, logistics, and healthcare. As industries aim for operational efficiency and reduced labor costs, they increasingly adopt autonomous mobile robots for material handling, transportation, and warehouse operations. According to a report by the International Federation of Robotics, the global sales of industrial robots reached about 384,000 units in 2020, reflecting a growth of 12% compared to the previous year.
Such widespread adoption illustrates the urgency for automation in industries, leading to enhanced productivity and safety. Companies like Amazon and Siemens have significantly invested in autonomous mobile robots to optimize their logistics and manufacturing processes, marking a trend toward advanced automation solutions. This shift is anticipated to propel the Autonomous Mobile Robot Market to unprecedented heights, as companies embrace robotics to streamline operations and improve efficiency.
Technological Advancements in Robotics
Technological advancements are a key driver for the Autonomous Mobile Robot Market Industry. Innovations in Artificial Intelligence (AI), machine learning, and sensor technologies have vastly improved the capabilities of autonomous mobile robots, enabling them to perform complex tasks with increased precision and reliability. For instance, according to the World Economic Forum, investments in AI technologies are projected to grow by over 70% in the coming years, enhancing automation mechanisms significantly.
Companies such as Boston Dynamics and Fetch Robotics are at the forefront of developing advanced robotic systems that integrate these cutting-edge technologies, resulting in more adaptable, efficient, and safer robots. With such developments, the market is set for accelerated expansion as industries seek to incorporate more sophisticated robotic solutions into their operations.
Growth of E-commerce and Logistics Sector
The growth of the e-commerce and logistics sector is driving the Autonomous Mobile Robot Market Industry rapidly. The shift toward online shopping has led to a dramatic increase in demand for efficient warehousing and delivery solutions. According to a report from the United Nations Conference on Trade and Development, e-commerce sales worldwide reached 26.7 USD Trillion in 2019, representing a growth rate of 4% year-over-year. This surge has prompted companies in the logistics field to adopt autonomous mobile robots for order fulfillment and sorting tasks, enhancing speed and efficiency in operations.
Major players like FedEx and DHL are investing heavily in autonomous mobile robotics to streamline their supply chains to meet rising customer expectations. This trend will considerably propel the growth of the Autonomous Mobile Robot Market, as more organizations look to harness robotic solutions amidst the burgeoning e-commerce landscape.
Autonomous Mobile Robot Market Segment Insights
Autonomous Mobile Robot Market Offering Insights
The Autonomous Mobile Robot Market, focusing on the Offering segment, showcases significant growth and diversity across its key components, namely Hardware, Software, and Services. By 2024, the market is expected to achieve a valuation of approximately 3.47 USD Billion, reflecting the increasing integration of automated solutions in various industries. Within this segment, Hardware is projected to hold a notable valuation of 1.45 USD Billion in 2024, expanding to 8.6 USD Billion by 2035, indicating its substantial role in establishing the physical foundation for robotic operations.
As the backbone of the market, Hardware encompasses critical components such as sensors, actuators, and mobility systems, which are essential for ensuring the efficiency and functionality of autonomous systems. Meanwhile, Software and Services are predicted to account for a more significant proportion, with valuations of 2.02 USD Billion in 2024 and an impressive growth to 13.22 USD Billion by 2035. This robust growth signifies the increasing acknowledgment of sophisticated software algorithms and service frameworks that enable these robots to operate seamlessly in dynamic environments.
The dominance of Software and Services can be attributed to the ongoing advancements in artificial intelligence and machine learning, which facilitate enhanced operational capabilities and smarter decision-making within automated processes. The Autonomous Mobile Robot Market data reveals that the burgeoning demand for automation across sectors such as logistics, manufacturing, and healthcare is acting as a crucial growth driver. However, challenges such as high initial investment costs and the need for skilled personnel to manage these systems may hinder the acceleration of market growth.
Collectively, these segments contribute to a more resilient and adaptive market, fortifying the Autonomous Mobile Robot Market Statistics and establishing a foundation for future innovations and opportunities.

Source: Primary Research, Secondary Research, MRFR Database and Analyst Review
Autonomous Mobile Robot Market Technology Insights
The Autonomous Mobile Robot Market is witnessing significant growth, particularly in the Technology segment, which encompasses various advanced systems enhancing operational efficiency. By 2024, the market is expected to be valued at 3.47 USD Billion, highlighting the robust demand for automated solutions.
Among the driving forces, Laser/LiDAR technology is crucial, as it provides precise navigation and obstacle detection, thereby enhancing safety and efficiency in logistics and manufacturing sectors. Vision Guidance systems also play a vital role, enabling robots to interpret their surroundings effectively, facilitating flexible and intelligent operations.
Other technologies contribute to the overall functionality, emphasizing the need for adaptability in diverse operational environments. The Autonomous Mobile Robot Market segmentation reflects a varied approach to automation, aligning with industry trends that favor improved efficiency and reduced labor costs.
These technologies represent a significant portion of the market, addressing increasing demand for autonomous systems across various industries, including warehousing, healthcare, and retail. As organizations strive for innovation, the integral role of such Technologies cannot be understated in promoting operational excellence in an evolving global landscape.
Autonomous Mobile Robot Industry Insights
The Autonomous Mobile Robot Market is experiencing robust growth, with a projected valuation of 3.47 USD Billion in 2024, expanding significantly to 21.82 USD Billion by 2035. The anticipated compound annual growth rate for this market segment is 18.2 from 2025 to 2035.
Various industries are increasingly adopting autonomous mobile robots to enhance efficiency and reduce operational costs. Within the Industrial sphere, sectors such as E-Commerce and Logistics are particularly crucial, given their reliance on automation for streamlining supply chains and improving delivery processes.
Manufacturing also plays a significant role, where automation can optimize production lines and minimize human error. Healthcare utilizes robots to transport supplies and assist in patient care, while the Retail sector finds value in automating inventory management and customer service.
The Food and Beverage industry benefits from improved accuracy and speed in processes. Overall, the Autonomous Mobile Robot Market segmentation reflects a diverse landscape where technology and automation are driving transformative changes across various industrial applications, presenting numerous growth opportunities and shaping future operational strategies.
Autonomous Mobile Robot Market Regional Insights
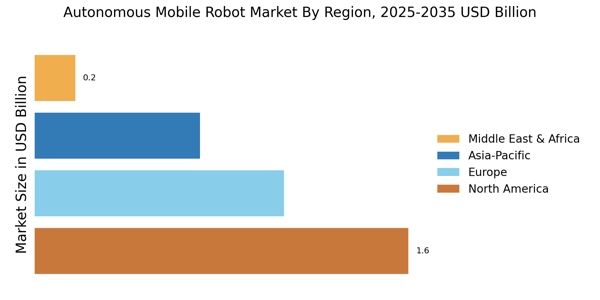
The Autonomous Mobile Robot Market is poised for substantial growth, with North America leading the charge, valued at 1.056 USD Billion in 2024 and expected to reach 6.976 USD Billion by 2035. This region's majority holding stems from its advanced technological infrastructure and high demand for automation across various sectors.
Europe follows closely, currently valued at 0.932 USD Billion, with projections of 6.129 USD Billion in 2035, driven by increasing investment in Research and Development initiatives focused on robotics. The Asia Pacific region, valued at 0.683 USD Billion in 2024, is also expected to see significant growth to 4.045 USD Billion, as countries like China and Japan ramp up their manufacturing capabilities and adopt mobile robotics solutions.
South America, although valued at 0.163 USD Billion, shows potential to reach 0.879 USD Billion by 2035, indicating emerging markets are beginning to explore automation. Lastly, the Middle East and Africa, with a valuation of 0.637 USD Billion in 2024, is projected to grow to 3.801 USD Billion, as industries in these regions begin to embrace automation and explore innovative solutions to meet their operational needs. The diverse opportunities across these regions highlight the significance of the Autonomous Mobile Robot Market, as businesses adapt to transformation with enhanced efficiency and productivity.

Source: Primary Research, Secondary Research, MRFR Database and Analyst Review
Autonomous Mobile Robot Market Key Players and Competitive Insights
The Autonomous Mobile Robot Market has emerged as a critical segment within the broader robotics industry, characterized by rapid advancements in technology, increasing automation demand across various sectors, and a growing emphasis on efficiency and precision in operations. Competitive insights in this market reveal a dynamic landscape where companies are deploying innovative solutions tailored to the specific needs of industries such as warehousing, logistics, and manufacturing.
As organizations strive to improve productivity while minimizing operational costs, the adoption of autonomous mobile robots represents a strategic approach. Factors such as technological advancements, regulatory frameworks, and market trends will continue to shape the competitive dynamics of this market, influencing how players develop, position, and differentiate their offerings.
Cobalt Robotics has established a notable presence in the Autonomous Mobile Robot Market, driven by its innovative approach to security and facility management solutions. The company’s strengths lie in its ability to integrate advanced technologies such as artificial intelligence with robust hardware to deliver autonomous security robots capable of performing surveillance tasks autonomously.
Cobalt Robotics is recognized for its commitment to enhancing safety while maintaining operational efficiency, making its solutions particularly appealing to sectors like corporate offices, educational institutions, and healthcare facilities. By focusing on user-friendly interfaces and customizable options, Cobalt Robotics has built a reputation for providing reliable and effective robotic solutions tailored to meet the unique demands of various environments, thus solidifying its competitive position.
Mobile Industrial Robots has made significant strides in the Autonomous Mobile Robot Market by offering a range of versatile autonomous solutions designed for material handling and logistical operations. Key products include autonomous transport robots that are employed in manufacturing and distribution facilities to streamline workflows and enhance efficiency. The company enjoys a strong market presence, characterized by strategic partnerships and collaborations that expand its reach in various segments globally.
Mobile Industrial Robots has capitalized on its strengths in robust design, ease of integration, and a proven track record in diverse applications, which facilitates its penetration into new markets. Moreover, the company has been active in pursuing mergers and acquisitions to enhance its technological capabilities and expand its product portfolio, further positioning itself as a leader in the autonomous mobile robot space across the global landscape.
Key Companies in the Autonomous Mobile Robot Market Include
- Cobalt Robotics
- Mobile Industrial Robots
- Slamdunk Robotics
- Autonomous Solutions
- Omron
- Energid Technologies
- Locus Robotics
- Fetch Robotics
- Clearpath Robotics
- Yaskawa Electric
- Fanuc
- Nuro
- Amazon Robotics
Autonomous Mobile Robot Market Developments
-
Q2 2024: Locus Robotics raises $117M in Series F funding to expand autonomous mobile robot fleet Locus Robotics, a leading provider of autonomous mobile robots for warehouses, secured $117 million in Series F funding to accelerate product development and global expansion of its AMR solutions.
-
Q2 2024: OTTO Motors by Rockwell Automation Launches OTTO 600 Autonomous Mobile Robot OTTO Motors, a division of Rockwell Automation, announced the launch of the OTTO 600, a new autonomous mobile robot designed for material handling in manufacturing and warehouse environments.
-
Q2 2024: Geekplus and Körber Announce Strategic Partnership to Deliver Advanced AMR Solutions in North America Geekplus, a global AMR provider, and Körber, a supply chain software and automation company, entered a strategic partnership to jointly deliver advanced autonomous mobile robot solutions to North American customers.
-
Q2 2024: ABB acquires Sevensense to boost AI-powered mobile robot capabilities ABB announced the acquisition of Sevensense, a Swiss startup specializing in AI-based navigation for autonomous mobile robots, to enhance ABB’s AMR offerings with advanced visual navigation technology.
-
Q3 2024: Fetch Robotics Appoints New CEO to Drive Next Phase of Growth Fetch Robotics, a developer of autonomous mobile robots, appointed a new CEO to lead the company’s strategic growth and product innovation initiatives.
-
Q3 2024: MiR (Mobile Industrial Robots) Opens New Manufacturing Facility in Denmark Mobile Industrial Robots (MiR) inaugurated a new manufacturing facility in Odense, Denmark, to increase production capacity for its autonomous mobile robots.
-
Q3 2024: Seegrid Secures $30 Million in Growth Financing to Accelerate AMR Development Seegrid, a provider of autonomous mobile robots for material handling, raised $30 million in growth financing to support product development and market expansion.
-
Q4 2024: Vecna Robotics and Big Joe Forklifts Announce Partnership to Integrate AMR Technology Vecna Robotics and Big Joe Forklifts formed a partnership to integrate Vecna’s autonomous mobile robot technology into Big Joe’s material handling equipment.
-
Q4 2024: Amazon deploys new Proteus autonomous mobile robots in fulfillment centers Amazon began deploying its new Proteus autonomous mobile robots across multiple fulfillment centers to automate material movement and improve operational efficiency.
-
Q1 2025: Boston Dynamics launches Stretch AMR for warehouse automation Boston Dynamics launched Stretch, an autonomous mobile robot designed for unloading trucks and moving packages in warehouses, marking its entry into the AMR market.
-
Q1 2025: Agilox Expands to North America with New Headquarters and Demo Center Agilox, an autonomous mobile robot manufacturer, opened its North American headquarters and demonstration center to support regional growth and customer engagement.
-
Q2 2025: GreyOrange and H-E-B Announce Contract for Autonomous Mobile Robot Deployment GreyOrange secured a contract with H-E-B, a major US grocery retailer, to deploy autonomous mobile robots in H-E-B’s distribution centers to enhance supply chain automation.
Autonomous Mobile Robot Market Segmentation Insights
-
Autonomous Mobile Robot Market Offering Outlook
- Hardware
- Software & Services
-
Autonomous Mobile Robot Market Technology Outlook
- Laser/LiDAR
- Vision Guidance
- Others
-
Autonomous Mobile Robot Market Industry Outlook
- E-Commerce
- Manufacturing
- Retail
- Food & Beverage
- Healthcare
- Logistics
- Others
-
Autonomous Mobile Robot Market Regional Outlook
- North America
- Europe
- South America
- Asia Pacific
- Middle East and Africa
Report Attribute/Metric
|
Details
|
Market Size 2023
|
2.94(USD Billion)
|
Market Size 2024
|
3.47(USD Billion)
|
Market Size 2035
|
21.82(USD Billion)
|
Compound Annual Growth Rate (CAGR)
|
18.2% (2025 - 2035)
|
Report Coverage
|
Revenue Forecast, Competitive Landscape, Growth Factors, and Trends
|
Base Year
|
2024
|
Market Forecast Period
|
2025 - 2035
|
Historical Data
|
2019 - 2024
|
Market Forecast Units
|
USD Billion
|
Key Companies Profiled
|
Cobalt Robotics, Mobile Industrial Robots, Slamdunk Robotics, Autonomous Solutions, Omron, Energid Technologies, Locus Robotics, Fetch Robotics, Clearpath Robotics, Yaskawa Electric, Fanuc, Nuro, Amazon Robotics
|
Segments Covered
|
Offering, Technology, Industry, Regional
|
Key Market Opportunities
|
Increased adoption in logistics, Expanding healthcare automation demand, Growth in manufacturing efficiency, Advancements in AI and machine learning, Rising e-commerce fulfillment needs
|
Key Market Dynamics
|
Increasing demand for automation, Rising labor costs, Advancements in AI technology, Growth in e-commerce logistics, Enhanced safety and efficiency
|
Countries Covered
|
North America, Europe, APAC, South America, MEA
|
Autonomous Mobile Robot Market Highlights:
Frequently Asked Questions (FAQ):
The Autonomous Mobile Robot Market is expected to be valued at 3.47 USD Billion in 2024.
The market is projected to reach a valuation of 21.82 USD Billion by 2035.
The market is expected to grow at a CAGR of 18.2% from 2025 to 2035.
North America holds the largest market share, valued at 1.056 USD Billion in 2024.
The Asia Pacific market is expected to reach a value of 4.045 USD Billion by 2035.
Key players include Cobalt Robotics, Mobile Industrial Robots, Slamdunk Robotics, and many others.
The market size for hardware is expected to grow to 8.6 USD Billion by 2035.
In 2024, the European market is valued at 0.932 USD Billion.
The market faces challenges related to technological integration and competition among key players.
Emerging opportunities include advancements in artificial intelligence and robotics enhancing operational efficiency.
TABLE OF CONTENTS
1. EXECUTIVE SUMMARY
1.1. Market Overview
1.2. Key Findings
1.3. Market Segmentation
1.4. Competitive Landscape
1.5. Challenges and Opportunities
1.6. Future Outlook
2. MARKET INTRODUCTION
2.1. Definition
2.2. Scope of the study
2.2.1. Research Objective
2.2.2. Assumption
2.2.3. Limitations
3. RESEARCH METHODOLOGY
3.1. Overview
3.2. Data Mining
3.3. Secondary Research
3.4. Primary Research
3.4.1. Primary Interviews and Information Gathering Process
3.4.2. Breakdown of Primary Respondents
3.5. Forecasting Model
3.6. Market Size Estimation
3.6.1. Bottom-Up Approach
3.6.2. Top-Down Approach
3.7. Data Triangulation
3.8. Validation
4. MARKET DYNAMICS
4.1. Overview
4.2. Drivers
4.3. Restraints
4.4. Opportunities
5. MARKET FACTOR ANALYSIS
5.1. Value chain Analysis
5.2. Porter's Five Forces Analysis
5.2.1. Bargaining Power of Suppliers
5.2.2. Bargaining Power of Buyers
5.2.3. Threat of New Entrants
5.2.4. Threat of Substitutes
5.2.5. Intensity of Rivalry
5.3. COVID-19 Impact Analysis
5.3.1. Market Impact Analysis
5.3.2. Regional Impact
5.3.3. Opportunity and Threat Analysis
6. AUTONOMOUS MOBILE ROBOT MARKET, BY OFFERING (USD BILLION)
6.1. Hardware
6.2. Software & Services
7. AUTONOMOUS MOBILE ROBOT MARKET, BY TECHNOLOGY (USD BILLION)
7.1. Laser/LiDAR
7.2. Vision Guidance
7.3. Others
8. AUTONOMOUS MOBILE ROBOT MARKET, BY INDUSTRY (USD BILLION)
8.1. E-Commerce
8.2. Manufacturing
8.3. Retail
8.4. Food & Beverage
8.5. Healthcare
8.6. Logistics
8.7. Others
9. AUTONOMOUS MOBILE ROBOT MARKET, BY REGIONAL (USD BILLION)
9.1. North America
9.1.1. US
9.1.2. Canada
9.2. Europe
9.2.1. Germany
9.2.2. UK
9.2.3. France
9.2.4. Russia
9.2.5. Italy
9.2.6. Spain
9.2.7. Rest of Europe
9.3. APAC
9.3.1. China
9.3.2. India
9.3.3. Japan
9.3.4. South Korea
9.3.5. Malaysia
9.3.6. Thailand
9.3.7. Indonesia
9.3.8. Rest of APAC
9.4. South America
9.4.1. Brazil
9.4.2. Mexico
9.4.3. Argentina
9.4.4. Rest of South America
9.5. MEA
9.5.1. GCC Countries
9.5.2. South Africa
9.5.3. Rest of MEA
10. COMPETITIVE LANDSCAPE
10.1. Overview
10.2. Competitive Analysis
10.3. Market share Analysis
10.4. Major Growth Strategy in the Autonomous Mobile Robot Market
10.5. Competitive Benchmarking
10.6. Leading Players in Terms of Number of Developments in the Autonomous Mobile Robot Market
10.7. Key developments and growth strategies
10.7.1. New Product Launch/Service Deployment
10.7.2. Merger & Acquisitions
10.7.3. Joint Ventures
10.8. Major Players Financial Matrix
10.8.1. Sales and Operating Income
10.8.2. Major Players R&D Expenditure. 2023
11. COMPANY PROFILES
11.1. Cobalt Robotics
11.1.1. Financial Overview
11.1.2. Products Offered
11.1.3. Key Developments
11.1.4. SWOT Analysis
11.1.5. Key Strategies
11.2. Mobile Industrial Robots
11.2.1. Financial Overview
11.2.2. Products Offered
11.2.3. Key Developments
11.2.4. SWOT Analysis
11.2.5. Key Strategies
11.3. Slamdunk Robotics
11.3.1. Financial Overview
11.3.2. Products Offered
11.3.3. Key Developments
11.3.4. SWOT Analysis
11.3.5. Key Strategies
11.4. Autonomous Solutions
11.4.1. Financial Overview
11.4.2. Products Offered
11.4.3. Key Developments
11.4.4. SWOT Analysis
11.4.5. Key Strategies
11.5. Omron
11.5.1. Financial Overview
11.5.2. Products Offered
11.5.3. Key Developments
11.5.4. SWOT Analysis
11.5.5. Key Strategies
11.6. Energid Technologies
11.6.1. Financial Overview
11.6.2. Products Offered
11.6.3. Key Developments
11.6.4. SWOT Analysis
11.6.5. Key Strategies
11.7. Locus Robotics
11.7.1. Financial Overview
11.7.2. Products Offered
11.7.3. Key Developments
11.7.4. SWOT Analysis
11.7.5. Key Strategies
11.8. iRobot
11.8.1. Financial Overview
11.8.2. Products Offered
11.8.3. Key Developments
11.8.4. SWOT Analysis
11.8.5. Key Strategies
11.9. Fetch Robotics
11.9.1. Financial Overview
11.9.2. Products Offered
11.9.3. Key Developments
11.9.4. SWOT Analysis
11.9.5. Key Strategies
11.10. Clearpath Robotics
11.10.1. Financial Overview
11.10.2. Products Offered
11.10.3. Key Developments
11.10.4. SWOT Analysis
11.10.5. Key Strategies
11.11. Yaskawa Electric
11.11.1. Financial Overview
11.11.2. Products Offered
11.11.3. Key Developments
11.11.4. SWOT Analysis
11.11.5. Key Strategies
11.12. Kiva Systems
11.12.1. Financial Overview
11.12.2. Products Offered
11.12.3. Key Developments
11.12.4. SWOT Analysis
11.12.5. Key Strategies
11.13. Fanuc
11.13.1. Financial Overview
11.13.2. Products Offered
11.13.3. Key Developments
11.13.4. SWOT Analysis
11.13.5. Key Strategies
11.14. Nuro
11.14.1. Financial Overview
11.14.2. Products Offered
11.14.3. Key Developments
11.14.4. SWOT Analysis
11.14.5. Key Strategies
11.15. Amazon Robotics
11.15.1. Financial Overview
11.15.2. Products Offered
11.15.3. Key Developments
11.15.4. SWOT Analysis
11.15.5. Key Strategies
12. APPENDIX
12.1. References
12.2. Related Reports
LIST OF TABLES
TABLE 1. LIST OF ASSUMPTIONS
TABLE 2. NORTH AMERICA MARKET SIZE ESTIMATES & FORECAST, BY OFFERING, 2019-2035 (USD BILLIONS)
TABLE 3. NORTH AMERICA MARKET SIZE ESTIMATES & FORECAST, BY TECHNOLOGY, 2019-2035 (USD BILLIONS)
TABLE 4. NORTH AMERICA MARKET SIZE ESTIMATES & FORECAST, BY INDUSTRY, 2019-2035 (USD BILLIONS)
TABLE 5. NORTH AMERICA MARKET SIZE ESTIMATES & FORECAST, BY REGIONAL, 2019-2035 (USD BILLIONS)
TABLE 6. US MARKET SIZE ESTIMATES & FORECAST, BY OFFERING, 2019-2035 (USD BILLIONS)
TABLE 7. US MARKET SIZE ESTIMATES & FORECAST, BY TECHNOLOGY, 2019-2035 (USD BILLIONS)
TABLE 8. US MARKET SIZE ESTIMATES & FORECAST, BY INDUSTRY, 2019-2035 (USD BILLIONS)
TABLE 9. US MARKET SIZE ESTIMATES & FORECAST, BY REGIONAL, 2019-2035 (USD BILLIONS)
TABLE 10. CANADA MARKET SIZE ESTIMATES & FORECAST, BY OFFERING, 2019-2035 (USD BILLIONS)
TABLE 11. CANADA MARKET SIZE ESTIMATES & FORECAST, BY TECHNOLOGY, 2019-2035 (USD BILLIONS)
TABLE 12. CANADA MARKET SIZE ESTIMATES & FORECAST, BY INDUSTRY, 2019-2035 (USD BILLIONS)
TABLE 13. CANADA MARKET SIZE ESTIMATES & FORECAST, BY REGIONAL, 2019-2035 (USD BILLIONS)
TABLE 14. EUROPE MARKET SIZE ESTIMATES & FORECAST, BY OFFERING, 2019-2035 (USD BILLIONS)
TABLE 15. EUROPE MARKET SIZE ESTIMATES & FORECAST, BY TECHNOLOGY, 2019-2035 (USD BILLIONS)
TABLE 16. EUROPE MARKET SIZE ESTIMATES & FORECAST, BY INDUSTRY, 2019-2035 (USD BILLIONS)
TABLE 17. EUROPE MARKET SIZE ESTIMATES & FORECAST, BY REGIONAL, 2019-2035 (USD BILLIONS)
TABLE 18. GERMANY MARKET SIZE ESTIMATES & FORECAST, BY OFFERING, 2019-2035 (USD BILLIONS)
TABLE 19. GERMANY MARKET SIZE ESTIMATES & FORECAST, BY TECHNOLOGY, 2019-2035 (USD BILLIONS)
TABLE 20. GERMANY MARKET SIZE ESTIMATES & FORECAST, BY INDUSTRY, 2019-2035 (USD BILLIONS)
TABLE 21. GERMANY MARKET SIZE ESTIMATES & FORECAST, BY REGIONAL, 2019-2035 (USD BILLIONS)
TABLE 22. UK MARKET SIZE ESTIMATES & FORECAST, BY OFFERING, 2019-2035 (USD BILLIONS)
TABLE 23. UK MARKET SIZE ESTIMATES & FORECAST, BY TECHNOLOGY, 2019-2035 (USD BILLIONS)
TABLE 24. UK MARKET SIZE ESTIMATES & FORECAST, BY INDUSTRY, 2019-2035 (USD BILLIONS)
TABLE 25. UK MARKET SIZE ESTIMATES & FORECAST, BY REGIONAL, 2019-2035 (USD BILLIONS)
TABLE 26. FRANCE MARKET SIZE ESTIMATES & FORECAST, BY OFFERING, 2019-2035 (USD BILLIONS)
TABLE 27. FRANCE MARKET SIZE ESTIMATES & FORECAST, BY TECHNOLOGY, 2019-2035 (USD BILLIONS)
TABLE 28. FRANCE MARKET SIZE ESTIMATES & FORECAST, BY INDUSTRY, 2019-2035 (USD BILLIONS)
TABLE 29. FRANCE MARKET SIZE ESTIMATES & FORECAST, BY REGIONAL, 2019-2035 (USD BILLIONS)
TABLE 30. RUSSIA MARKET SIZE ESTIMATES & FORECAST, BY OFFERING, 2019-2035 (USD BILLIONS)
TABLE 31. RUSSIA MARKET SIZE ESTIMATES & FORECAST, BY TECHNOLOGY, 2019-2035 (USD BILLIONS)
TABLE 32. RUSSIA MARKET SIZE ESTIMATES & FORECAST, BY INDUSTRY, 2019-2035 (USD BILLIONS)
TABLE 33. RUSSIA MARKET SIZE ESTIMATES & FORECAST, BY REGIONAL, 2019-2035 (USD BILLIONS)
TABLE 34. ITALY MARKET SIZE ESTIMATES & FORECAST, BY OFFERING, 2019-2035 (USD BILLIONS)
TABLE 35. ITALY MARKET SIZE ESTIMATES & FORECAST, BY TECHNOLOGY, 2019-2035 (USD BILLIONS)
TABLE 36. ITALY MARKET SIZE ESTIMATES & FORECAST, BY INDUSTRY, 2019-2035 (USD BILLIONS)
TABLE 37. ITALY MARKET SIZE ESTIMATES & FORECAST, BY REGIONAL, 2019-2035 (USD BILLIONS)
TABLE 38. SPAIN MARKET SIZE ESTIMATES & FORECAST, BY OFFERING, 2019-2035 (USD BILLIONS)
TABLE 39. SPAIN MARKET SIZE ESTIMATES & FORECAST, BY TECHNOLOGY, 2019-2035 (USD BILLIONS)
TABLE 40. SPAIN MARKET SIZE ESTIMATES & FORECAST, BY INDUSTRY, 2019-2035 (USD BILLIONS)
TABLE 41. SPAIN MARKET SIZE ESTIMATES & FORECAST, BY REGIONAL, 2019-2035 (USD BILLIONS)
TABLE 42. REST OF EUROPE MARKET SIZE ESTIMATES & FORECAST, BY OFFERING, 2019-2035 (USD BILLIONS)
TABLE 43. REST OF EUROPE MARKET SIZE ESTIMATES & FORECAST, BY TECHNOLOGY, 2019-2035 (USD BILLIONS)
TABLE 44. REST OF EUROPE MARKET SIZE ESTIMATES & FORECAST, BY INDUSTRY, 2019-2035 (USD BILLIONS)
TABLE 45. REST OF EUROPE MARKET SIZE ESTIMATES & FORECAST, BY REGIONAL, 2019-2035 (USD BILLIONS)
TABLE 46. APAC MARKET SIZE ESTIMATES & FORECAST, BY OFFERING, 2019-2035 (USD BILLIONS)
TABLE 47. APAC MARKET SIZE ESTIMATES & FORECAST, BY TECHNOLOGY, 2019-2035 (USD BILLIONS)
TABLE 48. APAC MARKET SIZE ESTIMATES & FORECAST, BY INDUSTRY, 2019-2035 (USD BILLIONS)
TABLE 49. APAC MARKET SIZE ESTIMATES & FORECAST, BY REGIONAL, 2019-2035 (USD BILLIONS)
TABLE 50. CHINA MARKET SIZE ESTIMATES & FORECAST, BY OFFERING, 2019-2035 (USD BILLIONS)
TABLE 51. CHINA MARKET SIZE ESTIMATES & FORECAST, BY TECHNOLOGY, 2019-2035 (USD BILLIONS)
TABLE 52. CHINA MARKET SIZE ESTIMATES & FORECAST, BY INDUSTRY, 2019-2035 (USD BILLIONS)
TABLE 53. CHINA MARKET SIZE ESTIMATES & FORECAST, BY REGIONAL, 2019-2035 (USD BILLIONS)
TABLE 54. INDIA MARKET SIZE ESTIMATES & FORECAST, BY OFFERING, 2019-2035 (USD BILLIONS)
TABLE 55. INDIA MARKET SIZE ESTIMATES & FORECAST, BY TECHNOLOGY, 2019-2035 (USD BILLIONS)
TABLE 56. INDIA MARKET SIZE ESTIMATES & FORECAST, BY INDUSTRY, 2019-2035 (USD BILLIONS)
TABLE 57. INDIA MARKET SIZE ESTIMATES & FORECAST, BY REGIONAL, 2019-2035 (USD BILLIONS)
TABLE 58. JAPAN MARKET SIZE ESTIMATES & FORECAST, BY OFFERING, 2019-2035 (USD BILLIONS)
TABLE 59. JAPAN MARKET SIZE ESTIMATES & FORECAST, BY TECHNOLOGY, 2019-2035 (USD BILLIONS)
TABLE 60. JAPAN MARKET SIZE ESTIMATES & FORECAST, BY INDUSTRY, 2019-2035 (USD BILLIONS)
TABLE 61. JAPAN MARKET SIZE ESTIMATES & FORECAST, BY REGIONAL, 2019-2035 (USD BILLIONS)
TABLE 62. SOUTH KOREA MARKET SIZE ESTIMATES & FORECAST, BY OFFERING, 2019-2035 (USD BILLIONS)
TABLE 63. SOUTH KOREA MARKET SIZE ESTIMATES & FORECAST, BY TECHNOLOGY, 2019-2035 (USD BILLIONS)
TABLE 64. SOUTH KOREA MARKET SIZE ESTIMATES & FORECAST, BY INDUSTRY, 2019-2035 (USD BILLIONS)
TABLE 65. SOUTH KOREA MARKET SIZE ESTIMATES & FORECAST, BY REGIONAL, 2019-2035 (USD BILLIONS)
TABLE 66. MALAYSIA MARKET SIZE ESTIMATES & FORECAST, BY OFFERING, 2019-2035 (USD BILLIONS)
TABLE 67. MALAYSIA MARKET SIZE ESTIMATES & FORECAST, BY TECHNOLOGY, 2019-2035 (USD BILLIONS)
TABLE 68. MALAYSIA MARKET SIZE ESTIMATES & FORECAST, BY INDUSTRY, 2019-2035 (USD BILLIONS)
TABLE 69. MALAYSIA MARKET SIZE ESTIMATES & FORECAST, BY REGIONAL, 2019-2035 (USD BILLIONS)
TABLE 70. THAILAND MARKET SIZE ESTIMATES & FORECAST, BY OFFERING, 2019-2035 (USD BILLIONS)
TABLE 71. THAILAND MARKET SIZE ESTIMATES & FORECAST, BY TECHNOLOGY, 2019-2035 (USD BILLIONS)
TABLE 72. THAILAND MARKET SIZE ESTIMATES & FORECAST, BY INDUSTRY, 2019-2035 (USD BILLIONS)
TABLE 73. THAILAND MARKET SIZE ESTIMATES & FORECAST, BY REGIONAL, 2019-2035 (USD BILLIONS)
TABLE 74. INDONESIA MARKET SIZE ESTIMATES & FORECAST, BY OFFERING, 2019-2035 (USD BILLIONS)
TABLE 75. INDONESIA MARKET SIZE ESTIMATES & FORECAST, BY TECHNOLOGY, 2019-2035 (USD BILLIONS)
TABLE 76. INDONESIA MARKET SIZE ESTIMATES & FORECAST, BY INDUSTRY, 2019-2035 (USD BILLIONS)
TABLE 77. INDONESIA MARKET SIZE ESTIMATES & FORECAST, BY REGIONAL, 2019-2035 (USD BILLIONS)
TABLE 78. REST OF APAC MARKET SIZE ESTIMATES & FORECAST, BY OFFERING, 2019-2035 (USD BILLIONS)
TABLE 79. REST OF APAC MARKET SIZE ESTIMATES & FORECAST, BY TECHNOLOGY, 2019-2035 (USD BILLIONS)
TABLE 80. REST OF APAC MARKET SIZE ESTIMATES & FORECAST, BY INDUSTRY, 2019-2035 (USD BILLIONS)
TABLE 81. REST OF APAC MARKET SIZE ESTIMATES & FORECAST, BY REGIONAL, 2019-2035 (USD BILLIONS)
TABLE 82. SOUTH AMERICA MARKET SIZE ESTIMATES & FORECAST, BY OFFERING, 2019-2035 (USD BILLIONS)
TABLE 83. SOUTH AMERICA MARKET SIZE ESTIMATES & FORECAST, BY TECHNOLOGY, 2019-2035 (USD BILLIONS)
TABLE 84. SOUTH AMERICA MARKET SIZE ESTIMATES & FORECAST, BY INDUSTRY, 2019-2035 (USD BILLIONS)
TABLE 85. SOUTH AMERICA MARKET SIZE ESTIMATES & FORECAST, BY REGIONAL, 2019-2035 (USD BILLIONS)
TABLE 86. BRAZIL MARKET SIZE ESTIMATES & FORECAST, BY OFFERING, 2019-2035 (USD BILLIONS)
TABLE 87. BRAZIL MARKET SIZE ESTIMATES & FORECAST, BY TECHNOLOGY, 2019-2035 (USD BILLIONS)
TABLE 88. BRAZIL MARKET SIZE ESTIMATES & FORECAST, BY INDUSTRY, 2019-2035 (USD BILLIONS)
TABLE 89. BRAZIL MARKET SIZE ESTIMATES & FORECAST, BY REGIONAL, 2019-2035 (USD BILLIONS)
TABLE 90. MEXICO MARKET SIZE ESTIMATES & FORECAST, BY OFFERING, 2019-2035 (USD BILLIONS)
TABLE 91. MEXICO MARKET SIZE ESTIMATES & FORECAST, BY TECHNOLOGY, 2019-2035 (USD BILLIONS)
TABLE 92. MEXICO MARKET SIZE ESTIMATES & FORECAST, BY INDUSTRY, 2019-2035 (USD BILLIONS)
TABLE 93. MEXICO MARKET SIZE ESTIMATES & FORECAST, BY REGIONAL, 2019-2035 (USD BILLIONS)
TABLE 94. ARGENTINA MARKET SIZE ESTIMATES & FORECAST, BY OFFERING, 2019-2035 (USD BILLIONS)
TABLE 95. ARGENTINA MARKET SIZE ESTIMATES & FORECAST, BY TECHNOLOGY, 2019-2035 (USD BILLIONS)
TABLE 96. ARGENTINA MARKET SIZE ESTIMATES & FORECAST, BY INDUSTRY, 2019-2035 (USD BILLIONS)
TABLE 97. ARGENTINA MARKET SIZE ESTIMATES & FORECAST, BY REGIONAL, 2019-2035 (USD BILLIONS)
TABLE 98. REST OF SOUTH AMERICA MARKET SIZE ESTIMATES & FORECAST, BY OFFERING, 2019-2035 (USD BILLIONS)
TABLE 99. REST OF SOUTH AMERICA MARKET SIZE ESTIMATES & FORECAST, BY TECHNOLOGY, 2019-2035 (USD BILLIONS)
TABLE 100. REST OF SOUTH AMERICA MARKET SIZE ESTIMATES & FORECAST, BY INDUSTRY, 2019-2035 (USD BILLIONS)
TABLE 101. REST OF SOUTH AMERICA MARKET SIZE ESTIMATES & FORECAST, BY REGIONAL, 2019-2035 (USD BILLIONS)
TABLE 102. MEA MARKET SIZE ESTIMATES & FORECAST, BY OFFERING, 2019-2035 (USD BILLIONS)
TABLE 103. MEA MARKET SIZE ESTIMATES & FORECAST, BY TECHNOLOGY, 2019-2035 (USD BILLIONS)
TABLE 104. MEA MARKET SIZE ESTIMATES & FORECAST, BY INDUSTRY, 2019-2035 (USD BILLIONS)
TABLE 105. MEA MARKET SIZE ESTIMATES & FORECAST, BY REGIONAL, 2019-2035 (USD BILLIONS)
TABLE 106. GCC COUNTRIES MARKET SIZE ESTIMATES & FORECAST, BY OFFERING, 2019-2035 (USD BILLIONS)
TABLE 107. GCC COUNTRIES MARKET SIZE ESTIMATES & FORECAST, BY TECHNOLOGY, 2019-2035 (USD BILLIONS)
TABLE 108. GCC COUNTRIES MARKET SIZE ESTIMATES & FORECAST, BY INDUSTRY, 2019-2035 (USD BILLIONS)
TABLE 109. GCC COUNTRIES MARKET SIZE ESTIMATES & FORECAST, BY REGIONAL, 2019-2035 (USD BILLIONS)
TABLE 110. SOUTH AFRICA MARKET SIZE ESTIMATES & FORECAST, BY OFFERING, 2019-2035 (USD BILLIONS)
TABLE 111. SOUTH AFRICA MARKET SIZE ESTIMATES & FORECAST, BY TECHNOLOGY, 2019-2035 (USD BILLIONS)
TABLE 112. SOUTH AFRICA MARKET SIZE ESTIMATES & FORECAST, BY INDUSTRY, 2019-2035 (USD BILLIONS)
TABLE 113. SOUTH AFRICA MARKET SIZE ESTIMATES & FORECAST, BY REGIONAL, 2019-2035 (USD BILLIONS)
TABLE 114. REST OF MEA MARKET SIZE ESTIMATES & FORECAST, BY OFFERING, 2019-2035 (USD BILLIONS)
TABLE 115. REST OF MEA MARKET SIZE ESTIMATES & FORECAST, BY TECHNOLOGY, 2019-2035 (USD BILLIONS)
TABLE 116. REST OF MEA MARKET SIZE ESTIMATES & FORECAST, BY INDUSTRY, 2019-2035 (USD BILLIONS)
TABLE 117. REST OF MEA MARKET SIZE ESTIMATES & FORECAST, BY REGIONAL, 2019-2035 (USD BILLIONS)
TABLE 118. PRODUCT LAUNCH/PRODUCT DEVELOPMENT/APPROVAL
TABLE 119. ACQUISITION/PARTNERSHIP
LIST OF FIGURES
FIGURE 1. MARKET SYNOPSIS
FIGURE 2. NORTH AMERICA MARKET ANALYSIS
FIGURE 3. US MARKET ANALYSIS BY OFFERING
FIGURE 4. US MARKET ANALYSIS BY TECHNOLOGY
FIGURE 5. US MARKET ANALYSIS BY INDUSTRY
FIGURE 6. US MARKET ANALYSIS BY REGIONAL
FIGURE 7. CANADA MARKET ANALYSIS BY OFFERING
FIGURE 8. CANADA MARKET ANALYSIS BY TECHNOLOGY
FIGURE 9. CANADA MARKET ANALYSIS BY INDUSTRY
FIGURE 10. CANADA MARKET ANALYSIS BY REGIONAL
FIGURE 11. EUROPE MARKET ANALYSIS
FIGURE 12. GERMANY MARKET ANALYSIS BY OFFERING
FIGURE 13. GERMANY MARKET ANALYSIS BY TECHNOLOGY
FIGURE 14. GERMANY MARKET ANALYSIS BY INDUSTRY
FIGURE 15. GERMANY MARKET ANALYSIS BY REGIONAL
FIGURE 16. UK MARKET ANALYSIS BY OFFERING
FIGURE 17. UK MARKET ANALYSIS BY TECHNOLOGY
FIGURE 18. UK MARKET ANALYSIS BY INDUSTRY
FIGURE 19. UK MARKET ANALYSIS BY REGIONAL
FIGURE 20. FRANCE MARKET ANALYSIS BY OFFERING
FIGURE 21. FRANCE MARKET ANALYSIS BY TECHNOLOGY
FIGURE 22. FRANCE MARKET ANALYSIS BY INDUSTRY
FIGURE 23. FRANCE MARKET ANALYSIS BY REGIONAL
FIGURE 24. RUSSIA MARKET ANALYSIS BY OFFERING
FIGURE 25. RUSSIA MARKET ANALYSIS BY TECHNOLOGY
FIGURE 26. RUSSIA MARKET ANALYSIS BY INDUSTRY
FIGURE 27. RUSSIA MARKET ANALYSIS BY REGIONAL
FIGURE 28. ITALY MARKET ANALYSIS BY OFFERING
FIGURE 29. ITALY MARKET ANALYSIS BY TECHNOLOGY
FIGURE 30. ITALY MARKET ANALYSIS BY INDUSTRY
FIGURE 31. ITALY MARKET ANALYSIS BY REGIONAL
FIGURE 32. SPAIN MARKET ANALYSIS BY OFFERING
FIGURE 33. SPAIN MARKET ANALYSIS BY TECHNOLOGY
FIGURE 34. SPAIN MARKET ANALYSIS BY INDUSTRY
FIGURE 35. SPAIN MARKET ANALYSIS BY REGIONAL
FIGURE 36. REST OF EUROPE MARKET ANALYSIS BY OFFERING
FIGURE 37. REST OF EUROPE MARKET ANALYSIS BY TECHNOLOGY
FIGURE 38. REST OF EUROPE MARKET ANALYSIS BY INDUSTRY
FIGURE 39. REST OF EUROPE MARKET ANALYSIS BY REGIONAL
FIGURE 40. APAC MARKET ANALYSIS
FIGURE 41. CHINA MARKET ANALYSIS BY OFFERING
FIGURE 42. CHINA MARKET ANALYSIS BY TECHNOLOGY
FIGURE 43. CHINA MARKET ANALYSIS BY INDUSTRY
FIGURE 44. CHINA MARKET ANALYSIS BY REGIONAL
FIGURE 45. INDIA MARKET ANALYSIS BY OFFERING
FIGURE 46. INDIA MARKET ANALYSIS BY TECHNOLOGY
FIGURE 47. INDIA MARKET ANALYSIS BY INDUSTRY
FIGURE 48. INDIA MARKET ANALYSIS BY REGIONAL
FIGURE 49. JAPAN MARKET ANALYSIS BY OFFERING
FIGURE 50. JAPAN MARKET ANALYSIS BY TECHNOLOGY
FIGURE 51. JAPAN MARKET ANALYSIS BY INDUSTRY
FIGURE 52. JAPAN MARKET ANALYSIS BY REGIONAL
FIGURE 53. SOUTH KOREA MARKET ANALYSIS BY OFFERING
FIGURE 54. SOUTH KOREA MARKET ANALYSIS BY TECHNOLOGY
FIGURE 55. SOUTH KOREA MARKET ANALYSIS BY INDUSTRY
FIGURE 56. SOUTH KOREA MARKET ANALYSIS BY REGIONAL
FIGURE 57. MALAYSIA MARKET ANALYSIS BY OFFERING
FIGURE 58. MALAYSIA MARKET ANALYSIS BY TECHNOLOGY
FIGURE 59. MALAYSIA MARKET ANALYSIS BY INDUSTRY
FIGURE 60. MALAYSIA MARKET ANALYSIS BY REGIONAL
FIGURE 61. THAILAND MARKET ANALYSIS BY OFFERING
FIGURE 62. THAILAND MARKET ANALYSIS BY TECHNOLOGY
FIGURE 63. THAILAND MARKET ANALYSIS BY INDUSTRY
FIGURE 64. THAILAND MARKET ANALYSIS BY REGIONAL
FIGURE 65. INDONESIA MARKET ANALYSIS BY OFFERING
FIGURE 66. INDONESIA MARKET ANALYSIS BY TECHNOLOGY
FIGURE 67. INDONESIA MARKET ANALYSIS BY INDUSTRY
FIGURE 68. INDONESIA MARKET ANALYSIS BY REGIONAL
FIGURE 69. REST OF APAC MARKET ANALYSIS BY OFFERING
FIGURE 70. REST OF APAC MARKET ANALYSIS BY TECHNOLOGY
FIGURE 71. REST OF APAC MARKET ANALYSIS BY INDUSTRY
FIGURE 72. REST OF APAC MARKET ANALYSIS BY REGIONAL
FIGURE 73. SOUTH AMERICA MARKET ANALYSIS
FIGURE 74. BRAZIL MARKET ANALYSIS BY OFFERING
FIGURE 75. BRAZIL MARKET ANALYSIS BY TECHNOLOGY
FIGURE 76. BRAZIL MARKET ANALYSIS BY INDUSTRY
FIGURE 77. BRAZIL MARKET ANALYSIS BY REGIONAL
FIGURE 78. MEXICO MARKET ANALYSIS BY OFFERING
FIGURE 79. MEXICO MARKET ANALYSIS BY TECHNOLOGY
FIGURE 80. MEXICO MARKET ANALYSIS BY INDUSTRY
FIGURE 81. MEXICO MARKET ANALYSIS BY REGIONAL
FIGURE 82. ARGENTINA MARKET ANALYSIS BY OFFERING
FIGURE 83. ARGENTINA MARKET ANALYSIS BY TECHNOLOGY
FIGURE 84. ARGENTINA MARKET ANALYSIS BY INDUSTRY
FIGURE 85. ARGENTINA MARKET ANALYSIS BY REGIONAL
FIGURE 86. REST OF SOUTH AMERICA MARKET ANALYSIS BY OFFERING
FIGURE 87. REST OF SOUTH AMERICA MARKET ANALYSIS BY TECHNOLOGY
FIGURE 88. REST OF SOUTH AMERICA MARKET ANALYSIS BY INDUSTRY
FIGURE 89. REST OF SOUTH AMERICA MARKET ANALYSIS BY REGIONAL
FIGURE 90. MEA MARKET ANALYSIS
FIGURE 91. GCC COUNTRIES MARKET ANALYSIS BY OFFERING
FIGURE 92. GCC COUNTRIES MARKET ANALYSIS BY TECHNOLOGY
FIGURE 93. GCC COUNTRIES MARKET ANALYSIS BY INDUSTRY
FIGURE 94. GCC COUNTRIES MARKET ANALYSIS BY REGIONAL
FIGURE 95. SOUTH AFRICA MARKET ANALYSIS BY OFFERING
FIGURE 96. SOUTH AFRICA MARKET ANALYSIS BY TECHNOLOGY
FIGURE 97. SOUTH AFRICA MARKET ANALYSIS BY INDUSTRY
FIGURE 98. SOUTH AFRICA MARKET ANALYSIS BY REGIONAL
FIGURE 99. REST OF MEA MARKET ANALYSIS BY OFFERING
FIGURE 100. REST OF MEA MARKET ANALYSIS BY TECHNOLOGY
FIGURE 101. REST OF MEA MARKET ANALYSIS BY INDUSTRY
FIGURE 102. REST OF MEA MARKET ANALYSIS BY REGIONAL
FIGURE 103. KEY BUYING CRITERIA OF AUTONOMOUS MOBILE ROBOT MARKET
FIGURE 104. RESEARCH PROCESS OF MRFR
FIGURE 105. DRO ANALYSIS OF AUTONOMOUS MOBILE ROBOT MARKET
FIGURE 106. DRIVERS IMPACT ANALYSIS: AUTONOMOUS MOBILE ROBOT MARKET
FIGURE 107. RESTRAINTS IMPACT ANALYSIS: AUTONOMOUS MOBILE ROBOT MARKET
FIGURE 108. SUPPLY / VALUE CHAIN: AUTONOMOUS MOBILE ROBOT MARKET
FIGURE 109. AUTONOMOUS MOBILE ROBOT MARKET, BY OFFERING, 2025 (% SHARE)
FIGURE 110. AUTONOMOUS MOBILE ROBOT MARKET, BY OFFERING, 2019 TO 2035 (USD Billions)
FIGURE 111. AUTONOMOUS MOBILE ROBOT MARKET, BY TECHNOLOGY, 2025 (% SHARE)
FIGURE 112. AUTONOMOUS MOBILE ROBOT MARKET, BY TECHNOLOGY, 2019 TO 2035 (USD Billions)
FIGURE 113. AUTONOMOUS MOBILE ROBOT MARKET, BY INDUSTRY, 2025 (% SHARE)
FIGURE 114. AUTONOMOUS MOBILE ROBOT MARKET, BY INDUSTRY, 2019 TO 2035 (USD Billions)
FIGURE 115. AUTONOMOUS MOBILE ROBOT MARKET, BY REGIONAL, 2025 (% SHARE)
FIGURE 116. AUTONOMOUS MOBILE ROBOT MARKET, BY REGIONAL, 2019 TO 2035 (USD Billions)
FIGURE 117. BENCHMARKING OF MAJOR COMPETITORS