Automotive Surround View Systems Market (2026 - 2035)

ID: MRFR/AT/3311-HCR 100 Pages Triveni Bhoyar Last Updated: October 16, 2026
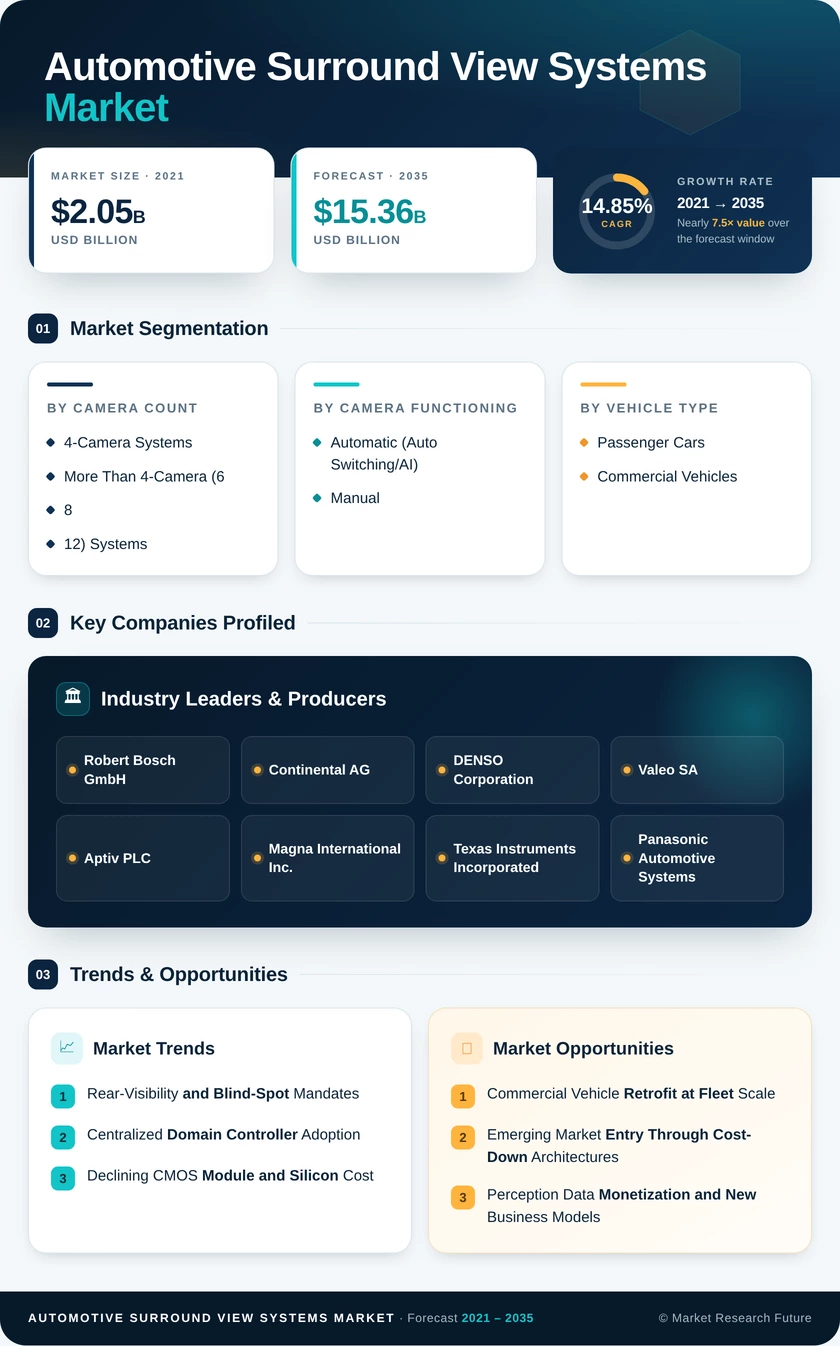
Automotive Surround View Systems Market Research Report By Camera Count (4-Camera Systems, More Than 4-Camera (6, 8, 12) Systems), By Camera Functioning (Automatic (Auto Switching/AI), Manual), By Vehicle Type (Passenger Cars, Commercial Vehicles), By Sales Channel (OEM-Fitted, Aftermarket Retrofit), By Sensor Technology (CMOS, CCD), By Display Type (2-D Displays, 3-D and Augmented Displays) - Forecast to 2035
Automotive Surround View Systems Market
Market Size
Forecast Period2026-2035
CAGR (2026-2035)14.85%
2025 Market SizeUSD 3.94 Billion
2035 Market SizeUSD 15.36 billion
Key Players
Robert Bosch GmbH
Continental AG
DENSO Corporation
Valeo SA
Aptiv PLC
Magna International Inc.
Opportunities
  • Commercial Vehicle Retrofit at Fleet Scale
  • Emerging Market Entry Through Cost-Down Architectures
  • Perception Data Monetization and New Business Models
  1. 1 Market Summary | |
    1. 1.1 Study Assumptions & Market Definition | |
    2. 1.2 Scope of the Study | |
    3. 1.3 Research Methodology | |
  2. 2 Key Report Takeaways | |
    1. 2.1 By Camera Count | |
    2. 2.2 By Camera Functioning | |
    3. 2.3 By Vehicle Type | |
    4. 2.4 By Sales Channel | |
    5. 2.5 By Sensor Technology | |
    6. 2.6 By Display Type | |
    7. 2.7 By Region | |
  3. 3 Market Size and Forecast (2021–2035) | |
    1. 3.1 Historical Market Size (2021–2024) | |
    2. 3.2 Base Year Estimate (2025) | |
    3. 3.3 Forecast Market Size (2026–2035) | |
    4. 3.4 Year-over-Year Growth Analysis | |
  4. 4 Driver Impact Analysis | |
    1. 4.1 Rear-Visibility and Blind-Spot Mandates | |
    2. 4.2 Centralized Domain Controller Adoption | |
    3. 4.3 Declining CMOS Module and Silicon Cost | |
    4. 4.4 Level 2+ ADAS Feature Proliferation | |
    5. 4.5 Commercial Fleet Insurance Incentives | |
    6. 4.6 Software Subscription and OTA Monetization | |
    7. 4.7 Electric Platform Architecture Redesign | |
  5. 5 Restraints Impact Analysis | |
    1. 5.1 System Cost Pressure in Entry Vehicle Segments | |
    2. 5.2 Calibration and Warranty Service Complexity | |
    3. 5.3 Image Quality Degradation in Adverse Conditions | |
    4. 5.4 Data Privacy and Camera Recording Regulation | |
    5. 5.5 Automotive Semiconductor Supply Volatility | |
  6. 6 Opportunities | |
    1. 6.1 Commercial Vehicle Retrofit at Fleet Scale | |
    2. 6.2 Emerging Market Entry Through Cost-Down Architectures | |
    3. 6.3 Perception Data Monetization and New Business Models | |
    4. 6.4 Software-Defined Feature Unlocks on Dormant Hardware | |
    5. 6.5 Integration With Automated Valet and Low-Speed Autonomy | |
  7. 7 Regional Market Share and Country-Level Analysis | |
    1. 7.1 North America | | |
      1. 7.1.1 US | | |
      2. 7.1.2 Canada | | |
      3. 7.1.3 Mexico | |
    2. 7.2 Europe | | |
      1. 7.2.1 Germany | | |
      2. 7.2.2 UK | | |
      3. 7.2.3 France | | |
      4. 7.2.4 Italy | | |
      5. 7.2.5 Spain | | |
      6. 7.2.6 Nordic Countries | | |
      7. 7.2.7 Russia | | |
      8. 7.2.8 Rest of Europe | |
    3. 7.3 Asia-Pacific | | |
      1. 7.3.1 China | | |
      2. 7.3.2 India | | |
      3. 7.3.3 Japan | | |
      4. 7.3.4 South Korea | | |
      5. 7.3.5 ASEAN | | |
      6. 7.3.6 Rest of Asia-Pacific | |
    4. 7.4 South America | | |
      1. 7.4.1 Brazil | | |
      2. 7.4.2 Argentina | | |
      3. 7.4.3 Rest of South America | |
    5. 7.5 Middle East & Africa | | |
      1. 7.5.1 Saudi Arabia | | |
      2. 7.5.2 UAE | | |
      3. 7.5.3 South Africa | | |
      4. 7.5.4 Egypt | | |
      5. 7.5.5 Rest of MEA | |
  8. 8 Future Outlook (2026–2035) | |
    1. 8.1 Vision Compute Consolidation and AI Stitching | |
    2. 8.2 Platform Economics and Recurring Revenue | |
    3. 8.3 Electrification and Architectural Reset | |
    4. 8.4 Regulatory Convergence and Vulnerable Road User Protection | |
  9. 9 Segmentation Analysis | |
    1. 9.1 By Camera Count | | |
      1. 9.1.1 4-Camera Systems | | |
      2. 9.1.1 More Than 4-Camera (6, 8, 12) Systems | |
    2. 9.2 By Camera Functioning | | |
      1. 9.2.1 Automatic (Auto Switching/AI) | | |
      2. 9.2.2 Manual | |
    3. 9.3 By Vehicle Type | | |
      1. 9.3.1 Passenger Cars | | |
      2. 9.3.2 Commercial Vehicles | |
    4. 9.4 By Sales Channel | | |
      1. 9.4.1 OEM-Fitted | | |
      2. 9.4.2 Aftermarket Retrofit | |
    5. 9.5 By Sensor Technology | | |
      1. 9.5.1 CMOS | | |
      2. 9.5.2 CCD | |
    6. 9.6 By Display Type | | |
      1. 9.6.1 2-D Displays | | |
      2. 9.6.2 3-D and Augmented Displays | |
  10. 10 Competitive Landscape | |
    1. 10.1 Market Concentration Analysis | |
    2. 10.2 Competitive Benchmarking Matrix | |
    3. 10.3 Company Profiles | | |
      1. 10.3.1 Robert Bosch GmbH | | |
      2. 10.3.2 Continental AG | | |
      3. 10.3.3 DENSO Corporation | | |
      4. 10.3.4 Valeo SA | | |
      5. 10.3.5 Aptiv PLC | | |
      6. 10.3.6 Magna International Inc. | | |
      7. 10.3.7 Texas Instruments Incorporated | | |
      8. 10.3.8 Panasonic Automotive Systems | | |
      9. 10.3.9 Ambarella Inc. | | |
      10. 10.3.10 NXP Semiconductors N.V. | | |
      11. 10.3.11 Ficosa International SA | | |
      12. 10.3.12 Horizon Robotics | |
  11. 11 Recent News & Developments | |
  12. 12 Report Scope and Methodology | |
    1. 12.1 Study Period & Base Year | |
    2. 12.2 Valuation Currency | |
    3. 12.3 Abbreviations | |
  13. 13 Detailed Sources and Citations | |
  14. 14 Frequently Asked Questions (FAQs) | | LIST OF TABLES | |
  15. TABLE 1 Automotive Surround View Systems Market Size & Forecast, by Revenue (USD Billion), 2021–2035 | |
  16. TABLE 2 Automotive Surround View Systems Market – Year-over-Year Growth Analysis, 2021–2035 | |
  17. TABLE 3 Driver Impact Analysis Matrix, 2026–2035 | |
  18. TABLE 4 Restraint Impact Analysis Matrix, 2026–2035 | |
  19. TABLE 5 Automotive Surround View Systems Market Size, by Region, 2021–2035 (USD Billion) | |
  20. TABLE 6 North America Market Size, by Country, 2021–2035 (USD Billion) | |
  21. TABLE 7 Europe Market Size, by Country, 2021–2035 (USD Billion) | |
  22. TABLE 8 Asia-Pacific Market Size, by Country, 2021–2035 (USD Billion) | |
  23. TABLE 9 South America Market Size, by Country, 2021–2035 (USD Billion) | |
  24. TABLE 10 Middle East & Africa Market Size, by Country, 2021–2035 (USD Billion) | |
  25. TABLE 11 Market Size, by Camera Count, 2021–2035 (USD Billion) | |
  26. TABLE 12 Market Size, by Camera Functioning, 2021–2035 (USD Billion) | |
  27. TABLE 13 Market Size, by Vehicle Type, 2021–2035 (USD Billion) | |
  28. TABLE 14 Market Size, by Sales Channel, 2021–2035 (USD Billion) | |
  29. TABLE 15 Market Size, by Sensor Technology, 2021–2035 (USD Billion) | |
  30. TABLE 16 Market Size, by Display Type, 2021–2035 (USD Billion) | |
  31. TABLE 17 Competitive Benchmarking Matrix, 2026 | |
  32. TABLE 18 Company Profiles – Key Players | |
  33. TABLE 19 Recent Developments & Strategic Announcements, 2023–2025 | |
  34. TABLE 20 Report Scope & Methodology Summary | |
  35. TABLE 21 Detailed Sources and Citations | |
  36. TABLE 22 North America Market Size, by Camera Count, 2021–2035 (USD Billion) | |
  37. TABLE 23 North America Market Size, by Vehicle Type, 2021–2035 (USD Billion) | |
  38. TABLE 24 Europe Market Size, by Camera Count, 2021–2035 (USD Billion) | |
  39. TABLE 25 Europe Market Size, by Vehicle Type, 2021–2035 (USD Billion) | |
  40. TABLE 26 Asia-Pacific Market Size, by Camera Count, 2021–2035 (USD Billion) | |
  41. TABLE 27 Asia-Pacific Market Size, by Display Type, 2021–2035 (USD Billion) | |
  42. TABLE 28 South America Market Size, by Sales Channel, 2021–2035 (USD Billion) | |
  43. TABLE 29 Middle East & Africa Market Size, by Vehicle Type, 2021–2035 (USD Billion) | |
  44. TABLE 30 Segmentation Quick Reference Summary | | LIST OF FIGURES | |
  45. FIGURE 1 Market Dynamics – Drivers, Restraints, and Opportunities | |
  46. FIGURE 2 Industry Value Chain Analysis | |
  47. FIGURE 3 Porter's Five Forces Analysis | |
  48. FIGURE 4 Market Size Trend and Forecast, 2021–2035 (USD Billion) | |
  49. FIGURE 5 Year-over-Year Growth Trajectory, 2022–2035 | |
  50. FIGURE 6 Market Share by Camera Count, 2025 | |
  51. FIGURE 7 Market Share by Camera Functioning, 2025 | |
  52. FIGURE 8 Market Share by Vehicle Type, 2025 | |
  53. FIGURE 9 Market Share by Sales Channel, 2025 | |
  54. FIGURE 10 Market Share by Sensor Technology, 2025 | |
  55. FIGURE 11 Market Share by Display Type, 2025 | |
  56. FIGURE 12 Regional Market Share Distribution, 2025 | |
  57. FIGURE 13 Regional CAGR Comparison, 2026–2035 | |
  58. FIGURE 14 Country-Level Share Within Asia-Pacific, 2025 | |
  59. FIGURE 15 Competitive Landscape – Estimated Revenue Share Positioning, 2026 | |
  60. FIGURE 16 Supplier Strategic Positioning Matrix

Segmentation Quick Reference

DimensionSub-SegmentsDominant SegmentFastest Growing Segment
By Camera Count4-Camera Systems; More Than 4-Camera (6, 8, 12) Systems4-Camera Systems (70.5% share, 2025)More Than 4-Camera (6, 8, 12) Systems (19.62% CAGR)
By Camera FunctioningAutomatic (Auto Switching/AI); ManualAutomatic (Auto Switching/AI) (79.2% share, 2025)Automatic (Auto Switching/AI) (79.2% share, 2025)
By Vehicle TypePassenger Cars; Commercial VehiclesPassenger Cars (83.5% share, 2025)Commercial Vehicles (18.55% CAGR)
By Sales ChannelOEM-Fitted; Aftermarket RetrofitOEM-Fitted (USD 3.42 Billion, 2025)Aftermarket Retrofit (20.05% CAGR)
By Sensor TechnologyCMOS; CCDCMOS (83.9% share, 2025)CMOS (83.9% share, 2025)
By Display Type2-D Displays; 3-D and Augmented Displays2-D Displays (73.8% share, 2025)3-D and Augmented Displays (21.85% CAGR)


Market Segmentation Overview

By Camera Count

Sub-SegmentKey Trend
4-Camera SystemsBaseline configuration meeting regulatory coverage at lowest bill of materials
More Than 4-Camera (6, 8, 12) SystemsRedundant viewpoints feeding learned occlusion-resolution models


4-Camera Systems lead because four viewpoints satisfy reversing and blind-spot coverage requirements without exceeding the compute and harness budget of mainstream platforms. More Than 4-Camera (6, 8, 12) Systems grow fastest as Level 2+ feature sets demand overlapping fields of view that geometric stitching alone cannot supply. Chinese new-energy platforms already ship eight to thirteen cameras, and once the sensor set exists for autonomy, the surround display costs almost nothing additional. Buyers specifying for future feature expansion increasingly overshoot current requirements deliberately.

By Camera Functioning

Sub-SegmentKey Trend
Automatic (Auto Switching/AI)View selection driven by speed, gear, and steering angle inputs
ManualRetained only in cost-constrained retrofit installations


Automatic (Auto Switching/AI) dominates and also outgrows Manual, because augmented overlays and trajectory lines require continuous viewpoint tracking that a driver cannot perform while manoeuvring. Manual switching survives in budget aftermarket kits where a single toggle is acceptable and compute is minimal. As domain controllers absorb view-selection logic at no incremental hardware cost, the technical justification for manual control disappears entirely across both OEM and premium retrofit channels.

By Vehicle Type

Sub-SegmentKey Trend
Passenger CarsRegulatory fitment combined with subscription feature packaging
Commercial VehiclesFleet insurance savings and 2027 European blind-spot extension


Passenger Cars hold the dominant share because type-approval mandates apply across every model line and automakers bundle the display into trim ladders. Commercial Vehicles grow fastest: operators calculate payback directly from reduced low-speed claims and premium credits, and Europe's 2027 extension to vans and heavy goods vehicles converts a voluntary purchase into a compliance obligation. Retrofit economics on the existing commercial parc make this the segment where installed-base conversion, not new production, drives volume.

By Sales Channel

Sub-SegmentKey Trend
OEM-FittedDormant hardware pre-installation monetized through over-the-air activation.
Aftermarket RetrofitPlug-and-play kits reaching fleet break-even within one to two years


OEM-Fitted commands the revenue base since factory installation is the only route onto new vehicles and automakers now standardize the camera set across trims to simplify manufacturing. Aftermarket Retrofit grows fastest from a small base, driven by commercial operators facing mandates on vehicles already in service. The two channels monetize in opposite directions — recurring software activation against one-time hardware resale — which shapes how suppliers structure their sales organizations.

By Sensor Technology

Sub-SegmentKey Trend
CMOSIntegrated image signal processing, HDR capability, low auxiliary power draw
CCDStructural decline as automotive-qualified fabrication lines retire


CMOS both leads and grows, leaving CCD in terminal decline. Rolling-shutter artefact suppression and high dynamic range address glare and tunnel-exit conditions that regulators and rating agencies now test explicitly. Power consumption matters disproportionately on battery-electric platforms where auxiliary load reduces range, and integrated serializer functions shrink module size enough to keep eight-camera arrays within thermal limits. No credible alternative sensor technology is positioned to displace CMOS within the forecast window.

By Display Type

Sub-SegmentKey Trend
2-D DisplaysLowest compute requirement with established human-machine interface familiarity
3-D and Augmented DisplaysFalling compute cost enabling deployment into mainstream trims


2-D Displays lead on volume because bird's-eye composition runs on modest silicon and drivers already understand the format. 3-D and Augmented Displays grow fastest as vision SoC pricing falls: BMW's 3-D projection measurably reduces parking errors, and Chinese manufacturers have pushed augmented views into vehicles priced well below the luxury tier. The shift is compute-driven rather than demand-driven — once the rendering capability is present in the domain controller, the incremental cost approaches zero.




Download PDF ×

We do not share your information with anyone. However, we may send you emails based on your report interest from time to time. You may contact us at any time to opt-out.