• Cat-intel
  • MedIntelliX
  • Resources
  • About Us
  • Request Free Sample ×

    Kindly complete the form below to receive a free sample of this Report

    Leading companies partner with us for data-driven Insights

    clients tt-cursor

    Live Streaming Pay Per View Market

    ID: MRFR/ICT/9660-HCR
    100 Pages
    Aarti Dhapte
    September 2025

    Live Streaming Pay Per View Market Research Report By Event Type (Sports, Concerts, Theatre, Conferences, Online Gaming), By Platform (OTT Platforms, Social Media Platforms, Dedicated Streaming Services, Cable and Satellite Providers, Telco Providers), By Pricing Model (Pay-Per-View, Subscription-Based, Tiered Pricing, Bundled Packages, Advertising-Supported), By Audience Type (Individual Consumers, Businesses, Educational Institutions, Non-Profit Organizations, Government Agencies), By Device Type (Smartphones, Tablets, Laptops, Desktops, C...

    Share:
    Download PDF ×

    We do not share your information with anyone. However, we may send you emails based on your report interest from time to time. You may contact us at any time to opt-out.

    Live Streaming Pay Per View Market Research Report - Global Forecast till 2034 Infographic
    Purchase Options
    $ 4,950.0
    $ 5,950.0
    $ 7,250.0
    Table of Contents

    Live Streaming Pay Per View Market Summary

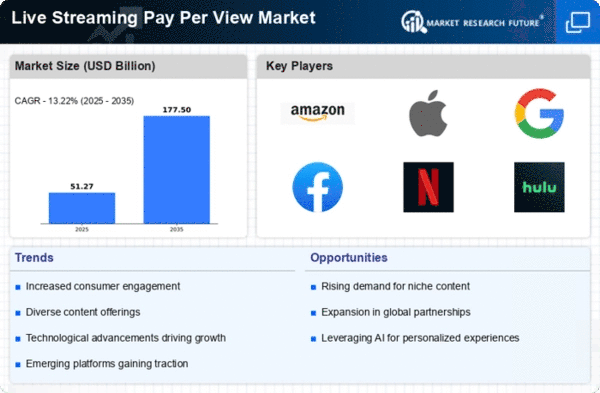
    The Global Live Streaming Pay Per View Market is projected to grow from 45.3 USD Billion in 2024 to 177.5 USD Billion by 2035.

    Key Market Trends & Highlights

    Live Streaming Pay Per View Key Trends and Highlights

    • The market is expected to experience a compound annual growth rate (CAGR) of 13.22 percent from 2025 to 2035.
    • By 2035, the market valuation is anticipated to reach 177.5 USD Billion, indicating robust growth potential.
    • In 2024, the market is valued at 45.3 USD Billion, reflecting a strong foundation for future expansion.
    • Growing adoption of live streaming technology due to increasing consumer demand for on-demand content is a major market driver.

    Market Size & Forecast

    2024 Market Size 45.3 (USD Billion)
    2035 Market Size 177.5 (USD Billion)
    CAGR (2025-2035) 13.22%

    Major Players

    FuboTV, Sling TV, Fanatiz, Bleacher Report Live, ESPN+, Showtime Sports, Apple TV+, Amazon Prime Video, PFL, Paramount+, Peacock, WWE Network, DAZN, UFC Fight Pass, FITE.tv, YouTube TV, FloSports

    Live Streaming Pay Per View Market Trends

    The global live streaming pay-per-view market continues to experience rapid growth, driven by the increasing popularity of online entertainment and the proliferation of connected devices. Key market drivers include rising disposable incomes, the growing popularity of e-sports, and the increasing adoption of virtual reality and augmented reality technologies. Additionally, the emergence of cloud-based platforms and the declining cost of live streaming production are making it more accessible for content creators to broadcast live events.

    Opportunities abound for companies operating in this market. The increasing adoption of mobile devices and the growth of social media platforms present opportunities for targeted advertising and marketing campaigns. The rise of virtual events and online communities creates opportunities for new revenue streams. Additionally, the increasing demand for personalized content and interactive experiences presents opportunities for companies to develop innovative live streaming solutions.

    Recent trends in the live streaming pay-per-view market include the rise of micro-influencers, the increasing use of artificial intelligence for personalized content recommendations, and the growing adoption of pay-what-you-want pricing models. These trends indicate a shift towards more personalized and immersive experiences, as well as a growing willingness among consumers to pay for high-quality content.

    Figure 1: Live Streaming Pay Per View Market size 2025-2034

    Source: Primary Research, Secondary Research, Market Research Future Database and Analyst Review

    The Global Live Streaming Pay Per View Market appears to be experiencing a notable shift towards increased consumer engagement and diversified content offerings, suggesting a robust growth trajectory in the digital entertainment landscape.

    U.S. Department of Commerce

    Live Streaming Pay Per View Market Drivers

    Market Growth Projections

    Rising Demand for On-Demand Content

    The Global Live Streaming Pay Per View Market Industry experiences a surge in demand for on-demand content, driven by changing consumer preferences. Viewers increasingly favor the flexibility of watching events at their convenience, leading to a notable increase in subscriptions and pay-per-view purchases. This trend is particularly evident in sports and entertainment sectors, where major events are now frequently offered through live streaming platforms. As a result, the market is projected to reach 45.3 USD Billion in 2024, reflecting a robust growth trajectory as consumers seek personalized viewing experiences.

    Emergence of Niche Content Providers

    The Global Live Streaming Pay Per View Market Industry is experiencing the emergence of niche content providers catering to specific audience segments. These platforms focus on specialized content, such as independent films, esports, and unique cultural events, attracting dedicated viewer bases. By offering tailored pay-per-view options, these providers enhance viewer engagement and loyalty. This diversification within the market not only enriches the content landscape but also contributes to overall market growth. As niche providers gain traction, they play a crucial role in shaping the future of live streaming and pay-per-view models.

    Global Expansion of Streaming Platforms

    The Global Live Streaming Pay Per View Market Industry is witnessing a global expansion of streaming platforms, which enhances accessibility for diverse audiences. Companies are increasingly targeting international markets, adapting content to local preferences and languages. This strategy not only broadens the customer base but also drives revenue growth through localized pay-per-view offerings. As streaming platforms continue to expand their reach, the market is poised for sustained growth, with a projected CAGR of 13.22% from 2025 to 2035. This expansion reflects the industry's commitment to meeting the evolving demands of a global audience.

    Increased Investment in Live Sports Broadcasting

    The Global Live Streaming Pay Per View Market Industry benefits from substantial investments in live sports broadcasting. Major sports leagues and organizations are increasingly partnering with streaming platforms to reach wider audiences. This trend is exemplified by lucrative deals between sports leagues and streaming services, which enhance the availability of live sports content. As a result, the market is expected to grow significantly, with projections indicating a market size of 177.5 USD Billion by 2035. This investment not only elevates the profile of live sports but also solidifies the role of pay-per-view models in monetizing sports content.

    Technological Advancements in Streaming Services

    Technological innovations play a pivotal role in shaping the Global Live Streaming Pay Per View Market Industry. Enhanced internet connectivity, particularly with the rollout of 5G technology, facilitates seamless streaming experiences. Furthermore, advancements in video compression technologies improve the quality of live streams, making them more accessible to a broader audience. These developments not only enhance user satisfaction but also attract new subscribers, contributing to the market's growth. As streaming services continue to evolve, the industry is well-positioned to capitalize on emerging technologies, potentially driving revenues significantly in the coming years.

    Market Segment Insights

    Live Streaming Pay Per View Market Event Type Insights

    The Global Live Streaming Pay Per View Market is segmented by Event Type into Sports, Concerts, Theatre, Conferences, and Online Gaming. Among these segments, Sports is expected to hold the largest market share during the forecast period due to the increasing popularity of live sports streaming services and the growing number of sports fans worldwide. The Global Live Streaming Pay Per View Market revenue for the Sports segment is projected to reach $25.63 billion by 2024, exhibiting a CAGR of 14.5% during the forecast period.

    Concerts are another major segment in the Global Live Streaming Pay Per View Market, with a significant market share. The growing demand for virtual concerts and the increasing popularity of live music streaming platforms are driving the growth of this segment.

    The Global Live Streaming Pay Per View Market revenue for the Concerts segment is expected to reach $10.26 billion by 2024, registering a CAGR of 12.8% during the forecast period. Theatre and Conferences are also notable segments in the Global Live Streaming Pay Per View Market, with steady growth rates. The increasing adoption of live streaming platforms for theatre performances and conferences is contributing to the growth of these segments.

    The Global Live Streaming Pay Per View Market revenue for the Theatre segment is projected to reach $4.51 billion by 2024, while the revenue for the Conferences segment is expected to reach $3.84 billion by 2024. Online Gaming is a rapidly growing segment in the Global Live Streaming Pay Per View Market, driven by the surge in popularity of live-streamed gaming content and the increasing number of gamers worldwide.

    The Global Live Streaming Pay Per View Market revenue for the Online Gaming segment is anticipated to reach $2.98 billion by 2024, exhibiting a robust CAGR of 16.7% during the forecast period.

    Live Streaming Pay Per View Market Platform Insights

    The Global Live Streaming Pay Per View Market is segmented based on Platform into OTT Platforms, Social Media Platforms, Dedicated Streaming Services, Cable and Satellite Providers, and Telco Providers. OTT Platforms are expected to hold the largest market share in 2023, owing to the increasing popularity of subscription-based video streaming services. Social Media Platforms are also expected to witness significant growth, as they offer live streaming capabilities to their users. Dedicated Streaming Services are expected to gain traction, as they provide a more specialized platform for live streaming content.

    Cable and Satellite Providers are expected to face challenges due to the increasing adoption of OTT Platforms, but they are expected to remain relevant for live sports and other premium content. Telco Providers are expected to play a key role in the growth of the Live Streaming Pay Per View Market, as they offer high-speed internet connectivity and have a wide customer base.

    Live Streaming Pay Per View Market Pricing Model Insights

    The Global Live Streaming Pay Per View Market is segmented based on pricing model into Pay-Per-View, Subscription-Based, Tiered Pricing, Bundled Packages, and Advertising-Supported models. Among these, the Pay-Per-View model contributed the largest revenue share in 2023, owing to its flexibility and convenience for viewers to pay only for the content they want to watch. The Subscription-Based model is expected to witness significant growth during the forecast period, due to its cost-effectiveness and the increasing popularity of subscription-based services.

    Tiered Pricing and Bundled Packages offer viewers a wider range of options and price points, while the Advertising-Supported model relies on advertising revenue to provide content at a lower cost to viewers.

    Live Streaming Pay Per View Market Audience Type Insights

    The Global Live Streaming Pay Per View Market is segmented by Audience Type into Individual Consumers, Businesses, Educational Institutions, Non-Profit Organizations, and Government Agencies. Among these, Individual Consumers held the largest market share in 2023, accounting for 60.1% of the Global Live Streaming Pay Per View Market revenue. The segment is expected to continue its dominance throughout the forecast period, owing to the increasing popularity of live streaming services among individuals for entertainment and educational purposes.

    Businesses are also expected to witness significant growth in the Global Live Streaming Pay Per View Market, with a CAGR of 14.5% from 2023 to 2032.

    This growth can be attributed to the rising adoption of live streaming services by businesses for corporate events, product launches, and training webinars. Educational Institutions are another key segment in the Global Live Streaming Pay Per View Market, with a market share of 12.2% in 2023. The segment is expected to grow at a CAGR of 13.8% over the forecast period, driven by the increasing adoption of live streaming technology for online learning and virtual classrooms. Non-Profit Organizations and Government Agencies are expected to have a moderate growth rate in the Global Live Streaming Pay Per View Market.

    These segments are leveraging live streaming services for fundraising, public awareness campaigns, and government events, respectively.

    Live Streaming Pay Per View Market Device Type Insights

    The Global Live Streaming Pay Per View Market is segmented by Device Type into Smartphones, Tablets, Laptops, Desktops, and Connected TVs. The Smartphones segment is expected to hold the largest market share in 2023 and is projected to continue its dominance throughout the forecast period. The increasing penetration of smartphones with advanced features such as high-resolution displays, powerful processors, and fast internet connectivity is driving the growth of this segment.

    Additionally, the growing popularity of mobile video content and the convenience of watching live events on the go are contributing to the growth of the Live Streaming Pay Per View Market on smartphones. The Tablets segment is also expected to experience significant growth over the forecast period, owing to the increasing popularity of tablet devices for media consumption and the growing availability of live streaming content on tablets.

    Get more detailed insights about Live Streaming Pay Per View Market Research Report - Global Forecast till 2034

    Regional Insights

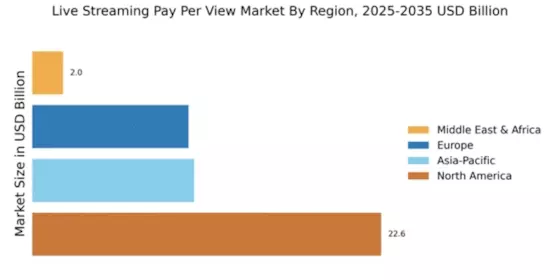
    The Global Live Streaming Pay Per View Market is segmented into North America, Europe, APAC, South America, and MEA. North America is the largest regional market, accounting for over 40% of the global market revenue in 2024. Europe is the second-largest regional market, followed by APAC, South America, and MEA. The APAC region is expected to grow at the highest CAGR during the forecast period, driven by the increasing popularity of live streaming pay per view services in emerging markets such as India and China.

    The growth of the Global Live Streaming Pay Per View Market is attributed to the increasing popularity of live streaming content, the rising adoption of smart devices, and the growing popularity of esports. The market is also driven by the increasing demand for premium content and the growing number of live events being streamed online.

    Figure 3 : Live Streaming Pay Per View Market By Regional, 2023 & 2032

    Live Streaming Pay Per View Market Regional Insights

    Source: Primary Research, Secondary Research, Market Research Future Database and Analyst Review

    Key Players and Competitive Insights

    Major players in Live Streaming Pay Per View Market industry are constantly striving to gain a competitive advantage by introducing innovative features, expanding their geographical reach, and acquiring smaller players. Leading Live Streaming Pay Per View Market players are investing heavily in research and development to enhance the user experience and stay ahead of the competition. The Live Streaming Pay Per View Market development is being driven by the growing popularity of live streaming, the increasing adoption of smart TVs and connected devices, and the rising demand for premium content.

    The Live Streaming Pay Per View Market Competitive Landscape is expected to remain highly competitive in the coming years, with new entrants and established players vying for market share.

    One of the leading companies in the Live Streaming Pay Per View Market is FuboTV. FuboTV is a sports-first live TV streaming service that offers over 100 channels, including local channels, sports channels, and news channels. FuboTV also offers a cloud DVR service and a mobile app. FuboTV has been growing rapidly in recent years, and it is now one of the most popular live TV streaming services in the United States. A major competitor to FuboTV is Sling TV.

    Sling TV is a live TV streaming service that offers over 50 channels, including local channels, sports channels, and news channels. Sling TV also offers a cloud DVR service and a mobile app. Sling TV is less expensive than FuboTV, but it offers a smaller selection of channels. Sling TV has been growing slowly in recent years, but it remains a popular option for cord-cutters.

    Key Companies in the Live Streaming Pay Per View Market market include

    Industry Developments

    • Q2 2024: YouTube launches pay-per-view live streaming for creators YouTube announced the rollout of a new pay-per-view live streaming feature, allowing creators to monetize exclusive live events directly on the platform. The launch aims to compete with other PPV platforms and expand YouTube’s monetization options for content creators.
    • Q2 2024: DAZN acquires rights to stream UEFA Champions League final as pay-per-view event DAZN secured exclusive rights to offer the UEFA Champions League final as a pay-per-view live stream in select markets, marking a significant expansion of its PPV sports offerings.
    • Q2 2024: Meta partners with UFC to launch pay-per-view VR live events Meta announced a partnership with UFC to deliver pay-per-view mixed martial arts events in virtual reality, leveraging Meta Quest headsets for immersive live experiences.
    • Q3 2024: Amazon Prime Video introduces pay-per-view live concerts Amazon Prime Video launched a new pay-per-view live concert series, featuring major artists and exclusive performances, expanding its live event streaming portfolio.
    • Q3 2024: Vimeo launches pay-per-view live streaming for enterprise clients Vimeo announced the launch of a pay-per-view live streaming solution tailored for enterprise clients, enabling businesses to monetize virtual conferences and product launches.
    • Q3 2024: FITE secures multi-year contract to stream boxing events via pay-per-view FITE signed a multi-year contract with a major boxing promotion to stream all championship fights as pay-per-view events, strengthening its position in the combat sports streaming market.
    • Q4 2024: Eventbrite launches integrated pay-per-view live streaming for ticketed events Eventbrite introduced a new feature allowing organizers to sell pay-per-view access to live streamed events directly through its platform, targeting music, theater, and sports.
    • Q4 2024: TikTok launches pay-per-view live streaming for influencers TikTok rolled out a pay-per-view live streaming feature, enabling influencers to charge viewers for access to exclusive live content and performances.
    • Q1 2025: Live Nation announces global pay-per-view streaming platform for concerts Live Nation unveiled a new global pay-per-view streaming platform, allowing fans to purchase access to live concerts and festivals from anywhere in the world.
    • Q1 2025: Apple TV+ partners with NBA for pay-per-view live games Apple TV+ entered into a partnership with the NBA to offer select games as pay-per-view live streams, expanding its sports content offerings.
    • Q2 2025: ViacomCBS launches pay-per-view live streaming for Paramount+ ViacomCBS announced the launch of pay-per-view live streaming events on Paramount+, including sports, concerts, and exclusive entertainment content.
    • Q2 2025: StageIt raises $20 million Series B to expand pay-per-view live streaming platform StageIt, a live streaming pay-per-view platform for artists, closed a $20 million Series B funding round to accelerate product development and international expansion.

    Future Outlook

    Live Streaming Pay Per View Market Future Outlook

    The Global Live Streaming Pay Per View Market is poised for robust growth at a 13.22% CAGR from 2024 to 2035, driven by technological advancements and increasing consumer demand.

    New opportunities lie in:

    • Develop niche content for underserved audiences to capture new market segments.
    • Leverage AI-driven analytics to enhance viewer engagement and personalize offerings.
    • Form strategic partnerships with content creators to expand distribution channels.

    By 2035, the market is expected to achieve substantial growth, solidifying its position as a key player in the entertainment industry.

    Market Segmentation

    Live Streaming Pay Per View Market Platform Outlook

    • Pay-Per-View
    • Subscription-Based
    • Tiered Pricing
    • Bundled Packages
    • Advertising-Supported

    Live Streaming Pay Per View Market Regional Outlook

    • North America
    • Europe
    • South America
    • Asia Pacific
    • Middle East and Africa

    Live Streaming Pay Per View Market Event Type Outlook

    • OTT Platforms
    • Social Media Platforms
    • Dedicated Streaming Services
    • Cable and Satellite Providers
    • Telco Providers

    Live Streaming Pay Per View Market Device Type Outlook

    • North America
    • Europe
    • South America
    • Asia Pacific
    • Middle East and Africa

    Live Streaming Pay Per View Market Audience Type Outlook

    • Smartphones
    • Tablets
    • Laptops
    • Desktops
    • Connected TVs

    Live Streaming Pay Per View Market Pricing Model Outlook

    • Individual Consumers
    • Businesses
    • Educational Institutions
    • Non-Profit Organizations
    • Government Agencies

    Report Scope

    Report Attribute/Metric Details
    Market Size 2024 45.28 (USD Billion)
    Market Size 2025 51.27 (USD Billion)
    Market Size 2034 156.76 (USD Billion)
    Compound Annual Growth Rate (CAGR) 13.22% (2025 - 2034)
    Report Coverage Revenue Forecast, Competitive Landscape, Growth Factors, and Trends
    Base Year 2024
    Market Forecast Period 2025 - 2034
    Historical Data 2019 - 2023
    Market Forecast Units USD Billion
    Key Companies Profiled Fanatiz, Bleacher Report Live, ESPN+, Showtime Sports, Apple TV+, Amazon Prime Video, PFL, Paramount+, Peacock, WWE Network, DAZN, UFC Fight Pass, FITE.tv, YouTube TV, FloSports
    Segments Covered Event Type, Platform, Pricing Model, Audience Type, Device Type, Regional
    Key Market Opportunities Immersive experiences Niche content monetization Virtual gifting Localized content AIpowered personalization
    Key Market Dynamics Rising Popularity Technological Advancements Growing Esports Culture Increased Mobile Penetration Expanding Content Portfolio
    Countries Covered North America, Europe, APAC, South America, MEA

    Market Highlights

    Author
    Aarti Dhapte
    Team Lead - Research

    She holds an experience of about 6+ years in Market Research and Business Consulting, working under the spectrum of Information Communication Technology, Telecommunications and Semiconductor domains. Aarti conceptualizes and implements a scalable business strategy and provides strategic leadership to the clients. Her expertise lies in market estimation, competitive intelligence, pipeline analysis, customer assessment, etc.

    Leave a Comment

    FAQs

    What is the market size of the Global Live Streaming Pay Per View Market?

    The Global Live Streaming Pay Per View Market is expected to reach USD 156.76 billion by 2032, exhibiting a CAGR of 13.22% during the forecast period (2025-2034).

    What are the key factors driving the growth of the market?

    Key factors driving market growth include the increasing popularity of live streaming services, the growing adoption of OTT platforms, the rising demand for premium content, and the increasing penetration of high-speed internet.

    Which region is expected to hold the largest market share?

    North America is expected to account for the largest market share due to the presence of major players, high internet penetration, and a large consumer base.

    Who are the key competitors in the market?

    Key competitors include Amazon, Netflix, Disney+, Hulu, and DAZN.

    What are the major applications of Live Streaming Pay Per View?

    Major applications include sports, entertainment, and education.

    What is the expected growth rate of the market?

    The market is expected to grow at a CAGR of 13.22% from 2025 to 2034.

    What are the challenges facing the market?

    Challenges include piracy, content rights issues, and the need for high-quality internet connectivity.

    What are the key trends in the market?

    Key trends include the increasing adoption of 5G technology, the rise of virtual reality and augmented reality, and the growing popularity of personalized content.

    What are the opportunities for growth in the market?

    Opportunities for growth include the expansion into emerging markets, the development of new content formats, and the integration of artificial intelligence and machine learning.

    What are the key strategies adopted by players in the market?

    Key strategies include content acquisition, partnerships, and technological innovation.

    1. EXECUTIVE SUMMARY
    2. Market Overview
      1. Key Findings
      2. Market Segmentation
    3. Competitive Landscape
      1. Challenges and Opportunities
      2. Future Outlook
    4. MARKET INTRODUCTION
      1. Definition
      2. Scope of the study
        1. Research Objective
        2. Assumption
        3. Limitations
    5. RESEARCH METHODOLOGY
      1. Overview
    6. Data Mining
      1. Secondary Research
      2. Primary Research
    7. Primary Interviews and Information Gathering Process
      1. Breakdown of Primary
    8. Respondents
      1. Forecasting Model
      2. Market Size Estimation
    9. Bottom-Up Approach
      1. Top-Down Approach
      2. Data Triangulation
      3. Validation
    10. MARKET DYNAMICS
      1. Overview
      2. Drivers
      3. Restraints
      4. Opportunities
    11. MARKET FACTOR ANALYSIS
      1. Value chain Analysis
      2. Porter's Five Forces
    12. Analysis
      1. Bargaining Power of Suppliers
        1. Bargaining Power
    13. of Buyers
      1. Threat of New Entrants
        1. Threat of Substitutes
        2. Intensity of Rivalry
      2. COVID-19 Impact Analysis
    14. Market Impact Analysis
      1. Regional Impact
        1. Opportunity and
    15. Threat Analysis
    16. Live Streaming Pay Per View Market, BY
    17. Event Type (USD Billion)
      1. Sports
      2. Concerts
      3. Theatre
      4. Conferences
      5. Online Gaming
    18. Live Streaming Pay Per
    19. View Market, BY Platform (USD Billion)
      1. OTT Platforms
      2. Social
    20. Media Platforms
      1. Dedicated Streaming Services
      2. Cable and Satellite
    21. Providers
      1. Telco Providers
    22. Live Streaming Pay Per View Market,
    23. BY Pricing Model (USD Billion)
      1. Pay-Per-View
      2. Subscription-Based
      3. Tiered Pricing
      4. Bundled Packages
      5. Advertising-Supported
    24. Live Streaming Pay Per View Market, BY Audience Type (USD Billion)
      1. Individual Consumers
      2. Businesses
      3. Educational Institutions
      4. Non-Profit Organizations
      5. Government Agencies
    25. Live
    26. Streaming Pay Per View Market, BY Device Type (USD Billion)
      1. Smartphones
      2. Tablets
      3. Laptops
      4. Desktops
      5. Connected
    27. TVs
    28. Live Streaming Pay Per View Market, BY Regional (USD Billion)
      1. North America
        1. US
        2. Canada
      2. Europe
        1. Germany
        2. UK
        3. France
        4. Russia
        5. Italy
        6. Spain
        7. Rest of Europe
      3. APAC
        1. China
        2. India
        3. Japan
        4. South
    29. Korea
      1. Malaysia
        1. Thailand
        2. Indonesia
        3. Rest of APAC
      2. South America
        1. Brazil
    30. Mexico
      1. Argentina
        1. Rest of South America
      2. MEA
        1. GCC Countries
        2. South Africa
        3. Rest of MEA
    31. Competitive Landscape
      1. Overview
    32. Competitive Analysis
      1. Market share Analysis
      2. Major Growth
    33. Strategy in the Live Streaming Pay Per View Market
      1. Competitive Benchmarking
      2. Leading Players in Terms of Number of Developments in the Live Streaming
    34. Pay Per View Market
      1. Key developments and growth strategies
    35. New Product Launch/Service Deployment
      1. Merger & Acquisitions
        1. Joint Ventures
      2. Major Players Financial Matrix
    36. Sales and Operating Income
      1. Major Players R&D Expenditure. 2023
    37. Company Profiles
      1. Fanatiz
        1. Financial Overview
        2. Products Offered
        3. Key Developments
        4. SWOT
    38. Analysis
      1. Key Strategies
      2. Bleacher Report Live
    39. Financial Overview
      1. Products Offered
        1. Key Developments
        2. SWOT Analysis
        3. Key Strategies
      2. ESPN+
    40. Financial Overview
      1. Products Offered
        1. Key Developments
        2. SWOT Analysis
        3. Key Strategies
      2. Showtime Sports
        1. Financial Overview
        2. Products Offered
        3. Key
    41. Developments
      1. SWOT Analysis
        1. Key Strategies
    42. Apple TV+
      1. Financial Overview
        1. Products Offered
    43. Key Developments
      1. SWOT Analysis
        1. Key Strategies
    44. Amazon Prime Video
      1. Financial Overview
        1. Products Offered
        2. Key Developments
        3. SWOT Analysis
        4. Key Strategies
      2. PFL
        1. Financial Overview
        2. Products Offered
        3. Key Developments
        4. SWOT Analysis
        5. Key Strategies
      3. Paramount+
        1. Financial Overview
        2. Products Offered
        3. Key Developments
        4. SWOT Analysis
        5. Key Strategies
      4. Peacock
        1. Financial Overview
        2. Products Offered
        3. Key Developments
        4. SWOT Analysis
        5. Key Strategies
      5. WWE Network
        1. Financial Overview
        2. Products
    45. Offered
      1. Key Developments
        1. SWOT Analysis
    46. Key Strategies
      1. DAZN
        1. Financial Overview
    47. Products Offered
      1. Key Developments
        1. SWOT Analysis
        2. Key Strategies
      2. UFC Fight Pass
        1. Financial Overview
        2. Products Offered
        3. Key Developments
        4. SWOT
    48. Analysis
      1. Key Strategies
      2. FITE.tv
        1. Financial
    49. Overview
      1. Products Offered
        1. Key Developments
    50. SWOT Analysis
      1. Key Strategies
      2. YouTube TV
    51. Financial Overview
      1. Products Offered
        1. Key Developments
        2. SWOT Analysis
        3. Key Strategies
      2. FloSports
        1. Financial Overview
        2. Products Offered
    52. Key Developments
      1. SWOT Analysis
        1. Key Strategies
    53. Appendix
      1. References
      2. Related Reports
    54. Streaming Pay Per View Market SIZE ESTIMATES & FORECAST, BY EVENT TYPE, 2019-2032
    55. (USD Billions)
    56. ESTIMATES & FORECAST, BY PLATFORM, 2019-2032 (USD Billions)
    57. America Live Streaming Pay Per View Market SIZE ESTIMATES & FORECAST, BY PRICING
    58. MODEL, 2019-2032 (USD Billions)
    59. Per View Market SIZE ESTIMATES & FORECAST, BY AUDIENCE TYPE, 2019-2032 (USD
    60. Billions)
    61. & FORECAST, BY DEVICE TYPE, 2019-2032 (USD Billions)
    62. Live Streaming Pay Per View Market SIZE ESTIMATES & FORECAST, BY REGIONAL, 2019-2032
    63. (USD Billions)
    64. & FORECAST, BY EVENT TYPE, 2019-2032 (USD Billions)
    65. Pay Per View Market SIZE ESTIMATES & FORECAST, BY PLATFORM, 2019-2032 (USD Billions)
    66. BY PRICING MODEL, 2019-2032 (USD Billions)
    67. Per View Market SIZE ESTIMATES & FORECAST, BY AUDIENCE TYPE, 2019-2032 (USD
    68. Billions)
    69. FORECAST, BY DEVICE TYPE, 2019-2032 (USD Billions)
    70. Pay Per View Market SIZE ESTIMATES & FORECAST, BY REGIONAL, 2019-2032 (USD Billions)
    71. BY EVENT TYPE, 2019-2032 (USD Billions)
    72. Per View Market SIZE ESTIMATES & FORECAST, BY PLATFORM, 2019-2032 (USD Billions)
    73. BY PRICING MODEL, 2019-2032 (USD Billions)
    74. Pay Per View Market SIZE ESTIMATES & FORECAST, BY AUDIENCE TYPE, 2019-2032 (USD
    75. Billions)
    76. & FORECAST, BY DEVICE TYPE, 2019-2032 (USD Billions)
    77. Live Streaming Pay Per View Market SIZE ESTIMATES & FORECAST, BY REGIONAL, 2019-2032
    78. (USD Billions)
    79. & FORECAST, BY EVENT TYPE, 2019-2032 (USD Billions)
    80. Streaming Pay Per View Market SIZE ESTIMATES & FORECAST, BY PLATFORM, 2019-2032
    81. (USD Billions)
    82. & FORECAST, BY PRICING MODEL, 2019-2032 (USD Billions)
    83. Live Streaming Pay Per View Market SIZE ESTIMATES & FORECAST, BY AUDIENCE TYPE,
    84. 2032 (USD Billions)
    85. SIZE ESTIMATES & FORECAST, BY DEVICE TYPE, 2019-2032 (USD Billions)
    86. Europe Live Streaming Pay Per View Market SIZE ESTIMATES & FORECAST, BY
    87. REGIONAL, 2019-2032 (USD Billions)
    88. View Market SIZE ESTIMATES & FORECAST, BY EVENT TYPE, 2019-2032 (USD Billions)
    89. FORECAST, BY PLATFORM, 2019-2032 (USD Billions)
    90. Pay Per View Market SIZE ESTIMATES & FORECAST, BY PRICING MODEL, 2019-2032 (USD
    91. Billions)
    92. & FORECAST, BY AUDIENCE TYPE, 2019-2032 (USD Billions)
    93. Live Streaming Pay Per View Market SIZE ESTIMATES & FORECAST, BY DEVICE TYPE,
    94. 2032 (USD Billions)
    95. SIZE ESTIMATES & FORECAST, BY REGIONAL, 2019-2032 (USD Billions)
    96. UK Live Streaming Pay Per View Market SIZE ESTIMATES & FORECAST, BY EVENT
    97. TYPE, 2019-2032 (USD Billions)
    98. SIZE ESTIMATES & FORECAST, BY PLATFORM, 2019-2032 (USD Billions)
    99. UK Live Streaming Pay Per View Market SIZE ESTIMATES & FORECAST, BY PRICING
    100. MODEL, 2019-2032 (USD Billions)
    101. SIZE ESTIMATES & FORECAST, BY AUDIENCE TYPE, 2019-2032 (USD Billions)
    102. UK Live Streaming Pay Per View Market SIZE ESTIMATES & FORECAST, BY DEVICE
    103. TYPE, 2019-2032 (USD Billions)
    104. SIZE ESTIMATES & FORECAST, BY REGIONAL, 2019-2032 (USD Billions)
    105. France Live Streaming Pay Per View Market SIZE ESTIMATES & FORECAST, BY
    106. EVENT TYPE, 2019-2032 (USD Billions)
    107. View Market SIZE ESTIMATES & FORECAST, BY PLATFORM, 2019-2032 (USD Billions)
    108. BY PRICING MODEL, 2019-2032 (USD Billions)
    109. Pay Per View Market SIZE ESTIMATES & FORECAST, BY AUDIENCE TYPE, 2019-2032 (USD
    110. Billions)
    111. & FORECAST, BY DEVICE TYPE, 2019-2032 (USD Billions)
    112. Live Streaming Pay Per View Market SIZE ESTIMATES & FORECAST, BY REGIONAL, 2019-2032
    113. (USD Billions)
    114. & FORECAST, BY EVENT TYPE, 2019-2032 (USD Billions)
    115. Streaming Pay Per View Market SIZE ESTIMATES & FORECAST, BY PLATFORM, 2019-2032
    116. (USD Billions)
    117. & FORECAST, BY PRICING MODEL, 2019-2032 (USD Billions)
    118. Live Streaming Pay Per View Market SIZE ESTIMATES & FORECAST, BY AUDIENCE TYPE,
    119. 2032 (USD Billions)
    120. SIZE ESTIMATES & FORECAST, BY DEVICE TYPE, 2019-2032 (USD Billions)
    121. Russia Live Streaming Pay Per View Market SIZE ESTIMATES & FORECAST, BY
    122. REGIONAL, 2019-2032 (USD Billions)
    123. View Market SIZE ESTIMATES & FORECAST, BY EVENT TYPE, 2019-2032 (USD Billions)
    124. BY PLATFORM, 2019-2032 (USD Billions)
    125. View Market SIZE ESTIMATES & FORECAST, BY PRICING MODEL, 2019-2032 (USD Billions)
    126. BY AUDIENCE TYPE, 2019-2032 (USD Billions)
    127. Pay Per View Market SIZE ESTIMATES & FORECAST, BY DEVICE TYPE, 2019-2032 (USD
    128. Billions)
    129. & FORECAST, BY REGIONAL, 2019-2032 (USD Billions)
    130. Streaming Pay Per View Market SIZE ESTIMATES & FORECAST, BY EVENT TYPE, 2019-2032
    131. (USD Billions)
    132. & FORECAST, BY PLATFORM, 2019-2032 (USD Billions)
    133. Streaming Pay Per View Market SIZE ESTIMATES & FORECAST, BY PRICING MODEL, 2019-2032
    134. (USD Billions)
    135. & FORECAST, BY AUDIENCE TYPE, 2019-2032 (USD Billions)
    136. Live Streaming Pay Per View Market SIZE ESTIMATES & FORECAST, BY DEVICE TYPE,
    137. 2032 (USD Billions)
    138. SIZE ESTIMATES & FORECAST, BY REGIONAL, 2019-2032 (USD Billions)
    139. Rest of Europe Live Streaming Pay Per View Market SIZE ESTIMATES & FORECAST,
    140. BY EVENT TYPE, 2019-2032 (USD Billions)
    141. Pay Per View Market SIZE ESTIMATES & FORECAST, BY PLATFORM, 2019-2032 (USD Billions)
    142. & FORECAST, BY PRICING MODEL, 2019-2032 (USD Billions)
    143. of Europe Live Streaming Pay Per View Market SIZE ESTIMATES & FORECAST, BY AUDIENCE
    144. TYPE, 2019-2032 (USD Billions)
    145. Per View Market SIZE ESTIMATES & FORECAST, BY DEVICE TYPE, 2019-2032 (USD Billions)
    146. & FORECAST, BY REGIONAL, 2019-2032 (USD Billions)
    147. Streaming Pay Per View Market SIZE ESTIMATES & FORECAST, BY EVENT TYPE, 2019-2032
    148. (USD Billions)
    149. & FORECAST, BY PLATFORM, 2019-2032 (USD Billions)
    150. Streaming Pay Per View Market SIZE ESTIMATES & FORECAST, BY PRICING MODEL, 2019-2032
    151. (USD Billions)
    152. & FORECAST, BY AUDIENCE TYPE, 2019-2032 (USD Billions)
    153. Live Streaming Pay Per View Market SIZE ESTIMATES & FORECAST, BY DEVICE TYPE,
    154. 2032 (USD Billions)
    155. SIZE ESTIMATES & FORECAST, BY REGIONAL, 2019-2032 (USD Billions)
    156. China Live Streaming Pay Per View Market SIZE ESTIMATES & FORECAST, BY EVENT
    157. TYPE, 2019-2032 (USD Billions)
    158. Market SIZE ESTIMATES & FORECAST, BY PLATFORM, 2019-2032 (USD Billions)
    159. BY PRICING MODEL, 2019-2032 (USD Billions)
    160. Pay Per View Market SIZE ESTIMATES & FORECAST, BY AUDIENCE TYPE, 2019-2032 (USD
    161. Billions)
    162. & FORECAST, BY DEVICE TYPE, 2019-2032 (USD Billions)
    163. Streaming Pay Per View Market SIZE ESTIMATES & FORECAST, BY REGIONAL, 2019-2032
    164. (USD Billions)
    165. & FORECAST, BY EVENT TYPE, 2019-2032 (USD Billions)
    166. Streaming Pay Per View Market SIZE ESTIMATES & FORECAST, BY PLATFORM, 2019-2032
    167. (USD Billions)
    168. & FORECAST, BY PRICING MODEL, 2019-2032 (USD Billions)
    169. Live Streaming Pay Per View Market SIZE ESTIMATES & FORECAST, BY AUDIENCE TYPE,
    170. 2032 (USD Billions)
    171. SIZE ESTIMATES & FORECAST, BY DEVICE TYPE, 2019-2032 (USD Billions)
    172. India Live Streaming Pay Per View Market SIZE ESTIMATES & FORECAST, BY REGIONAL,
    173. 2032 (USD Billions)
    174. SIZE ESTIMATES & FORECAST, BY EVENT TYPE, 2019-2032 (USD Billions)
    175. Japan Live Streaming Pay Per View Market SIZE ESTIMATES & FORECAST, BY PLATFORM,
    176. 2032 (USD Billions)
    177. SIZE ESTIMATES & FORECAST, BY PRICING MODEL, 2019-2032 (USD Billions)
    178. Japan Live Streaming Pay Per View Market SIZE ESTIMATES & FORECAST, BY AUDIENCE
    179. TYPE, 2019-2032 (USD Billions)
    180. Market SIZE ESTIMATES & FORECAST, BY DEVICE TYPE, 2019-2032 (USD Billions)
    181. BY REGIONAL, 2019-2032 (USD Billions)
    182. Pay Per View Market SIZE ESTIMATES & FORECAST, BY EVENT TYPE, 2019-2032 (USD
    183. Billions)
    184. & FORECAST, BY PLATFORM, 2019-2032 (USD Billions)
    185. Live Streaming Pay Per View Market SIZE ESTIMATES & FORECAST, BY PRICING MODEL,
    186. 2032 (USD Billions)
    187. Market SIZE ESTIMATES & FORECAST, BY AUDIENCE TYPE, 2019-2032 (USD Billions)
    188. FORECAST, BY DEVICE TYPE, 2019-2032 (USD Billions)
    189. Streaming Pay Per View Market SIZE ESTIMATES & FORECAST, BY REGIONAL, 2019-2032
    190. (USD Billions)
    191. ESTIMATES & FORECAST, BY EVENT TYPE, 2019-2032 (USD Billions)
    192. Malaysia Live Streaming Pay Per View Market SIZE ESTIMATES & FORECAST, BY PLATFORM,
    193. 2032 (USD Billions)
    194. SIZE ESTIMATES & FORECAST, BY PRICING MODEL, 2019-2032 (USD Billions)
    195. Malaysia Live Streaming Pay Per View Market SIZE ESTIMATES & FORECAST,
    196. BY AUDIENCE TYPE, 2019-2032 (USD Billions)
    197. Pay Per View Market SIZE ESTIMATES & FORECAST, BY DEVICE TYPE, 2019-2032 (USD
    198. Billions)
    199. & FORECAST, BY REGIONAL, 2019-2032 (USD Billions)
    200. Live Streaming Pay Per View Market SIZE ESTIMATES & FORECAST, BY EVENT TYPE,
    201. 2032 (USD Billions)
    202. SIZE ESTIMATES & FORECAST, BY PLATFORM, 2019-2032 (USD Billions)
    203. Thailand Live Streaming Pay Per View Market SIZE ESTIMATES & FORECAST,
    204. BY PRICING MODEL, 2019-2032 (USD Billions)
    205. Pay Per View Market SIZE ESTIMATES & FORECAST, BY AUDIENCE TYPE, 2019-2032 (USD
    206. Billions)
    207. & FORECAST, BY DEVICE TYPE, 2019-2032 (USD Billions)
    208. Live Streaming Pay Per View Market SIZE ESTIMATES & FORECAST, BY REGIONAL, 2019-2032
    209. (USD Billions)
    210. ESTIMATES & FORECAST, BY EVENT TYPE, 2019-2032 (USD Billions)
    211. Indonesia Live Streaming Pay Per View Market SIZE ESTIMATES & FORECAST, BY PLATFORM,
    212. 2032 (USD Billions)
    213. Market SIZE ESTIMATES & FORECAST, BY PRICING MODEL, 2019-2032 (USD Billions)
    214. FORECAST, BY AUDIENCE TYPE, 2019-2032 (USD Billions)
    215. Live Streaming Pay Per View Market SIZE ESTIMATES & FORECAST, BY DEVICE TYPE,
    216. 2032 (USD Billions)
    217. Market SIZE ESTIMATES & FORECAST, BY REGIONAL, 2019-2032 (USD Billions)
    218. FORECAST, BY EVENT TYPE, 2019-2032 (USD Billions)
    219. Live Streaming Pay Per View Market SIZE ESTIMATES & FORECAST, BY PLATFORM, 2019-2032
    220. (USD Billions)
    221. SIZE ESTIMATES & FORECAST, BY PRICING MODEL, 2019-2032 (USD Billions)
    222. Rest of APAC Live Streaming Pay Per View Market SIZE ESTIMATES & FORECAST,
    223. BY AUDIENCE TYPE, 2019-2032 (USD Billions)
    224. Pay Per View Market SIZE ESTIMATES & FORECAST, BY DEVICE TYPE, 2019-2032 (USD
    225. Billions)
    226. ESTIMATES & FORECAST, BY REGIONAL, 2019-2032 (USD Billions)
    227. South America Live Streaming Pay Per View Market SIZE ESTIMATES & FORECAST,
    228. BY EVENT TYPE, 2019-2032 (USD Billions)
    229. Pay Per View Market SIZE ESTIMATES & FORECAST, BY PLATFORM, 2019-2032 (USD Billions)
    230. & FORECAST, BY PRICING MODEL, 2019-2032 (USD Billions)
    231. America Live Streaming Pay Per View Market SIZE ESTIMATES & FORECAST, BY AUDIENCE
    232. TYPE, 2019-2032 (USD Billions)
    233. Per View Market SIZE ESTIMATES & FORECAST, BY DEVICE TYPE, 2019-2032 (USD Billions)
    234. & FORECAST, BY REGIONAL, 2019-2032 (USD Billions)
    235. Streaming Pay Per View Market SIZE ESTIMATES & FORECAST, BY EVENT TYPE, 2019-2032
    236. (USD Billions)
    237. & FORECAST, BY PLATFORM, 2019-2032 (USD Billions)
    238. Streaming Pay Per View Market SIZE ESTIMATES & FORECAST, BY PRICING MODEL, 2019-2032
    239. (USD Billions)
    240. & FORECAST, BY AUDIENCE TYPE, 2019-2032 (USD Billions)
    241. Live Streaming Pay Per View Market SIZE ESTIMATES & FORECAST, BY DEVICE TYPE,
    242. 2032 (USD Billions)
    243. SIZE ESTIMATES & FORECAST, BY REGIONAL, 2019-2032 (USD Billions)
    244. Mexico Live Streaming Pay Per View Market SIZE ESTIMATES & FORECAST, BY
    245. EVENT TYPE, 2019-2032 (USD Billions)
    246. Per View Market SIZE ESTIMATES & FORECAST, BY PLATFORM, 2019-2032 (USD Billions)
    247. FORECAST, BY PRICING MODEL, 2019-2032 (USD Billions)
    248. Streaming Pay Per View Market SIZE ESTIMATES & FORECAST, BY AUDIENCE TYPE, 2019-2032
    249. (USD Billions)
    250. & FORECAST, BY DEVICE TYPE, 2019-2032 (USD Billions)
    251. Live Streaming Pay Per View Market SIZE ESTIMATES & FORECAST, BY REGIONAL, 2019-2032
    252. (USD Billions)
    253. ESTIMATES & FORECAST, BY EVENT TYPE, 2019-2032 (USD Billions)
    254. Argentina Live Streaming Pay Per View Market SIZE ESTIMATES & FORECAST, BY PLATFORM,
    255. 2032 (USD Billions)
    256. Market SIZE ESTIMATES & FORECAST, BY PRICING MODEL, 2019-2032 (USD Billions)
    257. FORECAST, BY AUDIENCE TYPE, 2019-2032 (USD Billions)
    258. Live Streaming Pay Per View Market SIZE ESTIMATES & FORECAST, BY DEVICE TYPE,
    259. 2032 (USD Billions)
    260. Market SIZE ESTIMATES & FORECAST, BY REGIONAL, 2019-2032 (USD Billions)
    261. & FORECAST, BY EVENT TYPE, 2019-2032 (USD Billions)
    262. South America Live Streaming Pay Per View Market SIZE ESTIMATES & FORECAST,
    263. BY PLATFORM, 2019-2032 (USD Billions)
    264. Streaming Pay Per View Market SIZE ESTIMATES & FORECAST, BY PRICING MODEL, 2019-2032
    265. (USD Billions)
    266. Market SIZE ESTIMATES & FORECAST, BY AUDIENCE TYPE, 2019-2032 (USD Billions)
    267. & FORECAST, BY DEVICE TYPE, 2019-2032 (USD Billions)
    268. South America Live Streaming Pay Per View Market SIZE ESTIMATES & FORECAST,
    269. BY REGIONAL, 2019-2032 (USD Billions)
    270. View Market SIZE ESTIMATES & FORECAST, BY EVENT TYPE, 2019-2032 (USD Billions)
    271. BY PLATFORM, 2019-2032 (USD Billions)
    272. View Market SIZE ESTIMATES & FORECAST, BY PRICING MODEL, 2019-2032 (USD Billions)
    273. BY AUDIENCE TYPE, 2019-2032 (USD Billions)
    274. Per View Market SIZE ESTIMATES & FORECAST, BY DEVICE TYPE, 2019-2032 (USD Billions)
    275. BY REGIONAL, 2019-2032 (USD Billions)
    276. Pay Per View Market SIZE ESTIMATES & FORECAST, BY EVENT TYPE, 2019-2032 (USD
    277. Billions)
    278. ESTIMATES & FORECAST, BY PLATFORM, 2019-2032 (USD Billions)
    279. GCC Countries Live Streaming Pay Per View Market SIZE ESTIMATES & FORECAST,
    280. BY PRICING MODEL, 2019-2032 (USD Billions)
    281. Pay Per View Market SIZE ESTIMATES & FORECAST, BY AUDIENCE TYPE, 2019-2032 (USD
    282. Billions)
    283. ESTIMATES & FORECAST, BY DEVICE TYPE, 2019-2032 (USD Billions)
    284. GCC Countries Live Streaming Pay Per View Market SIZE ESTIMATES & FORECAST,
    285. BY REGIONAL, 2019-2032 (USD Billions)
    286. Pay Per View Market SIZE ESTIMATES & FORECAST, BY EVENT TYPE, 2019-2032 (USD
    287. Billions)
    288. ESTIMATES & FORECAST, BY PLATFORM, 2019-2032 (USD Billions)
    289. South Africa Live Streaming Pay Per View Market SIZE ESTIMATES & FORECAST, BY
    290. PRICING MODEL, 2019-2032 (USD Billions)
    291. Pay Per View Market SIZE ESTIMATES & FORECAST, BY AUDIENCE TYPE, 2019-2032 (USD
    292. Billions)
    293. ESTIMATES & FORECAST, BY DEVICE TYPE, 2019-2032 (USD Billions)
    294. South Africa Live Streaming Pay Per View Market SIZE ESTIMATES & FORECAST, BY
    295. REGIONAL, 2019-2032 (USD Billions)
    296. Per View Market SIZE ESTIMATES & FORECAST, BY EVENT TYPE, 2019-2032 (USD Billions)
    297. FORECAST, BY PLATFORM, 2019-2032 (USD Billions)
    298. Streaming Pay Per View Market SIZE ESTIMATES & FORECAST, BY PRICING MODEL, 2019-2032
    299. (USD Billions)
    300. ESTIMATES & FORECAST, BY AUDIENCE TYPE, 2019-2032 (USD Billions)
    301. Rest of MEA Live Streaming Pay Per View Market SIZE ESTIMATES & FORECAST,
    302. BY DEVICE TYPE, 2019-2032 (USD Billions)
    303. Pay Per View Market SIZE ESTIMATES & FORECAST, BY REGIONAL, 2019-2032 (USD Billions)
    304. NORTH AMERICA LIVE STREAMING PAY PER VIEW MARKET ANALYSIS
    305. LIVE STREAMING PAY PER VIEW MARKET ANALYSIS BY EVENT TYPE
    306. STREAMING PAY PER VIEW MARKET ANALYSIS BY PLATFORM
    307. PAY PER VIEW MARKET ANALYSIS BY PRICING MODEL
    308. PAY PER VIEW MARKET ANALYSIS BY AUDIENCE TYPE
    309. PAY PER VIEW MARKET ANALYSIS BY DEVICE TYPE
    310. PER VIEW MARKET ANALYSIS BY REGIONAL
    311. VIEW MARKET ANALYSIS BY EVENT TYPE
    312. VIEW MARKET ANALYSIS BY PLATFORM
    313. VIEW MARKET ANALYSIS BY PRICING MODEL
    314. PER VIEW MARKET ANALYSIS BY AUDIENCE TYPE
    315. PAY PER VIEW MARKET ANALYSIS BY DEVICE TYPE
    316. PAY PER VIEW MARKET ANALYSIS BY REGIONAL
    317. PAY PER VIEW MARKET ANALYSIS
    318. MARKET ANALYSIS BY EVENT TYPE
    319. MARKET ANALYSIS BY PLATFORM
    320. MARKET ANALYSIS BY PRICING MODEL
    321. VIEW MARKET ANALYSIS BY AUDIENCE TYPE
    322. PER VIEW MARKET ANALYSIS BY DEVICE TYPE
    323. PAY PER VIEW MARKET ANALYSIS BY REGIONAL
    324. PER VIEW MARKET ANALYSIS BY EVENT TYPE
    325. VIEW MARKET ANALYSIS BY PLATFORM
    326. MARKET ANALYSIS BY PRICING MODEL
    327. MARKET ANALYSIS BY AUDIENCE TYPE
    328. MARKET ANALYSIS BY DEVICE TYPE
    329. ANALYSIS BY REGIONAL
    330. ANALYSIS BY EVENT TYPE
    331. ANALYSIS BY PLATFORM
    332. ANALYSIS BY PRICING MODEL
    333. ANALYSIS BY AUDIENCE TYPE
    334. ANALYSIS BY DEVICE TYPE
    335. ANALYSIS BY REGIONAL
    336. ANALYSIS BY EVENT TYPE
    337. ANALYSIS BY PLATFORM
    338. ANALYSIS BY PRICING MODEL
    339. ANALYSIS BY AUDIENCE TYPE
    340. ANALYSIS BY DEVICE TYPE
    341. ANALYSIS BY REGIONAL
    342. BY EVENT TYPE
    343. BY PLATFORM
    344. PRICING MODEL
    345. BY AUDIENCE TYPE
    346. BY DEVICE TYPE
    347. BY REGIONAL
    348. EVENT TYPE
    349. PLATFORM
    350. MODEL
    351. TYPE
    352. TYPE
    353. TYPE
    354. BY PLATFORM
    355. BY PRICING MODEL
    356. ANALYSIS BY AUDIENCE TYPE
    357. VIEW MARKET ANALYSIS BY DEVICE TYPE
    358. PAY PER VIEW MARKET ANALYSIS BY REGIONAL
    359. PER VIEW MARKET ANALYSIS
    360. ANALYSIS BY EVENT TYPE
    361. ANALYSIS BY PLATFORM
    362. BY PRICING MODEL
    363. BY AUDIENCE TYPE
    364. BY DEVICE TYPE
    365. BY REGIONAL
    366. EVENT TYPE
    367. PLATFORM
    368. MODEL
    369. TYPE
    370. TYPE
    371. MODEL
    372. AUDIENCE TYPE
    373. BY DEVICE TYPE
    374. BY REGIONAL
    375. BY EVENT TYPE
    376. BY PLATFORM
    377. BY PRICING MODEL
    378. BY AUDIENCE TYPE
    379. BY DEVICE TYPE
    380. BY REGIONAL
    381. BY EVENT TYPE
    382. BY PLATFORM
    383. BY PRICING MODEL
    384. BY AUDIENCE TYPE
    385. BY DEVICE TYPE
    386. BY REGIONAL
    387. BY EVENT TYPE
    388. BY PLATFORM
    389. BY PRICING MODEL
    390. BY AUDIENCE TYPE
    391. BY DEVICE TYPE
    392. BY REGIONAL
    393. BY EVENT TYPE
    394. ANALYSIS BY PLATFORM
    395. MARKET ANALYSIS BY PRICING MODEL
    396. PER VIEW MARKET ANALYSIS BY AUDIENCE TYPE
    397. PAY PER VIEW MARKET ANALYSIS BY DEVICE TYPE
    398. STREAMING PAY PER VIEW MARKET ANALYSIS BY REGIONAL
    399. LIVE STREAMING PAY PER VIEW MARKET ANALYSIS
    400. PAY PER VIEW MARKET ANALYSIS BY EVENT TYPE
    401. PAY PER VIEW MARKET ANALYSIS BY PLATFORM
    402. PAY PER VIEW MARKET ANALYSIS BY PRICING MODEL
    403. PAY PER VIEW MARKET ANALYSIS BY AUDIENCE TYPE
    404. PAY PER VIEW MARKET ANALYSIS BY DEVICE TYPE
    405. PAY PER VIEW MARKET ANALYSIS BY REGIONAL
    406. PAY PER VIEW MARKET ANALYSIS BY EVENT TYPE
    407. PAY PER VIEW MARKET ANALYSIS BY PLATFORM
    408. PAY PER VIEW MARKET ANALYSIS BY PRICING MODEL
    409. PAY PER VIEW MARKET ANALYSIS BY AUDIENCE TYPE
    410. PAY PER VIEW MARKET ANALYSIS BY DEVICE TYPE
    411. PAY PER VIEW MARKET ANALYSIS BY REGIONAL
    412. PAY PER VIEW MARKET ANALYSIS BY EVENT TYPE
    413. PAY PER VIEW MARKET ANALYSIS BY PLATFORM
    414. PAY PER VIEW MARKET ANALYSIS BY PRICING MODEL
    415. PAY PER VIEW MARKET ANALYSIS BY AUDIENCE TYPE
    416. PAY PER VIEW MARKET ANALYSIS BY DEVICE TYPE
    417. PAY PER VIEW MARKET ANALYSIS BY REGIONAL
    418. LIVE STREAMING PAY PER VIEW MARKET ANALYSIS BY EVENT TYPE
    419. OF SOUTH AMERICA LIVE STREAMING PAY PER VIEW MARKET ANALYSIS BY PLATFORM
    420. REST OF SOUTH AMERICA LIVE STREAMING PAY PER VIEW MARKET ANALYSIS BY PRICING
    421. MODEL
    422. ANALYSIS BY AUDIENCE TYPE
    423. PAY PER VIEW MARKET ANALYSIS BY DEVICE TYPE
    424. LIVE STREAMING PAY PER VIEW MARKET ANALYSIS BY REGIONAL
    425. STREAMING PAY PER VIEW MARKET ANALYSIS
    426. PAY PER VIEW MARKET ANALYSIS BY EVENT TYPE
    427. STREAMING PAY PER VIEW MARKET ANALYSIS BY PLATFORM
    428. LIVE STREAMING PAY PER VIEW MARKET ANALYSIS BY PRICING MODEL
    429. COUNTRIES LIVE STREAMING PAY PER VIEW MARKET ANALYSIS BY AUDIENCE TYPE
    430. GCC COUNTRIES LIVE STREAMING PAY PER VIEW MARKET ANALYSIS BY DEVICE TYPE
    431. TYPE
    432. BY PLATFORM
    433. BY PRICING MODEL
    434. ANALYSIS BY AUDIENCE TYPE
    435. VIEW MARKET ANALYSIS BY DEVICE TYPE
    436. PAY PER VIEW MARKET ANALYSIS BY REGIONAL
    437. PAY PER VIEW MARKET ANALYSIS BY EVENT TYPE
    438. PAY PER VIEW MARKET ANALYSIS BY PLATFORM
    439. PAY PER VIEW MARKET ANALYSIS BY PRICING MODEL
    440. STREAMING PAY PER VIEW MARKET ANALYSIS BY AUDIENCE TYPE
    441. MEA LIVE STREAMING PAY PER VIEW MARKET ANALYSIS BY DEVICE TYPE
    442. REST OF MEA LIVE STREAMING PAY PER VIEW MARKET ANALYSIS BY REGIONAL
    443. KEY BUYING CRITERIA OF LIVE STREAMING PAY PER VIEW MARKET
    444. RESEARCH PROCESS OF MRFR
    445. VIEW MARKET
    446. MARKET
    447. MARKET
    448. (USD Billions)
    449. (% SHARE)
    450. TO 2032 (USD Billions)
    451. BY PRICING MODEL, 2024 (% SHARE)
    452. BY PRICING MODEL, 2019 TO 2032 (USD Billions)
    453. PER VIEW MARKET, BY AUDIENCE TYPE, 2024 (% SHARE)
    454. PAY PER VIEW MARKET, BY AUDIENCE TYPE, 2019 TO 2032 (USD Billions)
    455. LIVE STREAMING PAY PER VIEW MARKET, BY DEVICE TYPE, 2024 (% SHARE)
    456. LIVE STREAMING PAY PER VIEW MARKET, BY DEVICE TYPE, 2019 TO 2032 (USD Billions)
    457. (USD Billions)

    Live Streaming Pay Per View Market Segmentation


    • Live Streaming Pay Per View Market By Event Type (USD Billion, 2019-2032)

      • Sports
      • Concerts
      • Theatre
      • Conferences
      • Online Gaming


    • Live Streaming Pay Per View Market By Platform (USD Billion, 2019-2032)

      • OTT Platforms
      • Social Media Platforms
      • Dedicated Streaming Services
      • Cable and Satellite Providers
      • Telco Providers


    • Live Streaming Pay Per View Market By Pricing Model (USD Billion, 2019-2032)

      • Pay-Per-View
      • Subscription-Based
      • Tiered Pricing
      • Bundled Packages
      • Advertising-Supported


    • Live Streaming Pay Per View Market By Audience Type (USD Billion, 2019-2032)

      • Individual Consumers
      • Businesses
      • Educational Institutions
      • Non-Profit Organizations
      • Government Agencies


    • Live Streaming Pay Per View Market By Device Type (USD Billion, 2019-2032)

      • Smartphones
      • Tablets
      • Laptops
      • Desktops
      • Connected TVs


    • Live Streaming Pay Per View Market By Regional (USD Billion, 2019-2032)

      • North America
      • Europe
      • South America
      • Asia Pacific
      • Middle East and Africa


    Live Streaming Pay Per View Market Regional Outlook (USD Billion, 2019-2032)


    • North America Outlook (USD Billion, 2019-2032)

      • North America Live Streaming Pay Per View Market by Event Type

        • Sports
        • Concerts
        • Theatre
        • Conferences
        • Online Gaming
      • North America Live Streaming Pay Per View Market by Platform Type

        • OTT Platforms
        • Social Media Platforms
        • Dedicated Streaming Services
        • Cable and Satellite Providers
        • Telco Providers
      • North America Live Streaming Pay Per View Market by Pricing Model Type

        • Pay-Per-View
        • Subscription-Based
        • Tiered Pricing
        • Bundled Packages
        • Advertising-Supported
      • North America Live Streaming Pay Per View Market by Audience Type

        • Individual Consumers
        • Businesses
        • Educational Institutions
        • Non-Profit Organizations
        • Government Agencies
      • North America Live Streaming Pay Per View Market by Device Type

        • Smartphones
        • Tablets
        • Laptops
        • Desktops
        • Connected TVs
      • North America Live Streaming Pay Per View Market by Regional Type

        • US
        • Canada
      • US Outlook (USD Billion, 2019-2032)
      • US Live Streaming Pay Per View Market by Event Type

        • Sports
        • Concerts
        • Theatre
        • Conferences
        • Online Gaming
      • US Live Streaming Pay Per View Market by Platform Type

        • OTT Platforms
        • Social Media Platforms
        • Dedicated Streaming Services
        • Cable and Satellite Providers
        • Telco Providers
      • US Live Streaming Pay Per View Market by Pricing Model Type

        • Pay-Per-View
        • Subscription-Based
        • Tiered Pricing
        • Bundled Packages
        • Advertising-Supported
      • US Live Streaming Pay Per View Market by Audience Type

        • Individual Consumers
        • Businesses
        • Educational Institutions
        • Non-Profit Organizations
        • Government Agencies
      • US Live Streaming Pay Per View Market by Device Type

        • Smartphones
        • Tablets
        • Laptops
        • Desktops
        • Connected TVs
      • CANADA Outlook (USD Billion, 2019-2032)
      • CANADA Live Streaming Pay Per View Market by Event Type

        • Sports
        • Concerts
        • Theatre
        • Conferences
        • Online Gaming
      • CANADA Live Streaming Pay Per View Market by Platform Type

        • OTT Platforms
        • Social Media Platforms
        • Dedicated Streaming Services
        • Cable and Satellite Providers
        • Telco Providers
      • CANADA Live Streaming Pay Per View Market by Pricing Model Type

        • Pay-Per-View
        • Subscription-Based
        • Tiered Pricing
        • Bundled Packages
        • Advertising-Supported
      • CANADA Live Streaming Pay Per View Market by Audience Type

        • Individual Consumers
        • Businesses
        • Educational Institutions
        • Non-Profit Organizations
        • Government Agencies
      • CANADA Live Streaming Pay Per View Market by Device Type

        • Smartphones
        • Tablets
        • Laptops
        • Desktops
        • Connected TVs
    • Europe Outlook (USD Billion, 2019-2032)

      • Europe Live Streaming Pay Per View Market by Event Type

        • Sports
        • Concerts
        • Theatre
        • Conferences
        • Online Gaming
      • Europe Live Streaming Pay Per View Market by Platform Type

        • OTT Platforms
        • Social Media Platforms
        • Dedicated Streaming Services
        • Cable and Satellite Providers
        • Telco Providers
      • Europe Live Streaming Pay Per View Market by Pricing Model Type

        • Pay-Per-View
        • Subscription-Based
        • Tiered Pricing
        • Bundled Packages
        • Advertising-Supported
      • Europe Live Streaming Pay Per View Market by Audience Type

        • Individual Consumers
        • Businesses
        • Educational Institutions
        • Non-Profit Organizations
        • Government Agencies
      • Europe Live Streaming Pay Per View Market by Device Type

        • Smartphones
        • Tablets
        • Laptops
        • Desktops
        • Connected TVs
      • Europe Live Streaming Pay Per View Market by Regional Type

        • Germany
        • UK
        • France
        • Russia
        • Italy
        • Spain
        • Rest of Europe
      • GERMANY Outlook (USD Billion, 2019-2032)
      • GERMANY Live Streaming Pay Per View Market by Event Type

        • Sports
        • Concerts
        • Theatre
        • Conferences
        • Online Gaming
      • GERMANY Live Streaming Pay Per View Market by Platform Type

        • OTT Platforms
        • Social Media Platforms
        • Dedicated Streaming Services
        • Cable and Satellite Providers
        • Telco Providers
      • GERMANY Live Streaming Pay Per View Market by Pricing Model Type

        • Pay-Per-View
        • Subscription-Based
        • Tiered Pricing
        • Bundled Packages
        • Advertising-Supported
      • GERMANY Live Streaming Pay Per View Market by Audience Type

        • Individual Consumers
        • Businesses
        • Educational Institutions
        • Non-Profit Organizations
        • Government Agencies
      • GERMANY Live Streaming Pay Per View Market by Device Type

        • Smartphones
        • Tablets
        • Laptops
        • Desktops
        • Connected TVs
      • UK Outlook (USD Billion, 2019-2032)
      • UK Live Streaming Pay Per View Market by Event Type

        • Sports
        • Concerts
        • Theatre
        • Conferences
        • Online Gaming
      • UK Live Streaming Pay Per View Market by Platform Type

        • OTT Platforms
        • Social Media Platforms
        • Dedicated Streaming Services
        • Cable and Satellite Providers
        • Telco Providers
      • UK Live Streaming Pay Per View Market by Pricing Model Type

        • Pay-Per-View
        • Subscription-Based
        • Tiered Pricing
        • Bundled Packages
        • Advertising-Supported
      • UK Live Streaming Pay Per View Market by Audience Type

        • Individual Consumers
        • Businesses
        • Educational Institutions
        • Non-Profit Organizations
        • Government Agencies
      • UK Live Streaming Pay Per View Market by Device Type

        • Smartphones
        • Tablets
        • Laptops
        • Desktops
        • Connected TVs
      • FRANCE Outlook (USD Billion, 2019-2032)
      • FRANCE Live Streaming Pay Per View Market by Event Type

        • Sports
        • Concerts
        • Theatre
        • Conferences
        • Online Gaming
      • FRANCE Live Streaming Pay Per View Market by Platform Type

        • OTT Platforms
        • Social Media Platforms
        • Dedicated Streaming Services
        • Cable and Satellite Providers
        • Telco Providers
      • FRANCE Live Streaming Pay Per View Market by Pricing Model Type

        • Pay-Per-View
        • Subscription-Based
        • Tiered Pricing
        • Bundled Packages
        • Advertising-Supported
      • FRANCE Live Streaming Pay Per View Market by Audience Type

        • Individual Consumers
        • Businesses
        • Educational Institutions
        • Non-Profit Organizations
        • Government Agencies
      • FRANCE Live Streaming Pay Per View Market by Device Type

        • Smartphones
        • Tablets
        • Laptops
        • Desktops
        • Connected TVs
      • RUSSIA Outlook (USD Billion, 2019-2032)
      • RUSSIA Live Streaming Pay Per View Market by Event Type

        • Sports
        • Concerts
        • Theatre
        • Conferences
        • Online Gaming
      • RUSSIA Live Streaming Pay Per View Market by Platform Type

        • OTT Platforms
        • Social Media Platforms
        • Dedicated Streaming Services
        • Cable and Satellite Providers
        • Telco Providers
      • RUSSIA Live Streaming Pay Per View Market by Pricing Model Type

        • Pay-Per-View
        • Subscription-Based
        • Tiered Pricing
        • Bundled Packages
        • Advertising-Supported
      • RUSSIA Live Streaming Pay Per View Market by Audience Type

        • Individual Consumers
        • Businesses
        • Educational Institutions
        • Non-Profit Organizations
        • Government Agencies
      • RUSSIA Live Streaming Pay Per View Market by Device Type

        • Smartphones
        • Tablets
        • Laptops
        • Desktops
        • Connected TVs
      • ITALY Outlook (USD Billion, 2019-2032)
      • ITALY Live Streaming Pay Per View Market by Event Type

        • Sports
        • Concerts
        • Theatre
        • Conferences
        • Online Gaming
      • ITALY Live Streaming Pay Per View Market by Platform Type

        • OTT Platforms
        • Social Media Platforms
        • Dedicated Streaming Services
        • Cable and Satellite Providers
        • Telco Providers
      • ITALY Live Streaming Pay Per View Market by Pricing Model Type

        • Pay-Per-View
        • Subscription-Based
        • Tiered Pricing
        • Bundled Packages
        • Advertising-Supported
      • ITALY Live Streaming Pay Per View Market by Audience Type

        • Individual Consumers
        • Businesses
        • Educational Institutions
        • Non-Profit Organizations
        • Government Agencies
      • ITALY Live Streaming Pay Per View Market by Device Type

        • Smartphones
        • Tablets
        • Laptops
        • Desktops
        • Connected TVs
      • SPAIN Outlook (USD Billion, 2019-2032)
      • SPAIN Live Streaming Pay Per View Market by Event Type

        • Sports
        • Concerts
        • Theatre
        • Conferences
        • Online Gaming
      • SPAIN Live Streaming Pay Per View Market by Platform Type

        • OTT Platforms
        • Social Media Platforms
        • Dedicated Streaming Services
        • Cable and Satellite Providers
        • Telco Providers
      • SPAIN Live Streaming Pay Per View Market by Pricing Model Type

        • Pay-Per-View
        • Subscription-Based
        • Tiered Pricing
        • Bundled Packages
        • Advertising-Supported
      • SPAIN Live Streaming Pay Per View Market by Audience Type

        • Individual Consumers
        • Businesses
        • Educational Institutions
        • Non-Profit Organizations
        • Government Agencies
      • SPAIN Live Streaming Pay Per View Market by Device Type

        • Smartphones
        • Tablets
        • Laptops
        • Desktops
        • Connected TVs
      • REST OF EUROPE Outlook (USD Billion, 2019-2032)
      • REST OF EUROPE Live Streaming Pay Per View Market by Event Type

        • Sports
        • Concerts
        • Theatre
        • Conferences
        • Online Gaming
      • REST OF EUROPE Live Streaming Pay Per View Market by Platform Type

        • OTT Platforms
        • Social Media Platforms
        • Dedicated Streaming Services
        • Cable and Satellite Providers
        • Telco Providers
      • REST OF EUROPE Live Streaming Pay Per View Market by Pricing Model Type

        • Pay-Per-View
        • Subscription-Based
        • Tiered Pricing
        • Bundled Packages
        • Advertising-Supported
      • REST OF EUROPE Live Streaming Pay Per View Market by Audience Type

        • Individual Consumers
        • Businesses
        • Educational Institutions
        • Non-Profit Organizations
        • Government Agencies
      • REST OF EUROPE Live Streaming Pay Per View Market by Device Type

        • Smartphones
        • Tablets
        • Laptops
        • Desktops
        • Connected TVs
    • APAC Outlook (USD Billion, 2019-2032)

      • APAC Live Streaming Pay Per View Market by Event Type

        • Sports
        • Concerts
        • Theatre
        • Conferences
        • Online Gaming
      • APAC Live Streaming Pay Per View Market by Platform Type

        • OTT Platforms
        • Social Media Platforms
        • Dedicated Streaming Services
        • Cable and Satellite Providers
        • Telco Providers
      • APAC Live Streaming Pay Per View Market by Pricing Model Type

        • Pay-Per-View
        • Subscription-Based
        • Tiered Pricing
        • Bundled Packages
        • Advertising-Supported
      • APAC Live Streaming Pay Per View Market by Audience Type

        • Individual Consumers
        • Businesses
        • Educational Institutions
        • Non-Profit Organizations
        • Government Agencies
      • APAC Live Streaming Pay Per View Market by Device Type

        • Smartphones
        • Tablets
        • Laptops
        • Desktops
        • Connected TVs
      • APAC Live Streaming Pay Per View Market by Regional Type

        • China
        • India
        • Japan
        • South Korea
        • Malaysia
        • Thailand
        • Indonesia
        • Rest of APAC
      • CHINA Outlook (USD Billion, 2019-2032)
      • CHINA Live Streaming Pay Per View Market by Event Type

        • Sports
        • Concerts
        • Theatre
        • Conferences
        • Online Gaming
      • CHINA Live Streaming Pay Per View Market by Platform Type

        • OTT Platforms
        • Social Media Platforms
        • Dedicated Streaming Services
        • Cable and Satellite Providers
        • Telco Providers
      • CHINA Live Streaming Pay Per View Market by Pricing Model Type

        • Pay-Per-View
        • Subscription-Based
        • Tiered Pricing
        • Bundled Packages
        • Advertising-Supported
      • CHINA Live Streaming Pay Per View Market by Audience Type

        • Individual Consumers
        • Businesses
        • Educational Institutions
        • Non-Profit Organizations
        • Government Agencies
      • CHINA Live Streaming Pay Per View Market by Device Type

        • Smartphones
        • Tablets
        • Laptops
        • Desktops
        • Connected TVs
      • INDIA Outlook (USD Billion, 2019-2032)
      • INDIA Live Streaming Pay Per View Market by Event Type

        • Sports
        • Concerts
        • Theatre
        • Conferences
        • Online Gaming
      • INDIA Live Streaming Pay Per View Market by Platform Type

        • OTT Platforms
        • Social Media Platforms
        • Dedicated Streaming Services
        • Cable and Satellite Providers
        • Telco Providers
      • INDIA Live Streaming Pay Per View Market by Pricing Model Type

        • Pay-Per-View
        • Subscription-Based
        • Tiered Pricing
        • Bundled Packages
        • Advertising-Supported
      • INDIA Live Streaming Pay Per View Market by Audience Type

        • Individual Consumers
        • Businesses
        • Educational Institutions
        • Non-Profit Organizations
        • Government Agencies
      • INDIA Live Streaming Pay Per View Market by Device Type

        • Smartphones
        • Tablets
        • Laptops
        • Desktops
        • Connected TVs
      • JAPAN Outlook (USD Billion, 2019-2032)
      • JAPAN Live Streaming Pay Per View Market by Event Type

        • Sports
        • Concerts
        • Theatre
        • Conferences
        • Online Gaming
      • JAPAN Live Streaming Pay Per View Market by Platform Type

        • OTT Platforms
        • Social Media Platforms
        • Dedicated Streaming Services
        • Cable and Satellite Providers
        • Telco Providers
      • JAPAN Live Streaming Pay Per View Market by Pricing Model Type

        • Pay-Per-View
        • Subscription-Based
        • Tiered Pricing
        • Bundled Packages
        • Advertising-Supported
      • JAPAN Live Streaming Pay Per View Market by Audience Type

        • Individual Consumers
        • Businesses
        • Educational Institutions
        • Non-Profit Organizations
        • Government Agencies
      • JAPAN Live Streaming Pay Per View Market by Device Type

        • Smartphones
        • Tablets
        • Laptops
        • Desktops
        • Connected TVs
      • SOUTH KOREA Outlook (USD Billion, 2019-2032)
      • SOUTH KOREA Live Streaming Pay Per View Market by Event Type

        • Sports
        • Concerts
        • Theatre
        • Conferences
        • Online Gaming
      • SOUTH KOREA Live Streaming Pay Per View Market by Platform Type

        • OTT Platforms
        • Social Media Platforms
        • Dedicated Streaming Services
        • Cable and Satellite Providers
        • Telco Providers
      • SOUTH KOREA Live Streaming Pay Per View Market by Pricing Model Type

        • Pay-Per-View
        • Subscription-Based
        • Tiered Pricing
        • Bundled Packages
        • Advertising-Supported
      • SOUTH KOREA Live Streaming Pay Per View Market by Audience Type

        • Individual Consumers
        • Businesses
        • Educational Institutions
        • Non-Profit Organizations
        • Government Agencies
      • SOUTH KOREA Live Streaming Pay Per View Market by Device Type

        • Smartphones
        • Tablets
        • Laptops
        • Desktops
        • Connected TVs
      • MALAYSIA Outlook (USD Billion, 2019-2032)
      • MALAYSIA Live Streaming Pay Per View Market by Event Type

        • Sports
        • Concerts
        • Theatre
        • Conferences
        • Online Gaming
      • MALAYSIA Live Streaming Pay Per View Market by Platform Type

        • OTT Platforms
        • Social Media Platforms
        • Dedicated Streaming Services
        • Cable and Satellite Providers
        • Telco Providers
      • MALAYSIA Live Streaming Pay Per View Market by Pricing Model Type

        • Pay-Per-View
        • Subscription-Based
        • Tiered Pricing
        • Bundled Packages
        • Advertising-Supported
      • MALAYSIA Live Streaming Pay Per View Market by Audience Type

        • Individual Consumers
        • Businesses
        • Educational Institutions
        • Non-Profit Organizations
        • Government Agencies
      • MALAYSIA Live Streaming Pay Per View Market by Device Type

        • Smartphones
        • Tablets
        • Laptops
        • Desktops
        • Connected TVs
      • THAILAND Outlook (USD Billion, 2019-2032)
      • THAILAND Live Streaming Pay Per View Market by Event Type

        • Sports
        • Concerts
        • Theatre
        • Conferences
        • Online Gaming
      • THAILAND Live Streaming Pay Per View Market by Platform Type

        • OTT Platforms
        • Social Media Platforms
        • Dedicated Streaming Services
        • Cable and Satellite Providers
        • Telco Providers
      • THAILAND Live Streaming Pay Per View Market by Pricing Model Type

        • Pay-Per-View
        • Subscription-Based
        • Tiered Pricing
        • Bundled Packages
        • Advertising-Supported
      • THAILAND Live Streaming Pay Per View Market by Audience Type

        • Individual Consumers
        • Businesses
        • Educational Institutions
        • Non-Profit Organizations
        • Government Agencies
      • THAILAND Live Streaming Pay Per View Market by Device Type

        • Smartphones
        • Tablets
        • Laptops
        • Desktops
        • Connected TVs
      • INDONESIA Outlook (USD Billion, 2019-2032)
      • INDONESIA Live Streaming Pay Per View Market by Event Type

        • Sports
        • Concerts
        • Theatre
        • Conferences
        • Online Gaming
      • INDONESIA Live Streaming Pay Per View Market by Platform Type

        • OTT Platforms
        • Social Media Platforms
        • Dedicated Streaming Services
        • Cable and Satellite Providers
        • Telco Providers
      • INDONESIA Live Streaming Pay Per View Market by Pricing Model Type

        • Pay-Per-View
        • Subscription-Based
        • Tiered Pricing
        • Bundled Packages
        • Advertising-Supported
      • INDONESIA Live Streaming Pay Per View Market by Audience Type

        • Individual Consumers
        • Businesses
        • Educational Institutions
        • Non-Profit Organizations
        • Government Agencies
      • INDONESIA Live Streaming Pay Per View Market by Device Type

        • Smartphones
        • Tablets
        • Laptops
        • Desktops
        • Connected TVs
      • REST OF APAC Outlook (USD Billion, 2019-2032)
      • REST OF APAC Live Streaming Pay Per View Market by Event Type

        • Sports
        • Concerts
        • Theatre
        • Conferences
        • Online Gaming
      • REST OF APAC Live Streaming Pay Per View Market by Platform Type

        • OTT Platforms
        • Social Media Platforms
        • Dedicated Streaming Services
        • Cable and Satellite Providers
        • Telco Providers
      • REST OF APAC Live Streaming Pay Per View Market by Pricing Model Type

        • Pay-Per-View
        • Subscription-Based
        • Tiered Pricing
        • Bundled Packages
        • Advertising-Supported
      • REST OF APAC Live Streaming Pay Per View Market by Audience Type

        • Individual Consumers
        • Businesses
        • Educational Institutions
        • Non-Profit Organizations
        • Government Agencies
      • REST OF APAC Live Streaming Pay Per View Market by Device Type

        • Smartphones
        • Tablets
        • Laptops
        • Desktops
        • Connected TVs
    • South America Outlook (USD Billion, 2019-2032)

      • South America Live Streaming Pay Per View Market by Event Type

        • Sports
        • Concerts
        • Theatre
        • Conferences
        • Online Gaming
      • South America Live Streaming Pay Per View Market by Platform Type

        • OTT Platforms
        • Social Media Platforms
        • Dedicated Streaming Services
        • Cable and Satellite Providers
        • Telco Providers
      • South America Live Streaming Pay Per View Market by Pricing Model Type

        • Pay-Per-View
        • Subscription-Based
        • Tiered Pricing
        • Bundled Packages
        • Advertising-Supported
      • South America Live Streaming Pay Per View Market by Audience Type

        • Individual Consumers
        • Businesses
        • Educational Institutions
        • Non-Profit Organizations
        • Government Agencies
      • South America Live Streaming Pay Per View Market by Device Type

        • Smartphones
        • Tablets
        • Laptops
        • Desktops
        • Connected TVs
      • South America Live Streaming Pay Per View Market by Regional Type

        • Brazil
        • Mexico
        • Argentina
        • Rest of South America
      • BRAZIL Outlook (USD Billion, 2019-2032)
      • BRAZIL Live Streaming Pay Per View Market by Event Type

        • Sports
        • Concerts
        • Theatre
        • Conferences
        • Online Gaming
      • BRAZIL Live Streaming Pay Per View Market by Platform Type

        • OTT Platforms
        • Social Media Platforms
        • Dedicated Streaming Services
        • Cable and Satellite Providers
        • Telco Providers
      • BRAZIL Live Streaming Pay Per View Market by Pricing Model Type

        • Pay-Per-View
        • Subscription-Based
        • Tiered Pricing
        • Bundled Packages
        • Advertising-Supported
      • BRAZIL Live Streaming Pay Per View Market by Audience Type

        • Individual Consumers
        • Businesses
        • Educational Institutions
        • Non-Profit Organizations
        • Government Agencies
      • BRAZIL Live Streaming Pay Per View Market by Device Type

        • Smartphones
        • Tablets
        • Laptops
        • Desktops
        • Connected TVs
      • MEXICO Outlook (USD Billion, 2019-2032)
      • MEXICO Live Streaming Pay Per View Market by Event Type

        • Sports
        • Concerts
        • Theatre
        • Conferences
        • Online Gaming
      • MEXICO Live Streaming Pay Per View Market by Platform Type

        • OTT Platforms
        • Social Media Platforms
        • Dedicated Streaming Services
        • Cable and Satellite Providers
        • Telco Providers
      • MEXICO Live Streaming Pay Per View Market by Pricing Model Type

        • Pay-Per-View
        • Subscription-Based
        • Tiered Pricing
        • Bundled Packages
        • Advertising-Supported
      • MEXICO Live Streaming Pay Per View Market by Audience Type

        • Individual Consumers
        • Businesses
        • Educational Institutions
        • Non-Profit Organizations
        • Government Agencies
      • MEXICO Live Streaming Pay Per View Market by Device Type

        • Smartphones
        • Tablets
        • Laptops
        • Desktops
        • Connected TVs
      • ARGENTINA Outlook (USD Billion, 2019-2032)
      • ARGENTINA Live Streaming Pay Per View Market by Event Type

        • Sports
        • Concerts
        • Theatre
        • Conferences
        • Online Gaming
      • ARGENTINA Live Streaming Pay Per View Market by Platform Type

        • OTT Platforms
        • Social Media Platforms
        • Dedicated Streaming Services
        • Cable and Satellite Providers
        • Telco Providers
      • ARGENTINA Live Streaming Pay Per View Market by Pricing Model Type

        • Pay-Per-View
        • Subscription-Based
        • Tiered Pricing
        • Bundled Packages
        • Advertising-Supported
      • ARGENTINA Live Streaming Pay Per View Market by Audience Type

        • Individual Consumers
        • Businesses
        • Educational Institutions
        • Non-Profit Organizations
        • Government Agencies
      • ARGENTINA Live Streaming Pay Per View Market by Device Type

        • Smartphones
        • Tablets
        • Laptops
        • Desktops
        • Connected TVs
      • REST OF SOUTH AMERICA Outlook (USD Billion, 2019-2032)
      • REST OF SOUTH AMERICA Live Streaming Pay Per View Market by Event Type

        • Sports
        • Concerts
        • Theatre
        • Conferences
        • Online Gaming
      • REST OF SOUTH AMERICA Live Streaming Pay Per View Market by Platform Type

        • OTT Platforms
        • Social Media Platforms
        • Dedicated Streaming Services
        • Cable and Satellite Providers
        • Telco Providers
      • REST OF SOUTH AMERICA Live Streaming Pay Per View Market by Pricing Model Type

        • Pay-Per-View
        • Subscription-Based
        • Tiered Pricing
        • Bundled Packages
        • Advertising-Supported
      • REST OF SOUTH AMERICA Live Streaming Pay Per View Market by Audience Type

        • Individual Consumers
        • Businesses
        • Educational Institutions
        • Non-Profit Organizations
        • Government Agencies
      • REST OF SOUTH AMERICA Live Streaming Pay Per View Market by Device Type

        • Smartphones
        • Tablets
        • Laptops
        • Desktops
        • Connected TVs
    • MEA Outlook (USD Billion, 2019-2032)

      • MEA Live Streaming Pay Per View Market by Event Type

        • Sports
        • Concerts
        • Theatre
        • Conferences
        • Online Gaming
      • MEA Live Streaming Pay Per View Market by Platform Type

        • OTT Platforms
        • Social Media Platforms
        • Dedicated Streaming Services
        • Cable and Satellite Providers
        • Telco Providers
      • MEA Live Streaming Pay Per View Market by Pricing Model Type

        • Pay-Per-View
        • Subscription-Based
        • Tiered Pricing
        • Bundled Packages
        • Advertising-Supported
      • MEA Live Streaming Pay Per View Market by Audience Type

        • Individual Consumers
        • Businesses
        • Educational Institutions
        • Non-Profit Organizations
        • Government Agencies
      • MEA Live Streaming Pay Per View Market by Device Type

        • Smartphones
        • Tablets
        • Laptops
        • Desktops
        • Connected TVs
      • MEA Live Streaming Pay Per View Market by Regional Type

        • GCC Countries
        • South Africa
        • Rest of MEA
      • GCC COUNTRIES Outlook (USD Billion, 2019-2032)
      • GCC COUNTRIES Live Streaming Pay Per View Market by Event Type

        • Sports
        • Concerts
        • Theatre
        • Conferences
        • Online Gaming
      • GCC COUNTRIES Live Streaming Pay Per View Market by Platform Type

        • OTT Platforms
        • Social Media Platforms
        • Dedicated Streaming Services
        • Cable and Satellite Providers
        • Telco Providers
      • GCC COUNTRIES Live Streaming Pay Per View Market by Pricing Model Type

        • Pay-Per-View
        • Subscription-Based
        • Tiered Pricing
        • Bundled Packages
        • Advertising-Supported
      • GCC COUNTRIES Live Streaming Pay Per View Market by Audience Type

        • Individual Consumers
        • Businesses
        • Educational Institutions
        • Non-Profit Organizations
        • Government Agencies
      • GCC COUNTRIES Live Streaming Pay Per View Market by Device Type

        • Smartphones
        • Tablets
        • Laptops
        • Desktops
        • Connected TVs
      • SOUTH AFRICA Outlook (USD Billion, 2019-2032)
      • SOUTH AFRICA Live Streaming Pay Per View Market by Event Type

        • Sports
        • Concerts
        • Theatre
        • Conferences
        • Online Gaming
      • SOUTH AFRICA Live Streaming Pay Per View Market by Platform Type

        • OTT Platforms
        • Social Media Platforms
        • Dedicated Streaming Services
        • Cable and Satellite Providers
        • Telco Providers
      • SOUTH AFRICA Live Streaming Pay Per View Market by Pricing Model Type

        • Pay-Per-View
        • Subscription-Based
        • Tiered Pricing
        • Bundled Packages
        • Advertising-Supported
      • SOUTH AFRICA Live Streaming Pay Per View Market by Audience Type

        • Individual Consumers
        • Businesses
        • Educational Institutions
        • Non-Profit Organizations
        • Government Agencies
      • SOUTH AFRICA Live Streaming Pay Per View Market by Device Type

        • Smartphones
        • Tablets
        • Laptops
        • Desktops
        • Connected TVs
      • REST OF MEA Outlook (USD Billion, 2019-2032)
      • REST OF MEA Live Streaming Pay Per View Market by Event Type

        • Sports
        • Concerts
        • Theatre
        • Conferences
        • Online Gaming
      • REST OF MEA Live Streaming Pay Per View Market by Platform Type

        • OTT Platforms
        • Social Media Platforms
        • Dedicated Streaming Services
        • Cable and Satellite Providers
        • Telco Providers
      • REST OF MEA Live Streaming Pay Per View Market by Pricing Model Type

        • Pay-Per-View
        • Subscription-Based
        • Tiered Pricing
        • Bundled Packages
        • Advertising-Supported
      • REST OF MEA Live Streaming Pay Per View Market by Audience Type

        • Individual Consumers
        • Businesses
        • Educational Institutions
        • Non-Profit Organizations
        • Government Agencies
      • REST OF MEA Live Streaming Pay Per View Market by Device Type

        • Smartphones
        • Tablets
        • Laptops
        • Desktops
        • Connected TVs


    Report Infographic
    Free Sample Request

    Kindly complete the form below to receive a free sample of this Report

    Customer Strories

    “I am very pleased with how market segments have been defined in a relevant way for my purposes (such as "Portable Freezers & refrigerators" and "last-mile"). In general the report is well structured. Thanks very much for your efforts.”

    Victoria Milne Founder
    Case Study

    Chemicals and Materials