Vehicle Rear Seat Infotainments Market (2026 - 2035)

ID: MRFR/AT/7255-CR 164 Pages Triveni Bhoyar Last Updated: October 16, 2026
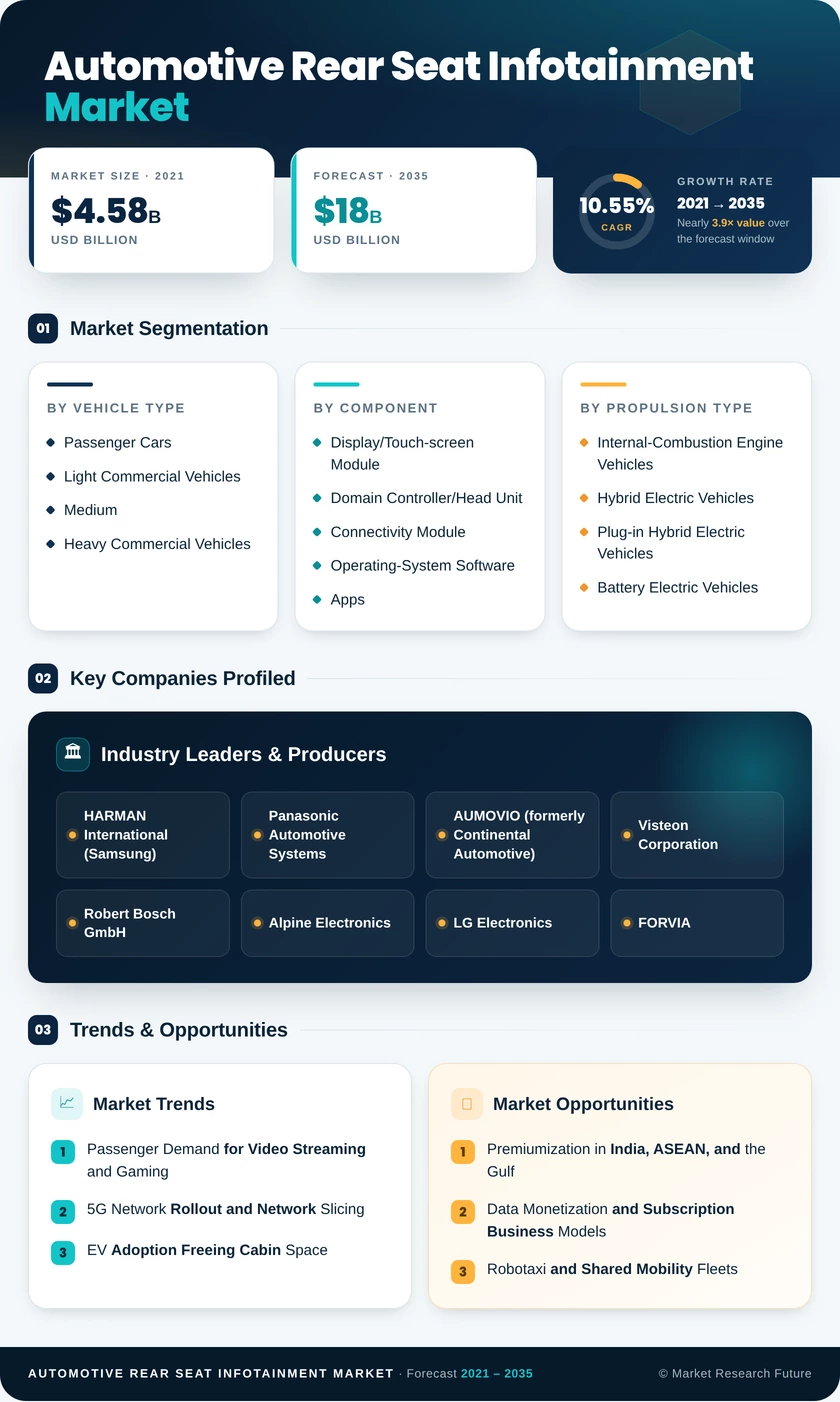
Automotive Rear Seat Infotainment Market Research Report By Vehicle Type (Passenger Cars, Light Commercial Vehicles, Medium and Heavy Commercial Vehicles), By Component (Display/Touch-screen Module, Domain Controller/Head Unit, Connectivity Module, Operating-System Software and Apps), By Propulsion Type (Internal-Combustion Engine Vehicles, Hybrid Electric Vehicles, Plug-in Hybrid Electric Vehicles, Battery Electric Vehicles), By Connectivity Generation (3G and Below, 4G LTE, 5G), By Operating System (Linux-Based, Android Automotive OS, QNX, Others), By Sales Channel (OEM-Installed, Aftermarket) - Forecast to 2035
Vehicle Rear Seat Infotainments Market
Market Size
Forecast Period2026-2035
CAGR (2026-2035)10.55%
2025 Market SizeUSD 6.60 Billion
2035 Market SizeUSD 18.00 billion
Key Players
HARMAN International
Panasonic Automotive Systems
AUMOVIO
Visteon Corporation
Robert Bosch GmbH
Alpine Electronics
Opportunities
  • Premiumization in India, ASEAN, and the Gulf
  • Data Monetization and Subscription Business Models
  • Robotaxi and Shared Mobility Fleets
  1. 1 Market Summary | |
  2. 2 Key Report Takeaways | |
    1. 2.1 By Vehicle Type | |
    2. 2.2 By Component | |
    3. 2.3 By Propulsion Type | |
    4. 2.4 By Connectivity Generation | |
    5. 2.5 By Operating System | |
    6. 2.6 By Sales Channel | |
    7. 2.7 By Region | |
  3. 3 Market Size and Forecast (2021–2035) | |
  4. 4 Driver Impact Analysis | |
    1. 4.1 Passenger Demand for Video Streaming and Gaming | |
    2. 4.2 5G Network Rollout and Network Slicing | |
    3. 4.3 EV Adoption Freeing Cabin Space | |
    4. 4.4 Software-Defined Vehicles and OTA Monetization | |
    5. 4.5 Premium MPV and SUV Mix in China | |
    6. 4.6 Falling Display and Semiconductor Costs | |
    7. 4.7 Autonomous Ride-Hailing Fleets | |
  5. 5 Restraints Impact Analysis | |
    1. 5.1 High System Cost in Mass-Market Segments | |
    2. 5.2 Smartphone and Tablet Substitution | |
    3. 5.3 Cybersecurity Compliance Costs | |
    4. 5.4 Tariffs and Component Supply Volatility | |
    5. 5.5 Driver Distraction and Safety Scrutiny | |
  6. 6 Opportunities | |
    1. 6.1 Premiumization in India, ASEAN, and the Gulf | |
    2. 6.2 Data Monetization and Subscription Business Models | |
    3. 6.3 Robotaxi and Shared Mobility Fleets | |
    4. 6.4 Aftermarket Retrofits After Network Sunsets | |
    5. 6.5 Generative AI Assistants and Cloud Gaming | |
  7. 7 Regional Market Share and Country-Level Analysis | |
    1. 7.1 North America | | |
      1. 7.1.1 US | | |
      2. 7.1.2 Canada | | |
      3. 7.1.3 Mexico | |
    2. 7.2 Europe | | |
      1. 7.2.1 Germany | | |
      2. 7.2.2 UK | | |
      3. 7.2.3 France | | |
      4. 7.2.4 Italy | | |
      5. 7.2.5 Spain | | |
      6. 7.2.6 Nordic Countries | | |
      7. 7.2.7 Russia | | |
      8. 7.2.8 Rest of Europe | |
    3. 7.3 Asia-Pacific | | |
      1. 7.3.1 China | | |
      2. 7.3.2 India | | |
      3. 7.3.3 Japan | | |
      4. 7.3.4 South Korea | | |
      5. 7.3.5 ASEAN | | |
      6. 7.3.6 Rest of Asia-Pacific | |
    4. 7.4 South America | | |
      1. 7.4.1 Brazil | | |
      2. 7.4.2 Argentina | | |
      3. 7.4.3 Rest of South America | |
    5. 7.5 Middle East & Africa | | |
      1. 7.5.1 Saudi Arabia | | |
      2. 7.5.2 UAE | | |
      3. 7.5.3 South Africa | | |
      4. 7.5.4 Egypt | | |
      5. 7.5.5 Rest of MEA | |
  8. 8 Future Outlook (2026–2035) | |
    1. 8.1 AI-Native Cabins and Autonomy | |
    2. 8.2 Platform Economics and App Stores | |
    3. 8.3 Electrification Supercycle | |
    4. 8.4 Sustainability and Circular Electronics | |
  9. 9 Segmentation Analysis | |
    1. 9.1 By Vehicle Type | | |
      1. 9.1.1 Passenger Cars | | |
      2. 9.1.2 Light Commercial Vehicles | | |
      3. 9.1.3 Medium and Heavy Commercial Vehicles | |
    2. 9.2 By Component | | |
      1. 9.2.1 Display/Touch-screen Module | | |
      2. 9.2.2 Domain Controller/Head Unit | | |
      3. 9.2.3 Connectivity Module | | |
      4. 9.2.4 Operating-System Software and Apps | |
    3. 9.3 By Propulsion Type | | |
      1. 9.3.1 Internal-Combustion Engine Vehicles | | |
      2. 9.3.2 Hybrid Electric Vehicles | | |
      3. 9.3.3 Plug-in Hybrid Electric Vehicles | | |
      4. 9.3.4 Battery Electric Vehicles | |
    4. 9.4 By Connectivity Generation | | |
      1. 9.4.1 3G and Below | | |
      2. 9.4.2 4G LTE | | |
      3. 9.4.3 5G | |
    5. 9.5 By Operating System | | |
      1. 9.5.1 Linux-Based | | |
      2. 9.5.2 Android Automotive OS | | |
      3. 9.5.3 QNX | | |
      4. 9.5.4 Others | |
    6. 9.6 By Sales Channel | | |
      1. 9.6.1 OEM-Installed | | |
      2. 9.6.2 Aftermarket | |
  10. 10 Competitive Landscape | |
    1. 10.1 Market Concentration Analysis | |
    2. 10.2 Competitive Benchmarking Table | |
  11. 11 Recent News & Developments | |
  12. 12 Report Scope and Methodology | |
  13. 13 Detailed Sources and Citations | |
  14. 14 Frequently Asked Questions (FAQs) | | LIST OF TABLES | |
  15. TABLE 1 Global Market Summary, 2025–2035 | |
  16. TABLE 2 Global Market Size and Forecast, 2021–2035 (USD Billion) | |
  17. TABLE 3 Driver Impact Analysis | |
  18. TABLE 4 Restraints Impact Analysis | |
  19. TABLE 5 Regional Summary, 2025 | |
  20. TABLE 6 North America Country-Level Analysis, 2025 | |
  21. TABLE 7 Europe Country-Level Analysis, 2025 | |
  22. TABLE 8 Asia-Pacific Country-Level Analysis, 2025 | |
  23. TABLE 9 South America Country-Level Analysis, 2025 | |
  24. TABLE 10 Middle East & Africa Country-Level Analysis, 2025 | |
  25. TABLE 11 Segmentation by Vehicle Type, 2025 | |
  26. TABLE 12 Segmentation by Component, 2025 | |
  27. TABLE 13 Segmentation by Propulsion Type, 2025 | |
  28. TABLE 14 Segmentation by Connectivity Generation, 2025 | |
  29. TABLE 15 Segmentation by Operating System, 2025 | |
  30. TABLE 16 Segmentation by Sales Channel, 2025 | |
  31. TABLE 17 Competitive Benchmarking Table | |
  32. TABLE 18 Report Scope and Methodology | |
  33. TABLE 19 Detailed Sources and Citations | |
  34. TABLE 20 Segmentation Quick Reference | | LIST OF FIGURES | |
  35. FIGURE 1 Market Dynamics Overview (Drivers, Restraints, Opportunities) | |
  36. FIGURE 2 Industry Value Chain Analysis | |
  37. FIGURE 3 Porter's Five Forces Analysis | |
  38. FIGURE 4 Global Market Size Trend, 2021–2035 (USD Billion) | |
  39. FIGURE 5 Share by Vehicle Type, 2025 | |
  40. FIGURE 6 Share by Component, 2025 | |
  41. FIGURE 7 Share by Propulsion Type, 2025 | |
  42. FIGURE 8 Share by Connectivity Generation, 2025 | |
  43. FIGURE 9 Share by Operating System, 2025 | |
  44. FIGURE 10 Share by Sales Channel, 2025 | |
  45. FIGURE 11 Regional Share, 2025 | |
  46. FIGURE 12 Competitive Landscape Positioning Matrix

Segmentation Quick Reference

DimensionSub-SegmentsDominant SegmentFastest Growing Segment
By Vehicle TypePassenger Cars, Light Commercial Vehicles, Medium and Heavy Commercial VehiclesPassenger Cars (69.8% share)Light Commercial Vehicles (11.9% CAGR)
By ComponentDisplay/Touch-screen Module, Domain Controller/Head Unit, Connectivity Module, Operating-System Software and AppsDisplay/Touch-screen Module (45.2% share)Operating-System Software and Apps (13.2% CAGR)
By Propulsion TypeInternal-Combustion Engine Vehicles, Hybrid Electric Vehicles, Plug-in Hybrid Electric Vehicles, Battery Electric VehiclesInternal-Combustion Engine Vehicles (61.0% share)Battery Electric Vehicles (21.7% CAGR)
By Connectivity Generation3G and Below, 4G LTE, 5G4G LTE (57.0% share)5G (25.4% CAGR)
By Operating SystemLinux-Based, Android Automotive OS, QNX, OthersLinux-Based (43.2% share)Android Automotive OS (12.9% CAGR)
By Sales ChannelOEM-Installed, AftermarketOEM-Installed (81.6% share)Aftermarket (11.8% CAGR)
By RegionNorth America, Europe, Asia-Pacific, South America, Middle East & AfricaAsia-Pacific (40.5% share)Middle East & Africa (13.4% CAGR)


Market Segmentation Overview

By Vehicle Type

Sub-SegmentKey Trend
Passenger CarsDual rear screens moving into mid-range SUVs
Light Commercial VehiclesScreens added to shuttles and ride-hailing vans
Medium and Heavy Commercial VehiclesSelective fitment in coaches and sleeper cabs


Passenger Cars lead because three-row SUVs and MPVs carry families who value screens on long trips, and scale economies keep per-unit costs falling. Light Commercial Vehicles grow fastest as shuttle and ride-hailing operators use rear displays for advertising and passenger comfort. Medium and Heavy Commercial Vehicles stay a niche, limited by cost and safety priorities.

By Component

Sub-SegmentKey Trend
Display/Touch-screen ModuleLarger OLED panels at lower cost per inch
Domain Controller/Head UnitOne controller driving front and rear screens
Connectivity Module5G modems replacing 4G in new platforms
Operating-System Software and AppsOTA-delivered app packs and subscriptions


The Display/Touch-screen Module leads component revenue because panels remain the most expensive physical element of a rear system. Operating-System Software and Apps grows fastest as OTA-capable controllers let OEMs add paid features after sale. Domain Controller/Head Unit integration reduces wiring and supports this software layer.

By Propulsion Type

Sub-SegmentKey Trend
Internal-Combustion Engine VehiclesLarge installed production base, slowing growth
Hybrid Electric VehiclesPremium features without range anxiety
Plug-in Hybrid Electric VehiclesExtended-range SUVs with screen-rich cabins
Battery Electric VehiclesFlat floors enabling larger rear displays


Internal-Combustion Engine Vehicles lead on volume from their large production base. Battery Electric Vehicles grow fastest because flat battery floors free cabin space for larger screens and charging stops create passenger downtime. Plug-in Hybrid Electric Vehicles also expand quickly through Chinese extended-range SUVs.

By Connectivity Generation

Sub-SegmentKey Trend
3G and BelowDeclining under network sunsets
4G LTEMature coverage for streaming and telematics
5GNetwork slicing for cloud gaming and multi-stream video


4G LTE leads because its modems are proven, affordable, and supported by near-universal coverage. 5G grows fastest as carriers densify networks and offer automotive slices with the latency needed for cloud gaming. 3G and Below continues to shrink as sunsets strand legacy hardware.

By Operating System

Sub-SegmentKey Trend
Linux-BasedAutomotive Grade Linux adoption among OEMs
Android Automotive OSAccess to Google services and app libraries
QNXSafety-certified mixed-criticality deployments
OthersProprietary RTOS in legacy platforms


Linux-Based platforms lead because OEMs want control over their software stack and customer data. Android Automotive OS grows fastest thanks to a familiar interface and ready app libraries that cut development time. QNX holds ground where rear systems share hardware with safety-critical functions.

By Sales Channel

Sub-SegmentKey Trend
OEM-InstalledDeep integration with vehicle audio, climate, and OTA
AftermarketRetrofits driven by fleet refresh and network sunsets


OEM-Installed systems lead because factory integration delivers zone audio, climate control, and OTA updates that retrofits cannot replicate. The Aftermarket grows faster from a smaller base, supported by fleet refresh cycles, network sunsets, and cost-conscious buyers in emerging markets.




Download PDF ×

We do not share your information with anyone. However, we may send you emails based on your report interest from time to time. You may contact us at any time to opt-out.