Over the Air Update (OTA) Market (2026 - 2035)

ID: MRFR/AT/6137-CR 196 Pages Shubham Munde Last Updated: November 07, 2026
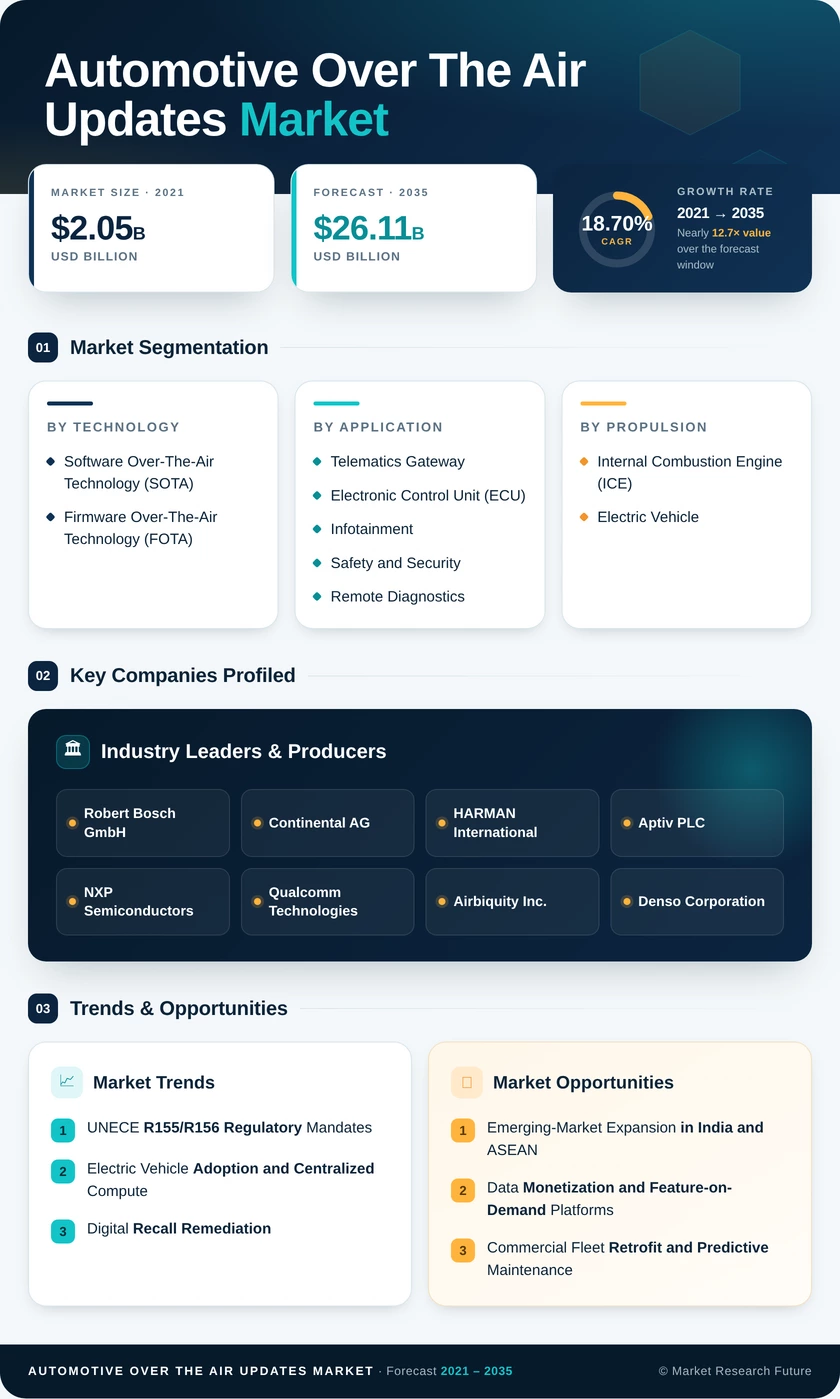
Over the Air Update (OTA) Market Research Report By Technology (Software Over-The-Air Technology (SOTA), Firmware Over-The-Air Technology (FOTA)), By Application (Telematics Gateway, Electronic Control Unit (ECU), Infotainment, Safety and Security, Remote Diagnostics), By Propulsion (Internal Combustion Engine (ICE), Electric Vehicle), By Vehicle Type (Passenger Cars, Commercial Vehicles), By Communication Type (Cellular, Wi-Fi, Satellite) - Forecast to 2035
Over the Air Update (OTA) Market
Market Size
Forecast Period2026-2035
CAGR (2026-2035)18.70%
2025 Market SizeUSD 4.63 Billion
2035 Market SizeUSD 26.11 billion
Key Players
Robert Bosch GmbH
Continental AG
HARMAN International
Aptiv PLC
NXP Semiconductors
Qualcomm Technologies
Opportunities
  • Emerging-Market Expansion in India and ASEAN
  • Data Monetization and Feature-on-Demand Platforms
  • Commercial Fleet Retrofit and Predictive Maintenance
  1. 1 Market Summary | |
  2. 2 Key Report Takeaways | |
    1. 2.1 By Technology | |
    2. 2.2 By Application | |
    3. 2.3 By Propulsion | |
    4. 2.4 By Vehicle Type | |
    5. 2.5 By Communication Type | |
    6. 2.6 By Region | |
  3. 3 Market Size and Forecast (2021–2035) | |
  4. 4 Driver Impact Analysis | |
    1. 4.1 UNECE R155/R156 Regulatory Mandates | |
    2. 4.2 Electric Vehicle Adoption and Centralized Compute | |
    3. 4.3 Digital Recall Remediation | |
    4. 4.4 Feature-on-Demand and Subscription Revenue | |
    5. 4.5 China National Software Update Standard | |
    6. 4.6 5G and C-V2X Network Rollout | |
  5. 5 Restraints Impact Analysis | |
    1. 5.1 Expanding Cybersecurity Attack Surface | |
    2. 5.2 Legacy ECU Fragmentation | |
    3. 5.3 Data Transfer Cost and Coverage Gaps | |
    4. 5.4 Cross-Border Connected Vehicle Restrictions | |
    5. 5.5 Consumer Resistance to Paid Features | |
  6. 6 Opportunities | |
    1. 6.1 Emerging-Market Expansion in India and ASEAN | |
    2. 6.2 Data Monetization and Feature-on-Demand Platforms | |
    3. 6.3 Commercial Fleet Retrofit and Predictive Maintenance | |
    4. 6.4 Satellite and Multi-Mode Delivery | |
    5. 6.5 Compliance-as-a-Service Tooling | |
  7. 7 Regional Market Share and Country-Level Analysis | |
    1. 7.1 North America | | |
      1. 7.1.1 US | | |
      2. 7.1.2 Canada | | |
      3. 7.1.3 Mexico | |
    2. 7.2 Europe | | |
      1. 7.2.1 Germany | | |
      2. 7.2.2 UK | | |
      3. 7.2.3 France | | |
      4. 7.2.4 Italy | | |
      5. 7.2.5 Spain | | |
      6. 7.2.6 Nordic Countries | | |
      7. 7.2.7 Russia | | |
      8. 7.2.8 Rest of Europe | |
    3. 7.3 Asia-Pacific | | |
      1. 7.3.1 China | | |
      2. 7.3.2 India | | |
      3. 7.3.3 Japan | | |
      4. 7.3.4 South Korea | | |
      5. 7.3.5 ASEAN | | |
      6. 7.3.6 Rest of Asia-Pacific | |
    4. 7.4 South America | | |
      1. 7.4.1 Brazil | | |
      2. 7.4.2 Argentina | | |
      3. 7.4.3 Rest of South America | |
    5. 7.5 Middle East & Africa | | |
      1. 7.5.1 Saudi Arabia | | |
      2. 7.5.2 UAE | | |
      3. 7.5.3 South Africa | | |
      4. 7.5.4 Egypt | | |
      5. 7.5.5 Rest of MEA | |
  8. 8 Future Outlook (2026–2035) | |
    1. 8.1 AI-Assisted Campaign Orchestration | |
    2. 8.2 Vehicle Operating System Consolidation | |
    3. 8.3 Electrification Supercycle | |
    4. 8.4 Lifecycle Cybersecurity and Regulatory Convergence | |
  9. 9 Segmentation Analysis | |
    1. 9.1 By Technology | | |
      1. 9.1.1 Software Over-The-Air Technology (SOTA) | | |
      2. 9.1.2 Firmware Over-The-Air Technology (FOTA) | |
    2. 9.2 By Application | | |
      1. 9.2.1 Telematics Gateway | | |
      2. 9.2.2 Electronic Control Unit (ECU) | | |
      3. 9.2.3 Infotainment | | |
      4. 9.2.4 Safety and Security | | |
      5. 9.2.5 Remote Diagnostics | |
    3. 9.3 By Propulsion | | |
      1. 9.3.1 Internal Combustion Engine (ICE) | | |
      2. 9.3.2 Electric Vehicle | |
    4. 9.4 By Vehicle Type | | |
      1. 9.4.1 Passenger Cars | | |
      2. 9.4.2 Commercial Vehicles | |
    5. 9.5 By Communication Type | | |
      1. 9.5.1 Cellular | | |
      2. 9.5.2 Wi-Fi | | |
      3. 9.5.3 Satellite | |
  10. 10 Competitive Landscape | |
  11. 11 Recent News & Developments | |
  12. 12 Report Scope and Methodology | |
  13. 13 Detailed Sources and Citations | |
  14. 14 Frequently Asked Questions (FAQs) | | LIST OF TABLES | |
  15. TABLE 1 Report Summary – Key Market Indicators | |
  16. TABLE 2 Global Market Size & Forecast, by Revenue (USD Billion), 2021–2035 | |
  17. TABLE 3 Driver Impact Analysis on CAGR, 2026–2035 | |
  18. TABLE 4 Restraints Impact Analysis on CAGR, 2026–2035 | |
  19. TABLE 5 Regional Summary, by Region, 2025 | |
  20. TABLE 6 North America – Country-Level Analysis | |
  21. TABLE 7 Europe – Country-Level Analysis | |
  22. TABLE 8 Asia-Pacific – Country-Level Analysis | |
  23. TABLE 9 South America – Country-Level Analysis | |
  24. TABLE 10 Middle East & Africa – Country-Level Analysis | |
  25. TABLE 11 Market Segmentation, by Technology | |
  26. TABLE 12 Market Segmentation, by Application | |
  27. TABLE 13 Market Segmentation, by Propulsion | |
  28. TABLE 14 Market Segmentation, by Vehicle Type | |
  29. TABLE 15 Market Segmentation, by Communication Type | |
  30. TABLE 16 Competitive Benchmarking Matrix | |
  31. TABLE 17 Report Scope and Methodology | |
  32. TABLE 18 Detailed Sources and Citations | | LIST OF FIGURES | |
  33. FIGURE 1 Market Dynamics – Drivers, Restraints, and Opportunities | |
  34. FIGURE 2 Industry Value Chain Analysis | |
  35. FIGURE 3 Porter's Five Forces Analysis | |
  36. FIGURE 4 Global Market Size Trend, 2021–2035 (USD Billion) | |
  37. FIGURE 5 Market Share, by Technology, 2025 | |
  38. FIGURE 6 Market Share, by Application, 2025 | |
  39. FIGURE 7 Market Share, by Propulsion, 2025 | |
  40. FIGURE 8 Market Share, by Vehicle Type, 2025 | |
  41. FIGURE 9 Market Share, by Communication Type, 2025 | |
  42. FIGURE 10 Regional Market Share, 2025 | |
  43. FIGURE 11 Asia-Pacific Growth Outlook, 2026–2035 | |
  44. FIGURE 12 Competitive Landscape – Estimated Revenue Share Ranges of Key Players

Segmentation Quick Reference

This reference summarizes the leading and fastest-growing segments of the Automotive Over The Air Updates Market across every dimension.

DimensionSub-SegmentsDominant SegmentFastest Growing Segment
By TechnologySoftware Over-The-Air Technology (SOTA), Firmware Over-The-Air Technology (FOTA)Software Over-The-Air Technology (SOTA) — 64.4% shareFirmware Over-The-Air Technology (FOTA) — 21.5% CAGR
By ApplicationTelematics Gateway, Electronic Control Unit (ECU), Infotainment, Safety and Security, Remote DiagnosticsTelematics Gateway — 34.3% shareSafety and Security — 20.2% CAGR
By PropulsionInternal Combustion Engine (ICE), Electric VehicleInternal Combustion Engine (ICE) — 70.9% shareElectric Vehicle — 26.0% CAGR
By Vehicle TypePassenger Cars, Commercial VehiclesPassenger Cars — 58.0% shareCommercial Vehicles — 20.9% CAGR
By Communication TypeCellular, Wi-Fi, SatelliteCellular — 66.5% shareSatellite — 23.8% CAGR
By RegionNorth America, Europe, Asia-Pacific, South America, Middle East & AfricaNorth America — 36.5% shareAsia-Pacific — 21.6% CAGR


Market Segmentation Overview

By Technology

Sub-SegmentKey Trend
Software Over-The-Air Technology (SOTA)Rapid infotainment and user-experience releases with lighter validation gates
Firmware Over-The-Air Technology (FOTA)Remote calibration of powertrain, battery, and chassis controllers


Software Over-The-Air Technology (SOTA) leads with a 64.4% share because infotainment and navigation code changes most often and carry limited safety risk. Firmware Over-The-Air Technology (FOTA) grows fastest at a 21.5% CAGR as zonal architectures make deep controllers reachable and ISO 24089 processes give OEMs a validated path for safety-relevant firmware. The two pathways are converging as containerization blurs the boundary between application and firmware layers.

By Application

Sub-SegmentKey Trend
Telematics GatewayIntrusion detection agents embedded at the vehicle's network edge
Electronic Control Unit (ECU)Consolidation into fewer, more powerful domain and zonal controllers
InfotainmentHigh update volume with low revenue per event
Safety and SecurityRegulatory pressure for rapid cyber patching and digital recalls
Remote DiagnosticsPredictive maintenance analytics for commercial fleets


Telematics Gateway holds the largest share at 34.3% because every package routes through it before reaching downstream controllers. Safety and Security grows fastest at a 20.2% CAGR, driven by R155 lifecycle obligations and regulators' acceptance of remote recall remedies. Infotainment keeps transaction counts high, but Safety and Security commands greater value per update.

By Propulsion

Sub-SegmentKey Trend
Internal Combustion Engine (ICE)Updates limited mostly to infotainment and telematics layers
Electric VehicleWhole-vehicle updates enabled by centralized compute


Internal Combustion Engine (ICE) vehicles lead with a 70.9% share on installed base, though fragmented legacy ECUs restrict full-vehicle campaigns. Electric Vehicle platforms grow fastest at a 26.0% CAGR because battery management and charging software require frequent recalibration, and centralized controllers accept complete images in one campaign.

By Vehicle Type

Sub-SegmentKey Trend
Passenger CarsSubscription bundles spreading from premium to mid-segment buyers
Commercial VehiclesDaily or weekly fleet updates tied to uptime and compliance


Passenger Cars lead with a 58.0% share, reflecting global volume and expanding feature-on-demand offers. Commercial Vehicles grow fastest at a 20.9% CAGR because fleet operators push more updates per vehicle, using predictive maintenance to protect uptime revenue. Electronic logging mandates have already placed update-capable telematics in most heavy trucks.

By Communication Type

Sub-SegmentKey Trend
Cellular5G shortening campaign windows for large packages
Wi-FiLow-cost bulk downloads at homes, depots, and dealerships
SatelliteLow-earth-orbit links serving vehicles beyond terrestrial coverage


Cellular leads with a 66.5% share, supported by 4G/5G coverage across urban and highway corridors. Satellite grows fastest at a 23.8% CAGR as falling constellation costs make direct delivery viable for mining, agricultural, and long-haul vehicles. Wi-Fi complements both by offloading large, non-urgent packages when vehicles are parked.


 

Download PDF ×

We do not share your information with anyone. However, we may send you emails based on your report interest from time to time. You may contact us at any time to opt-out.