Automotive Composites Market Segmentation
Automotive Composites Market By Fiber Type (USD Billion, 2025-2035)
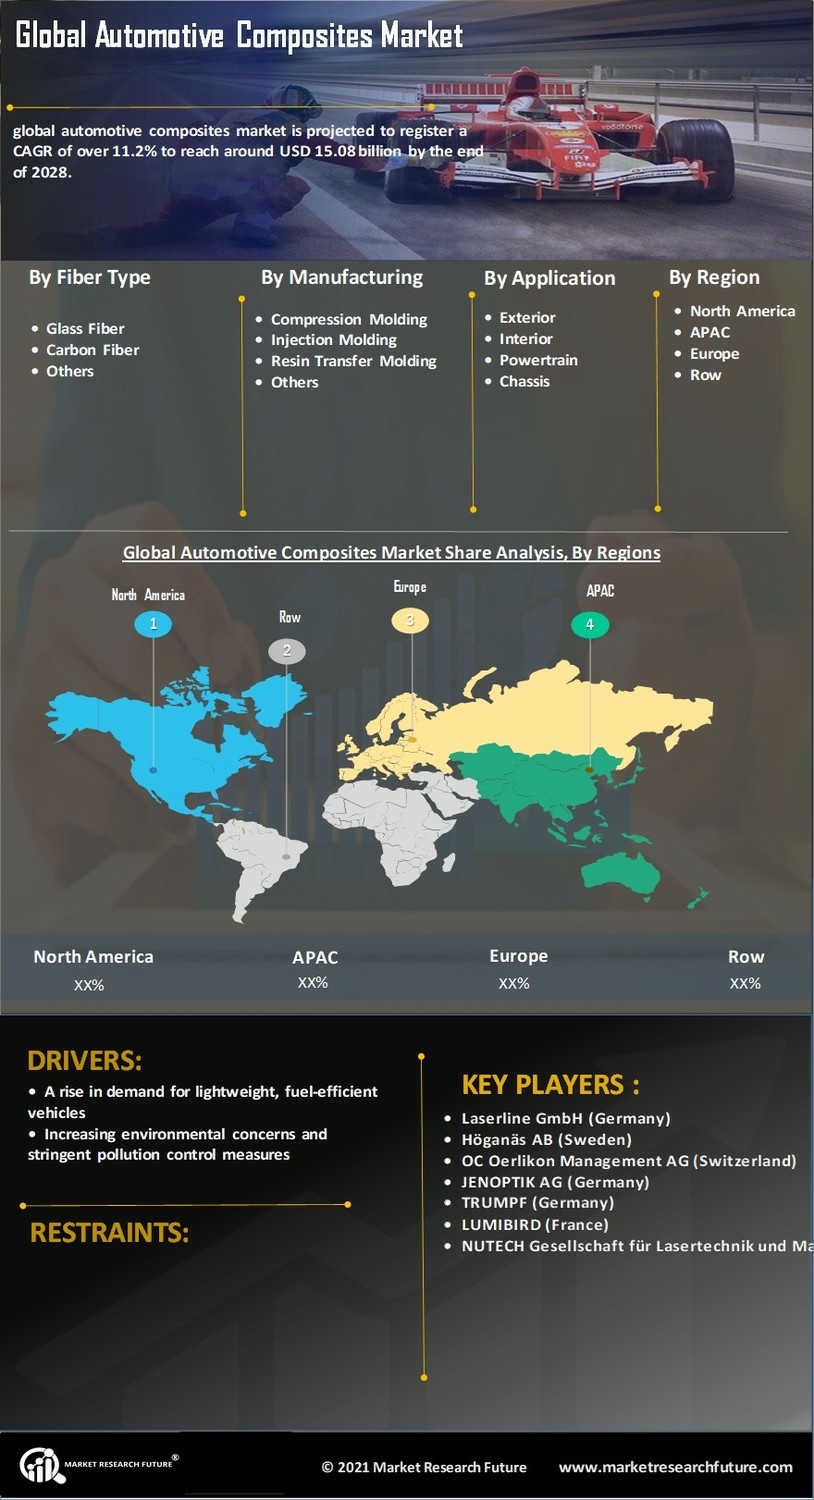
- Glass Fiber
- Carbon Fiber
Automotive Composites Market By Manufacturing Process (USD Billion, 2025-2035)
- Compression Molding
- Injection Molding
- Resin Transfer Molding
Automotive Composites Market By Application (USD Billion, 2025-2035)
- Exterior
- Interior
- Powertrain