Automotive Aluminum Market Segmentation
Automotive Aluminum Market By Type (USD Billion, 2025-2035)
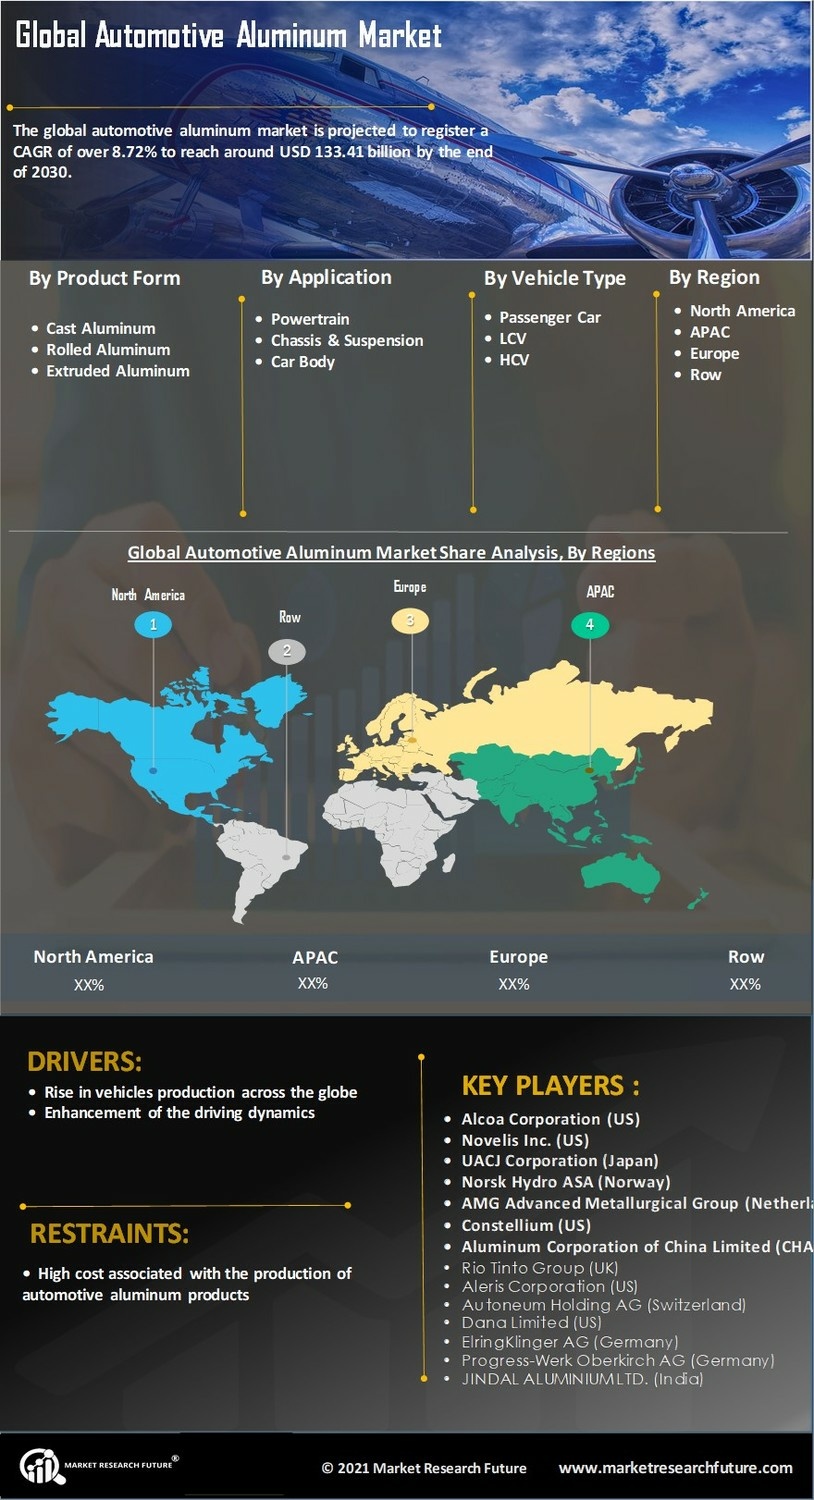
- Cast Aluminum
- Rolled Aluminum
- Extruded Aluminum
Automotive Aluminum Market By Application (USD Billion, 2025-2035)
- Powertrain
- Chassis & Suspension
- Car Body
Automotive Aluminum Market By Vehicle Type (USD Billion, 2025-2035)
- Passenger Car
- LCV
- HCV