ID: MRFR/AM/9244-HCR | August 2022 | Region: Global | 188 Pages
TABLE OF CONTENTS
1. EXECUTIVE SUMMARY
1.1. Market Attractiveness Analysis
1.1.1. Global Automotive NVH Materials Market, by Product Form
1.1.2. Global Automotive NVH Materials Market, by Vehicle Type
1.1.3. Global Automotive NVH Materials Market, by Application
1.1.4. Global Active Ingredients Market, by Region
2. MARKET INTRODUCTION
2.1. Definition
2.2. Scope of the Study
2.3. Market Structure
3. RESEARCH METHODOLOGY
3.1. Research Process
3.2. Primary Research
3.3. Secondary Research
3.4. Market Size Estimation
3.5. Forecast Model
3.6. List of Assumptions & Assumptions
4. MARKET FACTOR ANALYSIS
4.1.1. Introduction
4.1.2. Drivers
4.1.3. Restraints
4.1.4. Opportunities
4.1.5. Challenges
4.1.6. Trends
5. MARKET DYNAMICS
5.1. Supply Chain Analysis
5.2. Raw Material Suppliers
5.3. Automotive Aluminum Manufacturers
5.4. Distribution & Sales Channel
5.5. End Users
5.6. Porterβs Five Forces Model
5.7. Bargaining Power of Suppliers
5.8. Bargaining Power of Buyers
5.9. Threat of New Entrants
5.10. Threat of Substitutes
5.11. Intensity of Rivalry
5.12. Pricing Analysis (USD/Tons), by Region
5.13. Impact of COVID-19 on the Global Automotive NVH Materials Market
6. GLOBAL AUTOMOTIVE NVH MATERIALS MARKET, BY PRODUCT FORM
6.1. Introduction
6.2. Cast Aluminum
6.2.1. Market Estimates & Forecast, by Region/ Country, 2018β2028
6.3. Rolled Aluminum
6.3.1. Market Estimates & Forecast, by Region/ Country, 2018β2028
6.4. Extruded Aluminum
6.4.1. Market Estimates & Forecast, by Region/ Country, 2018β2028
7. GLOBAL AUTOMOTIVE NVH MATERIALS MARKET, BY VEHICLE TYPE
7.1. Introduction
7.2. Passenger Cars
7.2.1. Market Estimates & Forecast, by Region/ Country, 2018β2028
7.3. Light Commercial Vehicles (LCV)
7.3.1. Market Estimates & Forecast, by Region/ Country, 2018β2028
7.4. Heavy Commercial Vehicles (HCV)
7.4.1. Market Estimates & Forecast, by Region/ Country, 2018β2028
8. GLOBAL AUTOMOTIVE NVH MATERIALS MARKET, BY APPLICATION
8.1. Introduction
8.2. Powertrain
8.2.1. Market Estimates & Forecast, by Region/ Country, 2018β2028
8.3. Chassis & Suspension
8.3.1. Market Estimates & Forecast, by Region/ Country, 2018β2028
8.4. Car Body
8.4.1. Market Estimates & Forecast, by Region/ Country, 2018β2028
9. GLOBAL AUTOMOTIVE NVH MATERIALS MARKET, BY REGION
9.1. Overview
9.2. North America
9.2.1. US
9.2.2. Canada
9.2.3. Mexico
9.3. Europe
9.3.1. Germany
9.3.2. UK
9.3.3. France
9.3.4. Spain
9.3.5. Italy
9.3.6. Rest of Europe
9.4. Asia-Pacific
9.4.1. China
9.4.2. Japan
9.4.3. India
9.4.4. South Korea
9.4.5. Australia
9.4.6. Rest of Asia-Pacific
9.5. Rest of the World
9.5.1. Middle East
9.5.2. Africa
9.5.3. South America
10. COMPETITIVE LANDSCAPE
10.1.1. Market Introduction
10.1.2. Recent Developments
10.1.3. Mergers/Acquisitions, Expansion, Investment, Partnership, Collaboration, Product Launch
10.1.4. Global Market Strategy Analysis
10.1.5. Competitive Benchmarking
11. COMPANY PROFILES
11.1. Alcoa Corporation (US)
11.1.1. Company Overview
11.1.2. Financial Overview
11.1.3. Software/Solutions Offered
11.1.4. Key Developments
11.1.5. SWOT Analysis
11.1.6. Key Strategies
11.2. Novelis Inc. (US)
11.2.1. Company Overview
11.2.2. Financial Overview
11.2.3. Software/Solutions Offered
11.2.4. Key Developments
11.2.5. SWOT Analysis
11.2.6. Key Strategies
11.3. UACJ Corporation (Japan)
11.3.1. Company Overview
11.3.2. Financial Overview
11.3.3. Software/Solutions Offered
11.3.4. Key Developments
11.3.5. SWOT Analysis
11.3.6. Key Strategies
11.4. Norsk Hydro ASA (Norway)
11.4.1. Company Overview
11.4.2. Financial Overview
11.4.3. Software/Solutions Offered
11.4.4. Key Developments
11.4.5. SWOT Analysis
11.4.6. Key Strategies
11.5. AMG Advanced Metallurgical Group (Netherlands)
11.5.1. Company Overview
11.5.2. Financial Overview
11.5.3. Software/Solutions Offered
11.5.4. Key Developments
11.5.5. SWOT Analysis
11.5.6. Key Strategies
11.6. Constellium (US)
11.6.1. Company Overview
11.6.2. Financial Overview
11.6.3. Software/Solutions Offered
11.6.4. Key Developments
11.6.5. SWOT Analysis
11.6.6. Key Strategies
11.7. Aluminum Corporation of China Limited (CHALCO) (China)
11.7.1. Company Overview
11.7.2. Financial Overview
11.7.3. Software/Solutions Offered
11.7.4. Key Developments
11.7.5. SWOT Analysis
11.7.6. Key Strategies
11.8. Rio Tinto Group (UK)
11.8.1. Company Overview
11.8.2. Financial Overview
11.8.3. Software/Solutions Offered
11.8.4. Key Developments
11.8.5. SWOT Analysis
11.8.6. Key Strategies
11.9. Aleris Corporation (US)
11.9.1. Company Overview
11.9.2. Financial Overview
11.9.3. Software/Solutions Offered
11.9.4. Key Developments
11.9.5. SWOT Analysis
11.9.6. Key Strategies
11.10. Autoneum Holding AG (Switzerland)
11.10.1. Company Overview
11.10.2. Financial Overview
11.10.3. Software/Solutions Offered
11.10.4. Key Developments
11.10.5. SWOT Analysis
11.10.6. Key Strategies
11.11. Dana Limited (US)
11.11.1. Company Overview
11.11.2. Financial Overview
11.11.3. Software/Solutions Offered
11.11.4. Key Developments
11.11.5. SWOT Analysis
11.11.6. Key Strategies
11.12. ElringKlinger AG (Germany)
11.12.1. Company Overview
11.12.2. Financial Overview
11.12.3. Software/Solutions Offered
11.12.4. Key Developments
11.12.5. SWOT Analysis
11.12.6. Key Strategies
11.13. Progress-Werk Oberkirch AG (Germany)
11.13.1. Company Overview
11.13.2. Financial Overview
11.13.3. Software/Solutions Offered
11.13.4. Key Developments
11.13.5. SWOT Analysis
11.13.6. Key Strategies
11.14. JINDAL ALUMINIUM LTD. (India)
11.14.1. Company Overview
11.14.2. Financial Overview
11.14.3. Software/Solutions Offered
11.14.4. Key Developments
11.14.5. SWOT Analysis
11.14.6. Key Strategies
11.15. Kaiser Aluminum (US)
11.15.1. Company Overview
11.15.2. Financial Overview
11.15.3. Software/Solutions Offered
11.15.4. Key Developments
11.15.5. SWOT Analysis
11.15.6. Key Strategies
12. APPENDIX
12.1. Discussion Blueprint
LIST OF TABLES
TABLE 1 GLOBAL AUTOMOTIVE ALUMINUM MARKET, BY PRODUCT FORM, 2018β2028 (USD BILLION)
TABLE 2 GLOBAL AUTOMOTIVE ALUMINUM MARKET, BY VEHICLE TYPE, 2018β2028 (USD BILLION)
TABLE 3 GLOBAL AUTOMOTIVE ALUMINUM MARKET, BY APPLICATION, 2018β2028 (USD BILLION)
TABLE 4 GLOBAL AUTOMOTIVE ALUMINUM MARKET, BY REGION, 2018β2028 (USD BILLION)
TABLE 5 NORTH AMERICA AUTOMOTIVE ALUMINUM MARKET, BY COUNTRY, 2018β2028 (USD BILLION)
TABLE 6 NORTH AMERICA AUTOMOTIVE ALUMINUM MARKET, BY PRODUCT FORM, 2018β2028 (USD BILLION)
TABLE 7 NORTH AMERICA AUTOMOTIVE ALUMINUM MARKET, BY VEHICLE TYPE, 2018β2028 (USD BILLION)
TABLE 8 NORTH AMERICA AUTOMOTIVE ALUMINUM MARKET, BY APPLICATION, 2018β2028 (USD BILLION)
TABLE 9 US AUTOMOTIVE ALUMINUM MARKET, BY PRODUCT FORM, 2018β2028 (USD BILLION)
TABLE 10 US AUTOMOTIVE ALUMINUM MARKET, BY VEHICLE TYPE, 2018β2028 (USD BILLION)
TABLE 11 US AUTOMOTIVE ALUMINUM MARKET, BY APPLICATION, 2018β2028 (USD BILLION)
TABLE 12 CANADA AUTOMOTIVE ALUMINUM MARKET, BY PRODUCT FORM, 2018β2028 (USD BILLION)
TABLE 13 CANADA AUTOMOTIVE ALUMINUM MARKET, BY VEHICLE TYPE, 2018β2028 (USD BILLION)
TABLE 14 CANADA AUTOMOTIVE ALUMINUM MARKET, BY APPLICATION, 2018β2028 (USD BILLION)
TABLE 15 MEXICO AUTOMOTIVE ALUMINUM MARKET, BY PRODUCT FORM, 2018β2028 (USD BILLION)
TABLE 16 MEXICO AUTOMOTIVE ALUMINUM MARKET, BY VEHICLE TYPE, 2018β2028 (USD BILLION)
TABLE 17 MEXICO AUTOMOTIVE ALUMINUM MARKET, BY APPLICATION, 2018β2028 (USD BILLION)
TABLE 18 EUROPE AUTOMOTIVE ALUMINUM MARKET, BY COUNTRY, 2018β2028 (USD BILLION)
TABLE 19 EUROPE AUTOMOTIVE ALUMINUM MARKET, BY PRODUCT FORM, 2018β2028 (USD BILLION)
TABLE 20 EUROPE AUTOMOTIVE ALUMINUM MARKET, BY VEHICLE TYPE, 2018β2028 (USD BILLION)
TABLE 21 EUROPE AUTOMOTIVE ALUMINUM MARKET, BY APPLICATION, 2018β2028 (USD BILLION)
TABLE 22 GERMANY AUTOMOTIVE ALUMINUM MARKET, BY PRODUCT FORM, 2018β2028 (USD BILLION)
TABLE 23 GERMANY AUTOMOTIVE ALUMINUM MARKET, BY VEHICLE TYPE, 2018β2028 (USD BILLION)
TABLE 24 GERMANY AUTOMOTIVE ALUMINUM MARKET, BY APPLICATION, 2018β2028 (USD BILLION)
TABLE 25 FRANCE AUTOMOTIVE ALUMINUM MARKET, BY PRODUCT FORM, 2018β2028 (USD BILLION)
TABLE 26 FRANCE AUTOMOTIVE ALUMINUM MARKET, BY VEHICLE TYPE, 2018β2028 (USD BILLION)
TABLE 27 FRANCE AUTOMOTIVE ALUMINUM MARKET, BY APPLICATION, 2018β2028 (USD BILLION)
TABLE 28 UK AUTOMOTIVE ALUMINUM MARKET, BY PRODUCT FORM, 2018β2028 (USD BILLION)
TABLE 29 UK AUTOMOTIVE ALUMINUM MARKET, BY VEHICLE TYPE, 2018β2028 (USD BILLION)
TABLE 30 UK AUTOMOTIVE ALUMINUM MARKET, BY APPLICATION, 2018β2028 (USD BILLION)
TABLE 31 ITALY AUTOMOTIVE ALUMINUM MARKET, BY PRODUCT FORM, 2018β2028 (USD BILLION)
TABLE 32 ITALY AUTOMOTIVE ALUMINUM MARKET, BY VEHICLE TYPE, 2018β2028 (USD BILLION)
TABLE 33 ITALY AUTOMOTIVE ALUMINUM MARKET, BY APPLICATION, 2018β2028 (USD BILLION)
TABLE 34 SPAIN AUTOMOTIVE ALUMINUM MARKET, BY PRODUCT FORM, 2018β2028 (USD BILLION)
TABLE 35 SPAIN AUTOMOTIVE ALUMINUM MARKET, BY VEHICLE TYPE, 2018β2028 (USD BILLION)
TABLE 36 SPAIN AUTOMOTIVE ALUMINUM MARKET, BY APPLICATION, 2018β2028 (USD BILLION)
TABLE 37 REST OF EUROPE AUTOMOTIVE ALUMINUM MARKET, BY PRODUCT FORM, 2018β2028 (USD BILLION)
TABLE 38 REST OF EUROPE AUTOMOTIVE ALUMINUM MARKET, BY VEHICLE TYPE, 2018β2028 (USD BILLION)
TABLE 39 REST OF EUROPE AUTOMOTIVE ALUMINUM MARKET, BY APPLICATION, 2018β2028 (USD BILLION)
TABLE 40 ASIA-PACIFIC AUTOMOTIVE ALUMINUM MARKET, BY COUNTRY, 2018β2028 (USD BILLION)
TABLE 41 ASIA-PACIFIC AUTOMOTIVE ALUMINUM MARKET, BY PRODUCT FORM, 2018β2028 (USD BILLION)
TABLE 42 ASIA-PACIFIC AUTOMOTIVE ALUMINUM MARKET, BY VEHICLE TYPE, 2018β2028 (USD BILLION)
TABLE 43 ASIA-PACIFIC AUTOMOTIVE ALUMINUM MARKET, BY APPLICATION, 2018β2028 (USD BILLION)
TABLE 44 CHINA AUTOMOTIVE ALUMINUM MARKET, BY PRODUCT FORM, 2018β2028 (USD BILLION)
TABLE 45 CHINA AUTOMOTIVE ALUMINUM MARKET, BY VEHICLE TYPE, 2018β2028 (USD BILLION)
TABLE 46 CHINA AUTOMOTIVE ALUMINUM MARKET, BY APPLICATION, 2018β2028 (USD BILLION)
TABLE 47 INDIA AUTOMOTIVE ALUMINUM MARKET, BY PRODUCT FORM, 2018β2028 (USD BILLION)
TABLE 48 INDIA AUTOMOTIVE ALUMINUM MARKET, BY VEHICLE TYPE, 2018β2028 (USD BILLION)
TABLE 49 INDIA AUTOMOTIVE ALUMINUM MARKET, BY APPLICATION, 2018β2028 (USD BILLION)
TABLE 50 JAPAN AUTOMOTIVE ALUMINUM MARKET, BY PRODUCT FORM, 2018β2028 (USD BILLION)
TABLE 51 JAPAN AUTOMOTIVE ALUMINUM MARKET, BY VEHICLE TYPE, 2018β2028 (USD BILLION)
TABLE 52 JAPAN AUTOMOTIVE ALUMINUM MARKET, BY APPLICATION, 2018β2028 (USD BILLION)
TABLE 53 AUSTRALIA AUTOMOTIVE ALUMINUM MARKET, BY PRODUCT FORM, 2018β2028 (USD BILLION)
TABLE 54 AUSTRALIA AUTOMOTIVE ALUMINUM MARKET, BY VEHICLE TYPE, 2018β2028 (USD BILLION)
TABLE 55 AUSTRALIA AUTOMOTIVE ALUMINUM MARKET, BY APPLICATION, 2018β2028 (USD BILLION)
TABLE 56 SOUTH KOREA AUTOMOTIVE ALUMINUM MARKET, BY PRODUCT FORM, 2018β2028 (USD BILLION)
TABLE 57 SOUTH KOREA AUTOMOTIVE ALUMINUM MARKET, BY VEHICLE TYPE, 2018β2028 (USD BILLION)
TABLE 58 SOUTH KOREA AUTOMOTIVE ALUMINUM MARKET, BY APPLICATION, 2018β2028 (USD BILLION)
TABLE 59 REST OF ASIA-PACIFIC AUTOMOTIVE ALUMINUM MARKET, BY PRODUCT FORM, 2018β2028 (USD BILLION)
TABLE 60 REST OF ASIA-PACIFIC AUTOMOTIVE ALUMINUM MARKET, BY VEHICLE TYPE, 2018β2028 (USD BILLION)
TABLE 61 REST OF ASIA-PACIFIC AUTOMOTIVE ALUMINUM MARKET, BY APPLICATION, 2018β2028 (USD BILLION)
TABLE 62 REST OF THE WORLD AUTOMOTIVE ALUMINUM MARKET, BY COUNTRY, 2018β2028 (USD BILLION)
TABLE 63 REST OF THE WORLD AUTOMOTIVE ALUMINUM MARKET, BY PRODUCT FORM, 2018β2028 (USD BILLION)
TABLE 64 REST OF THE WORLD AUTOMOTIVE ALUMINUM MARKET, BY VEHICLE TYPE, 2018β2028 (USD BILLION)
TABLE 65 REST OF THE WORLD AUTOMOTIVE ALUMINUM MARKET, BY APPLICATION, 2018β2028 (USD BILLION)
TABLE 66 MIDDLE EAST AUTOMOTIVE ALUMINUM MARKET, BY PRODUCT FORM, 2018β2028 (USD BILLION)
TABLE 67 MIDDLE EAST AUTOMOTIVE ALUMINUM MARKET, BY VEHICLE TYPE, 2018β2028 (USD BILLION)
TABLE 68 MIDDLE EAST AUTOMOTIVE ALUMINUM MARKET, BY APPLICATION, 2018β2028 (USD BILLION)
TABLE 69 AFRICA AUTOMOTIVE ALUMINUM MARKET, BY PRODUCT FORM, 2018β2028 (USD BILLION)
TABLE 70 AFRICA AUTOMOTIVE ALUMINUM MARKET, BY VEHICLE TYPE, 2018β2028 (USD BILLION)
TABLE 71 AFRICA AUTOMOTIVE ALUMINUM MARKET, BY APPLICATION, 2018β2028 (USD BILLION)
TABLE 72 SOUTH AMERICA AUTOMOTIVE ALUMINUM MARKET, BY PRODUCT FORM, 2018β2028 (USD BILLION)
TABLE 73 SOUTH AMERICA AUTOMOTIVE ALUMINUM MARKET, BY VEHICLE TYPE, 2018β2028 (USD BILLION)
TABLE 74 SOUTH AMERICA AUTOMOTIVE ALUMINUM MARKET, BY APPLICATION, 2018β2028 (USD BILLION)
LIST OF FIGURES
FIGURE 1 MARKET SYNOPSIS
FIGURE 2 RESEARCH PROCESS OF MRFR
FIGURE 3 TOP-DOWN & BOTTOM-UP APPROACH
FIGURE 4 GLOBAL AUTOMOTIVE ALUMINUM MARKET, BY PRODUCT FORM, 2018β2028 (USD BILLION)
FIGURE 5 GLOBAL AUTOMOTIVE ALUMINUM MARKET, BY VEHICLE TYPE, 2018β2028 (USD BILLION)
FIGURE 6 GLOBAL AUTOMOTIVE ALUMINUM MARKET, BY APPLICATION, 2018β2028 (USD BILLION)
FIGURE 7 GLOBAL AUTOMOTIVE ALUMINUM MARKET, BY REGION, 2018β2028 (USD BILLION)
FIGURE 8 NORTH AMERICA AUTOMOTIVE ALUMINUM MARKET, BY COUNTRY, 2018β2028 (USD BILLION)
FIGURE 9 NORTH AMERICA AUTOMOTIVE ALUMINUM MARKET, BY PRODUCT FORM, 2018β2028 (USD BILLION)
FIGURE 10 NORTH AMERICA AUTOMOTIVE ALUMINUM MARKET, BY VEHICLE TYPE, 2018β2028 (USD BILLION)
FIGURE 11 NORTH AMERICA AUTOMOTIVE ALUMINUM MARKET, BY APPLICATION, 2018β2028 (USD BILLION)
FIGURE 12 US AUTOMOTIVE ALUMINUM MARKET, BY PRODUCT FORM, 2018β2028 (USD BILLION)
FIGURE 13 US AUTOMOTIVE ALUMINUM MARKET, BY VEHICLE TYPE, 2018β2028 (USD BILLION)
FIGURE 14 US AUTOMOTIVE ALUMINUM MARKET, BY APPLICATION, 2018β2028 (USD BILLION)
FIGURE 15 CANADA AUTOMOTIVE ALUMINUM MARKET, BY PRODUCT FORM, 2018β2028 (USD BILLION)
FIGURE 16 CANADA AUTOMOTIVE ALUMINUM MARKET, BY VEHICLE TYPE, 2018β2028 (USD BILLION)
FIGURE 17 CANADA AUTOMOTIVE ALUMINUM MARKET, BY APPLICATION, 2018β2028 (USD BILLION)
FIGURE 18 MEXICO AUTOMOTIVE ALUMINUM MARKET, BY PRODUCT FORM, 2018β2028 (USD BILLION)
FIGURE 19 MEXICO AUTOMOTIVE ALUMINUM MARKET, BY VEHICLE TYPE, 2018β2028 (USD BILLION)
FIGURE 20 MEXICO AUTOMOTIVE ALUMINUM MARKET, BY APPLICATION, 2018β2028 (USD BILLION)
FIGURE 21 EUROPE AUTOMOTIVE ALUMINUM MARKET, BY COUNTRY, 2018β2028 (USD BILLION)
FIGURE 22 EUROPE AUTOMOTIVE ALUMINUM MARKET, BY PRODUCT FORM, 2018β2028 (USD BILLION)
FIGURE 23 EUROPE AUTOMOTIVE ALUMINUM MARKET, BY VEHICLE TYPE, 2018β2028 (USD BILLION)
FIGURE 24 EUROPE AUTOMOTIVE ALUMINUM MARKET, BY APPLICATION, 2018β2028 (USD BILLION)
FIGURE 25 GERMANY AUTOMOTIVE ALUMINUM MARKET, BY PRODUCT FORM, 2018β2028 (USD BILLION)
FIGURE 26 GERMANY AUTOMOTIVE ALUMINUM MARKET, BY VEHICLE TYPE, 2018β2028 (USD BILLION)
FIGURE 27 GERMANY AUTOMOTIVE ALUMINUM MARKET, BY APPLICATION, 2018β2028 (USD BILLION)
FIGURE 28 FRANCE AUTOMOTIVE ALUMINUM MARKET, BY PRODUCT FORM, 2018β2028 (USD BILLION)
FIGURE 29 FRANCE AUTOMOTIVE ALUMINUM MARKET, BY VEHICLE TYPE, 2018β2028 (USD BILLION)
FIGURE 30 FRANCE AUTOMOTIVE ALUMINUM MARKET, BY APPLICATION, 2018β2028 (USD BILLION)
FIGURE 31 UK AUTOMOTIVE ALUMINUM MARKET, BY PRODUCT FORM, 2018β2028 (USD BILLION)
FIGURE 32 UK AUTOMOTIVE ALUMINUM MARKET, BY VEHICLE TYPE, 2018β2028 (USD BILLION)
FIGURE 33 UK AUTOMOTIVE ALUMINUM MARKET, BY APPLICATION, 2018β2028 (USD BILLION)
FIGURE 34 ITALY AUTOMOTIVE ALUMINUM MARKET, BY PRODUCT FORM, 2018β2028 (USD BILLION)
FIGURE 35 ITALY AUTOMOTIVE ALUMINUM MARKET, BY VEHICLE TYPE, 2018β2028 (USD BILLION)
FIGURE 36 ITALY AUTOMOTIVE ALUMINUM MARKET, BY APPLICATION, 2018β2028 (USD BILLION)
FIGURE 37 SPAIN AUTOMOTIVE ALUMINUM MARKET, BY PRODUCT FORM, 2018β2028 (USD BILLION)
FIGURE 38 SPAIN AUTOMOTIVE ALUMINUM MARKET, BY VEHICLE TYPE, 2018β2028 (USD BILLION)
FIGURE 39 SPAIN AUTOMOTIVE ALUMINUM MARKET, BY APPLICATION, 2018β2028 (USD BILLION)
FIGURE 40 REST OF EUROPE AUTOMOTIVE ALUMINUM MARKET, BY PRODUCT FORM, 2018β2028 (USD BILLION)
FIGURE 41 REST OF EUROPE AUTOMOTIVE ALUMINUM MARKET, BY VEHICLE TYPE, 2018β2028 (USD BILLION)
FIGURE 42 REST OF EUROPE AUTOMOTIVE ALUMINUM MARKET, BY APPLICATION, 2018β2028 (USD BILLION)
FIGURE 43 ASIA-PACIFIC AUTOMOTIVE ALUMINUM MARKET, BY COUNTRY, 2018β2028 (USD BILLION)
FIGURE 44 ASIA-PACIFIC AUTOMOTIVE ALUMINUM MARKET, BY PRODUCT FORM, 2018β2028 (USD BILLION)
FIGURE 45 ASIA-PACIFIC AUTOMOTIVE ALUMINUM MARKET, BY VEHICLE TYPE, 2018β2028 (USD BILLION)
FIGURE 46 ASIA-PACIFIC AUTOMOTIVE ALUMINUM MARKET, BY APPLICATION, 2018β2028 (USD BILLION)
FIGURE 47 CHINA AUTOMOTIVE ALUMINUM MARKET, BY PRODUCT FORM, 2018β2028 (USD BILLION)
FIGURE 48 CHINA AUTOMOTIVE ALUMINUM MARKET, BY VEHICLE TYPE, 2018β2028 (USD BILLION)
FIGURE 49 CHINA AUTOMOTIVE ALUMINUM MARKET, BY APPLICATION, 2018β2028 (USD BILLION)
FIGURE 50 INDIA AUTOMOTIVE ALUMINUM MARKET, BY PRODUCT FORM, 2018β2028 (USD BILLION)
FIGURE 51 INDIA AUTOMOTIVE ALUMINUM MARKET, BY VEHICLE TYPE, 2018β2028 (USD BILLION)
FIGURE 52 INDIA AUTOMOTIVE ALUMINUM MARKET, BY APPLICATION, 2018β2028 (USD BILLION)
FIGURE 53 JAPAN AUTOMOTIVE ALUMINUM MARKET, BY PRODUCT FORM, 2018β2028 (USD BILLION)
FIGURE 54 JAPAN AUTOMOTIVE ALUMINUM MARKET, BY VEHICLE TYPE, 2018β2028 (USD BILLION)
FIGURE 55 JAPAN AUTOMOTIVE ALUMINUM MARKET, BY APPLICATION, 2018β2028 (USD BILLION)
FIGURE 56 AUSTRALIA AUTOMOTIVE ALUMINUM MARKET, BY PRODUCT FORM, 2018β2028 (USD BILLION)
FIGURE 57 AUSTRALIA AUTOMOTIVE ALUMINUM MARKET, BY VEHICLE TYPE, 2018β2028 (USD BILLION)
FIGURE 58 AUSTRALIA AUTOMOTIVE ALUMINUM MARKET, BY APPLICATION, 2018β2028 (USD BILLION)
FIGURE 59 SOUTH KOREA AUTOMOTIVE ALUMINUM MARKET, BY PRODUCT FORM, 2018β2028 (USD BILLION)
FIGURE 60 SOUTH KOREA AUTOMOTIVE ALUMINUM MARKET, BY VEHICLE TYPE, 2018β2028 (USD BILLION)
FIGURE 61 SOUTH KOREA AUTOMOTIVE ALUMINUM MARKET, BY APPLICATION, 2018β2028 (USD BILLION)
FIGURE 62 REST OF ASIA-PACIFIC AUTOMOTIVE ALUMINUM MARKET, BY PRODUCT FORM, 2018β2028 (USD BILLION)
FIGURE 63 REST OF ASIA-PACIFIC AUTOMOTIVE ALUMINUM MARKET, BY VEHICLE TYPE, 2018β2028 (USD BILLION)
FIGURE 64 REST OF ASIA-PACIFIC AUTOMOTIVE ALUMINUM MARKET, BY APPLICATION, 2018β2028 (USD BILLION)
FIGURE 65 REST OF THE WORLD AUTOMOTIVE ALUMINUM MARKET, BY COUNTRY, 2018β2028 (USD BILLION)
FIGURE 66 REST OF THE WORLD AUTOMOTIVE ALUMINUM MARKET, BY PRODUCT FORM, 2018β2028 (USD BILLION)
FIGURE 67 REST OF THE WORLD AUTOMOTIVE ALUMINUM MARKET, BY VEHICLE TYPE, 2018β2028 (USD BILLION)
FIGURE 68 REST OF THE WORLD AUTOMOTIVE ALUMINUM MARKET, BY APPLICATION, 2018β2028 (USD BILLION)
FIGURE 69 MIDDLE EAST AUTOMOTIVE ALUMINUM MARKET, BY PRODUCT FORM, 2018β2028 (USD BILLION)
FIGURE 70 MIDDLE EAST AUTOMOTIVE ALUMINUM MARKET, BY VEHICLE TYPE, 2018β2028 (USD BILLION)
FIGURE 71 MIDDLE EAST AUTOMOTIVE ALUMINUM MARKET, BY APPLICATION, 2018β2028 (USD BILLION)
FIGURE 72 AFRICA AUTOMOTIVE ALUMINUM MARKET, BY PRODUCT FORM, 2018β2028 (USD BILLION)
FIGURE 73 AFRICA AUTOMOTIVE ALUMINUM MARKET, BY VEHICLE TYPE, 2018β2028 (USD BILLION)
FIGURE 74 AFRICA AUTOMOTIVE ALUMINUM MARKET, BY APPLICATION, 2018β2028 (USD BILLION)
FIGURE 75 SOUTH AMERICA AUTOMOTIVE ALUMINUM MARKET, BY PRODUCT FORM, 2018β2028 (USD BILLION)
FIGURE 76 SOUTH AMERICA AUTOMOTIVE ALUMINUM MARKET, BY VEHICLE TYPE, 2018β2028 (USD BILLION)
FIGURE 77 SOUTH AMERICA AUTOMOTIVE ALUMINUM MARKET, BY APPLICATION, 2018β2028 (USD BILLION)
FIGURE 109 REST OF SOUTH AMERICA LIQUID PACKAGING MARKET, BY END-USE INDUSTRY, 2018β2028 (USD Billion)
$133.41 Billion
8.72%
Asia-Pacific
2022 - 2030
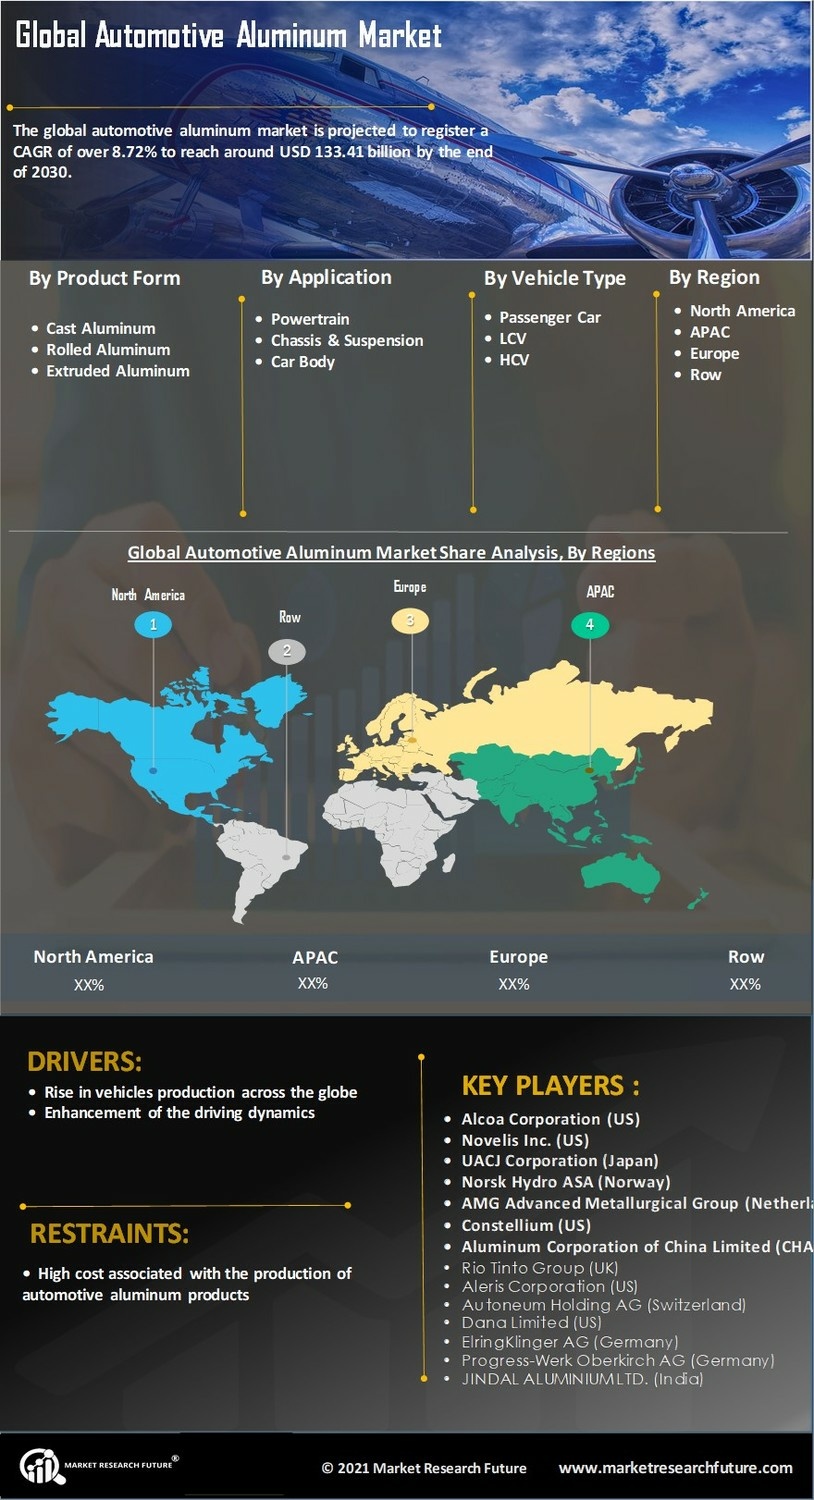
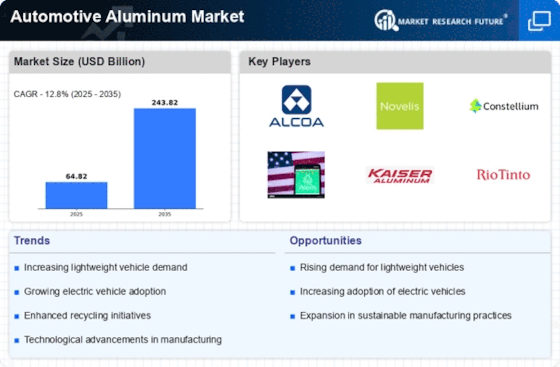
According to MRFR analysis, the global automotive aluminum market is projected to register a CAGR of over 8.72% to reach around USD 133.41 billion by the end of 2030.
Aluminum is obtained from bauxite and is a form of aluminum sulfates, which comprises of various elements such as vanadium oxides, silicon, aluminum hydroxide, titanium, chromium, sulfur, sulfuric calcium, gallium, iron, and magnesium carbonates. Aluminum is considerably lighter compared to steel, possesses significant tensile strength, and is easy to mold. These benefits make aluminum a preferred metal of use in several end use industries. The low cost of aluminum is a key factor that makes it highly used in the automotive industry. Another application of aluminum in vehicle manufacturing is its fuel efficiency. It reduces the carbon emission of the vehicles and is eco-friendly compared to the vehicles manufactured with steel. The use of aluminum enhances the durability as well as the performance of the vehicles. The versatile nature of aluminum allows automobile producers to use it along with other materials such as plastics and fiberglass to improve certain properties. Moreover, aluminum can absorb double the energy during a crash compared to mild steel.
Automotive producers are concentrating on enhancing fuel economy, performance, and low carbon emission without impacting the safety, size, and capability, which are the factor that has resulted in a considerable surge of the automotive aluminum market. Aluminum is utilized in several automobile parts such as transmission housings, wheels, alternator housing, valve covers, impellers, engine block, carburetors, wheel spacer, and fan clutch. Sheets of aluminum are used in body panels, complete vehicle body, doors, sidewalls, car trims and sealing, hood, structural components, and trunks. Several benefits are provided by using aluminum in automobiles, such as huge capability in weight reduction, significant formability, high-quality surface finish, high yield strength, good corrosion resistance in thermal load, dent resistance ability, and recyclability.
Aluminum is a highly preferred metal in commercial vehicles and automobiles due to its excellent durability and safety, significant fuel efficiency, and less emissions. The rising demand for aluminum is boosting automobile applications responsible due to its environmental benefits and strength. The ability to recycle aluminum has surged its demand, which is anticipated to record considerable growth in the near future.
The major driver for the global automotive aluminum market is the huge growth in the sales and production of several automobiles worldwide. Asia Pacific is the major contributor to the rise in production. The substantial growth in passenger vehicles use has boosted the preference for aluminum use in automobiles. The increasing population across the globe has increased the use of automobiles, which has boosted aluminum use. China, the US, and Asia Pacific are the key regions to propel aluminum use worldwide.
Strict government regulations encouraging the rising utilization of eco-friendly and lightweight items in the manufacturing of vehicles significantly boost the use of aluminum in automobiles. The advantage of aluminum being recyclable adds to the government demands, as 90% of aluminum of automobiles is recycled. Furthermore, aluminum is light in mass compared to steel, which makes the aluminum vehicles light in weight than steel.
The benefits of using aluminum allow the producers to manufacture eco-friendly and energy-efficient vehicles, along with great performance and resistance to corrosion. Luxury vehicles such as Audi, Ford, and Mercedes Benz have raised the use of aluminum as a preferred material in the body as well as transmission, engine, and wheels. Though, the growth of the global automotive aluminum market is estimated to be restricted due to the ease of available substitutes that are light in weight, such as reinforced plastic and magnesium.
Regulatory Framework
The quality of automobiles affects the safety and efficiency of the person driving and poorly manufactured and contaminated automobiles negatively impact the vehicle. Therefore, countries across the world started regulating the production and processing of the automobile industry. For instance, in India, Motor Vehicles Act, 1988 (MVA) was introduced along with the Central Motor Vehicles Rules 1989 (CMVR). The Act looks after India's safety and emission norms standards and associates the law for motor vehicles.
On the other hand, the automobile regulations outline the requirements of safety standards, good manufacturing practices, and laws related to the emission and manufacturing of automobiles around the world.
The regulation in the automotive industry impacts cars design and its components design, the overall performance, and the safety features of any vehicle. Owing to the increasing regulations in the automotive industry results surge in production costs and limits the sales of cars as well as the marketing strategies. The regulations in the automobiles industry are designed to benefit the consumer and protect the environment that manufacturers strictly follow.
UNECE regulations are followed by Japan and other member nations that state the manufacturing and driving rules for automobiles.
Impact of Coronavirus Outbreak
After hitting the lowest by the outbreak of COVID-19, the global economy is set to expand 5.6% in 2021. However, the recovery is projected to be uneven owing to the uneven vaccine rollouts, upcoming COVID-19 waves, and withdrawal of monetary support measures. In many emerging markets and developing economies, obstacles to vaccination also result in delayed normalcy. The recovery is envisioned to continue into 2022, with global growth moderating to 4.3%. However, yet the global GDP is expected to remain 1.8% below pre-pandemic projections.
The pandemic has resulted in disruptions in the operations and global supply chain across end-use industries. The disruptions have resulted in slowing or shutting down of the markets. However, with the uplifting of bans and travel restrictions, the growth across end-use industries has gained significant momentum.
The outbreak of the COVID-19 pandemic has had a swift and severe impact on the global automotive industry. A fall in vehicles sales and production was recorded in the initial months of 2020. A disruption in aluminum exports from China, manufacturing interruptions across Europe, and the closure of assembly plants in the US affected the automotive aluminum market. Though the auto industry has improved somewhat after the recession, it was greatly affected by decreased demand. Supply chain disruptions caused by a pandemic help major OEMs rethink their purchasing strategies.
Supply Chain Analysis
The supply chain analysis evaluates every stage and step taken by stakeholders involved in producing and distributing automotive aluminum products. The supply chain includes raw materials and suppliers, automotive aluminum producers, distribution channels, and end-use industries. The distribution channel in this market comprises distributors, wholesalers, and e-commerce merchants. Some key distributors and suppliers of automotive aluminum include Alcoa Corporation (US), Novelis Inc. (US), UACJ Corporation (Japan), Norsk Hydro ASA (Norway), AMG Advanced Metallurgical Group (Netherlands), Constellium (US), Aluminum Corporation of China Limited (CHALCO) (China), Rio Tinto Group (UK), Aleris Corporation (US), Autoneum Holding AG (Switzerland), Dana Limited (US), ElringKlinger AG (Germany), Progress-Werk Oberkirch AG (Germany), JINDAL ALUMINIUM LTD. (India), Kaiser Aluminum (US) and Lorin Industries (US)
Market USP
Extensive use in automobile parts manufacturing
Market Drivers
Market Restraints
Segmentation
By Product Form
By Application
By Vehicle Type
By Region
Key Players
Report Attribute/Metric | Details |
---|---|
Market Size | 2030: USD 133.41 Billion |
CAGR | 8.72% CAGR (2022 to 2030) |
Base Year | 2021 |
Forecast Period | 2022-2030 |
Historical Data | 2019 & 2020 |
Forecast Units | Value (USD Billion) |
Report Coverage | Revenue Forecast, Competitive Landscape, Growth Factors, and Trends |
Segments Covered | Product Type, Application, Vehicle Type |
Geographies Covered | North America, Europe, Asia-Pacific, and Rest of the World (RoW) |
Key Vendors | Alcoa Corporation, Novelis Inc., UACJ Corporation, Norsk Hydro ASA, AMG Advanced Metallurgical Group, Constellium, Aluminum Corporation of China Limited, Rio Tinto Group, Aleris Corporation, Autoneum Holding AG, Dana Limited, ElringKlinger AG, Progress-Werk Oberkirch AG, JINDAL ALUMINIUM LTD., Kaiser Aluminum, Lorin Industries |
Key Market Opportunities | Rise in vehicles production across the globe |
Key Market Drivers | Enhancement of the driving dynamics |
Frequently Asked Questions (FAQ) :
The global Automotive Aluminum Market would register a growth of 8.72%.
High cost associated with the production of automotive aluminum products
Alcoa Corporation (US), Novelis Inc. (US), UACJ Corporation (Japan), Norsk Hydro ASA (Norway), AMG Advanced Metallurgical Group (Netherlands), Constellium (US), Aluminum Corporation of China Limited (CHALCO) (China), Rio Tinto Group (UK), Aleris Corporation (US), Autoneum Holding AG (Switzerland), Dana Limited (US), ElringKlinger AG (Germany), Progress-Werk Oberkirch AG (Germany), JINDAL ALUMINIUM LTD. (India), Kaiser Aluminum (US), Lorin Industries (US)