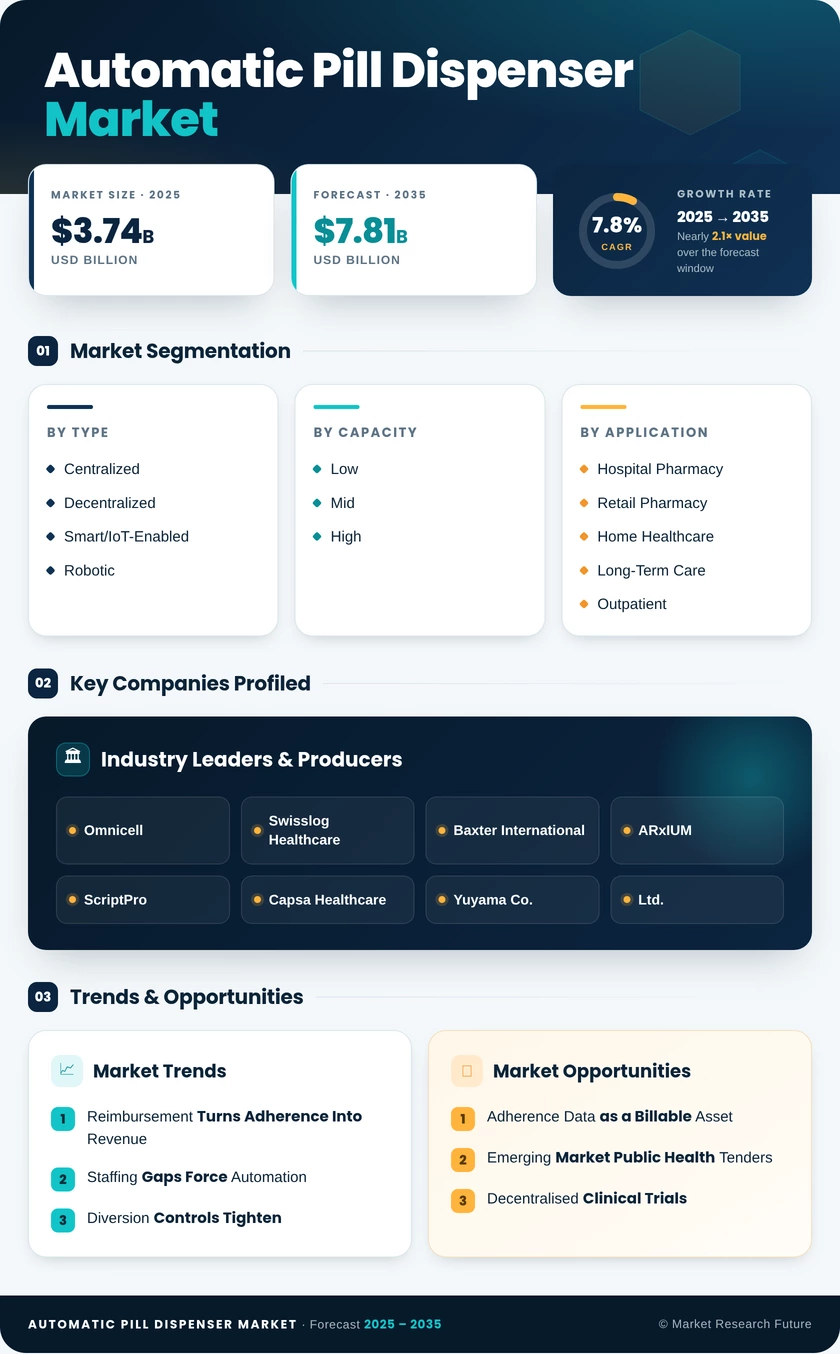
Automatic Pill Dispenser Market (2026 - 2035)

Automatic Pill Dispenser Market Research Report Information By Type (Centralized Automated Dispensing System, and Decentralized Automated Dispensing System), By End Users (Hospital Pharmacy, Retail Pharmacy, Home Healthcare, And Others), And By Region (North America, Europe, Asia-Pacific, And Rest Of The World) - Growth & Industry Forecast 2025 To 2035

Forecast Period
2026-2035
CAGR
7.8%
2025 Market Size
USD 3.74 Billion
2035 Market Size
USD 7.81 Billion
Healthcare ● Updated August 2026 Report ID: MRFR/HC/6536-HCR | Pages: 90 | Author: Vikita Thakur, Kinjoll Dey
  1. 1 Market Summary |
    1. 1.1 Study Assumptions & Market Definition |
    2. 1.2 Scope of the Study |
    3. 1.3 Research Methodology
  2. 2 Key Report Takeaways |
    1. 2.1 By Technology |
    2. 2.2 By Sector |
    3. 2.3 By Geography
  3. 3 Market Size & Forecast (2021–2035) |
    1. 3.1 Historical Market Size (2021–2024) |
    2. 3.2 Base Year Assessment (2025) |
    3. 3.3 Forecast Market Size (2026–2035) |
    4. 3.4 Year-over-Year Growth Analysis
  4. 4 Driver Impact Analysis |
    1. 4.1 Reimbursement Turns Adherence Into Revenue |
    2. 4.2 Staffing Gaps Force Automation |
    3. 4.3 Diversion Controls Tighten |
    4. 4.4 Polypharmacy at Scale
  5. 5 Restraints Impact Analysis |
    1. 5.1 The Capital Barrier |
    2. 5.2 Cyber Exposure Is Now a Purchasing Veto |
    3. 5.3 Consumer Devices Fall Between Payer Categories
  6. 6 Opportunities |
    1. 6.1 Adherence Data as a Billable Asset |
    2. 6.2 Emerging Market Public Health Tenders |
    3. 6.3 Decentralised Clinical Trials |
    4. 6.4 Long-Term Care Consolidation |
    5. 6.5 Pharmacy Retail Micro-Automation
  7. 7 Regional Market Share & Country-Level Analysis |
    1. 7.1 North America | |
      1. 7.1.1 US | |
      2. 7.1.2 Canada | |
      3. 7.1.3 Mexico |
    2. 7.2 Europe | |
      1. 7.2.1 Germany | |
      2. 7.2.2 UK | |
      3. 7.2.3 France | |
      4. 7.2.4 Italy | |
      5. 7.2.5 Spain | |
      6. 7.2.6 Nordic Countries | |
      7. 7.2.7 Russia | |
      8. 7.2.8 Rest of Europe |
    3. 7.3 Asia-Pacific | |
      1. 7.3.1 China | |
      2. 7.3.2 India | |
      3. 7.3.3 Japan | |
      4. 7.3.4 South Korea | |
      5. 7.3.5 ASEAN | |
      6. 7.3.6 Rest of Asia-Pacific |
    4. 7.4 South America | |
      1. 7.4.1 Brazil | |
      2. 7.4.2 Argentina | |
      3. 7.4.3 Rest of South America |
    5. 7.5 Middle East & Africa | |
      1. 7.5.1 Saudi Arabia | |
      2. 7.5.2 UAE | |
      3. 7.5.3 South Africa | |
      4. 7.5.4 Egypt | |
      5. 7.5.5 Rest of MEA
  8. 8 Future Outlook (2026–2035) |
    1. 8.1 Predictive Replenishment Becomes Standard |
    2. 8.2 Platform Economics Reshape Vendor Margins |
    3. 8.3 Home Care Displaces Ward-Level Growth |
    4. 8.4 Sustainability & Device Lifecycle Reporting
  9. 9 Market Segmentation Analysis |
    1. 9.1 By Type | |
      1. 9.1.1 Centralized | |
      2. 9.1.2 Decentralized | |
      3. 9.1.3 Smart/IoT-Enabled | |
      4. 9.1.4 Robotic |
    2. 9.2 By Capacity | |
      1. 9.2.1 Low | |
      2. 9.2.2 Mid | |
      3. 9.2.3 High |
    3. 9.3 By Application | |
      1. 9.3.1 Hospital Pharmacy | |
      2. 9.3.2 Retail Pharmacy | |
      3. 9.3.3 Home Healthcare | |
      4. 9.3.4 Long-Term Care | |
      5. 9.3.5 Outpatient |
    4. 9.4 By Technology | |
      1. 9.4.1 Mechanical | |
      2. 9.4.2 Electronic | |
      3. 9.4.3 Connected | |
      4. 9.4.4 AI-Assisted
  10. 10 Competitive Landscape |
    1. 10.1 Market Concentration Analysis (2026) |
    2. 10.2 Competitive Benchmarking Matrix |
    3. 10.3 Company Profiles | |
      1. 10.3.1 Omnicell | |
      2. 10.3.2 Becton, Dickinson and Company | |
      3. 10.3.3 Swisslog Healthcare | |
      4. 10.3.4 Baxter International | |
      5. 10.3.5 ARxIUM | |
      6. 10.3.6 ScriptPro | |
      7. 10.3.7 Capsa Healthcare | |
      8. 10.3.8 Yuyama Co., Ltd. | |
      9. 10.3.9 Willach Group | |
      10. 10.3.10 MedMinder Systems | |
      11. 10.3.11 Hero Health
  11. 11 Recent News & Developments
  12. 12 Report Scope & Methodology |
    1. 12.1 Study Period & Base Year |
    2. 12.2 Estimation Framework |
    3. 12.3 Abbreviations
  13. 13 Detailed Sources & Citations
  14. 14 Frequently Asked Questions
  15. 15 LIST OF TABLES |
  16. TABLE 1 Global Automatic Pill Dispenser Market Size & Forecast, by Revenue (USD Billion), 2021–2035 |
  17. TABLE 2 Global Market – Year-over-Year Growth Analysis, 2021–2035 |
  18. TABLE 3 Driver Impact Analysis Matrix, 2026–2035 |
  19. TABLE 4 Restraint Impact Analysis Matrix, 2026–2035 |
  20. TABLE 5 Global Market Size, by Region, 2021–2035 (USD Billion) |
  21. TABLE 6 North America Market Size, by Country, 2021–2035 (USD Billion) |
  22. TABLE 7 Europe Market Size, by Country, 2021–2035 (USD Billion) |
  23. TABLE 8 Asia-Pacific Market Size, by Country, 2021–2035 (USD Billion) |
  24. TABLE 9 South America Market Size, by Country, 2021–2035 (USD Billion) |
  25. TABLE 10 Middle East & Africa Market Size, by Country, 2021–2035 (USD Billion) |
  26. TABLE 11 Global Market Size, by Type, 2021–2035 (USD Billion) |
  27. TABLE 12 Global Market Size, by Capacity, 2021–2035 (USD Billion) |
  28. TABLE 13 Global Market Size, by Application, 2021–2035 (USD Billion) |
  29. TABLE 14 Global Market Size, by Technology, 2021–2035 (USD Billion) |
  30. TABLE 15 North America Market Size, by Type, 2021–2035 (USD Billion) |
  31. TABLE 16 North America Market Size, by Application, 2021–2035 (USD Billion) |
  32. TABLE 17 Europe Market Size, by Type, 2021–2035 (USD Billion) |
  33. TABLE 18 Europe Market Size, by Application, 2021–2035 (USD Billion) |
  34. TABLE 19 Asia-Pacific Market Size, by Type, 2021–2035 (USD Billion) |
  35. TABLE 20 Asia-Pacific Market Size, by Application, 2021–2035 (USD Billion) |
  36. TABLE 21 South America Market Size, by Technology, 2021–2035 (USD Billion) |
  37. TABLE 22 Middle East & Africa Market Size, by Technology, 2021–2035 (USD Billion) |
  38. TABLE 23 Competitive Benchmarking Matrix, 2026 |
  39. TABLE 24 Company Profiles – Key Players |
  40. TABLE 25 Recent Developments & Strategic Announcements, 2023–2025 |
  41. TABLE 26 Report Scope & Methodology Summary |
  42. TABLE 27 Detailed Sources & Citations Index
  43. 16 LIST OF FIGURES |
  44. FIGURE 1 Market Dynamics – Drivers, Restraints & Opportunities Snapshot |
  45. FIGURE 2 Industry Value Chain Analysis |
  46. FIGURE 3 Porter's Five Forces Analysis |
  47. FIGURE 4 Global Market Size Trend & Forecast, 2021–2035 (USD Billion) |
  48. FIGURE 5 Year-over-Year Growth Curve, 2022–2035 |
  49. FIGURE 6 Market Share by Type, 2025 vs 2035 |
  50. FIGURE 7 Market Share by Capacity, 2025 vs 2035 |
  51. FIGURE 8 Market Share by Application, 2025 vs 2035 |
  52. FIGURE 9 Market Share by Technology, 2025 vs 2035 |
  53. FIGURE 10 Regional Revenue Share, 2025 |
  54. FIGURE 11 Regional CAGR Comparison, 2026–2035 |
  55. FIGURE 12 North America Country-Level Share, 2025 |
  56. FIGURE 13 Asia-Pacific Country-Level Growth Comparison |
  57. FIGURE 14 Competitive Landscape – Revenue Share Bands, 2026 |
  58. FIGURE 15 Vendor Positioning Matrix – Capability vs Scale |
  59. FIGURE 16 Future Outlook Roadmap, 2026–2035
Share::
Request Free Sample

Segmentation Quick Reference

DimensionSub-SegmentsDominant SegmentFastest Growing Segment
By TypeCentralized, Decentralized, Smart/IoT-Enabled, RoboticCentralizedSmart/IoT-Enabled
By CapacityLow, Mid, HighMidHigh
By ApplicationHospital Pharmacy, Retail Pharmacy, Home Healthcare, Long-Term Care, OutpatientHospital PharmacyHome Healthcare
By TechnologyMechanical, Electronic, Connected, AI-AssistedElectronicAI-Assisted
By GeographyNorth America, Europe, Asia-Pacific, South America, Middle East & AfricaNorth AmericaAsia-Pacific


Market Segmentation Overview

By Type

Sub-SegmentKey Trend
CentralizedCampus-wide consolidation of pharmacy fill operations
DecentralizedWard satellites paired with central hubs in hybrid designs.
Smart/IoT-EnabledDirect-to-consumer and home health distribution channels open
RoboticMigration into community pharmacy at reduced footprint


Type structure is bifurcating. Clinical buyers keep concentrating spend on centralized platforms, while the growth story sits with connected units sold outside traditional hospital capital cycles.

By Capacity

Sub-SegmentKey Trend
LowConsumer and small clinic adoption tied to caregiver apps
MidVolume tier matching 100–400 bed facility SKU counts
HighMail-order and specialty fulfilment centre scaling


Capacity demand tracks facility size more closely than geography. The mid tier anchors global volume, but high-capacity units carry the stronger growth rate as centralized fill models spread.

By Application

Sub-SegmentKey Trend
Hospital PharmacyReplacement cycles driven by interoperability and audit rules
Retail PharmacyCountertop robotics lifting script capacity per technician
Home HealthcareReimbursed monitoring converting devices into recurring revenue
Long-Term CareMulti-site operators standardising vendors through group purchasing.
OutpatientAmbulatory surgery centre expansion creating new dispensing points.


Application mix is where the decade's shift is most visible. Hospital pharmacy stays the revenue anchor, yet incremental units increasingly ship to residential and ambulatory settings.

By Technology

Sub-SegmentKey Trend
MechanicalPersisting in low-resource and off-grid care settings
ElectronicDefining the installed base now entering replacement
ConnectedIntegration with certified electronic health records
AI-AssistedPredictive replenishment reframing the purchase as an ROI case


Technology adoption is gated by IT policy more than clinical preference. Cabinets that cannot satisfy zero-trust network requirements are excluded before clinical evaluation begins.

By Geography

Sub-SegmentKey Trend
North AmericaReplacement-led demand under diversion and interoperability pressure
EuropeRegulatory recertification converting compliance into renewal.
Asia-PacificTertiary hospital retrofit plus super-aged home demand in Japan
South AmericaPublic tender cycles favouring local service depth
Middle East & AfricaGreenfield hospital builds specifying closed-loop systems.


Regional trajectories diverge on reimbursement maturity rather than income level, which is why Asia-Pacific outpaces wealthier blocs across the forecast window.




Share::
Request Free Sample
Download PDF ×

We do not share your information with anyone. However, we may send you emails based on your report interest from time to time. You may contact us at any time to opt-out.