Asia-Pacific Warehouse Automation Market (2026 – 2035)

ID: MRFR/SEM/12422-HCR 128 Pages Aarti Dhapte Last Updated: September 15, 2026
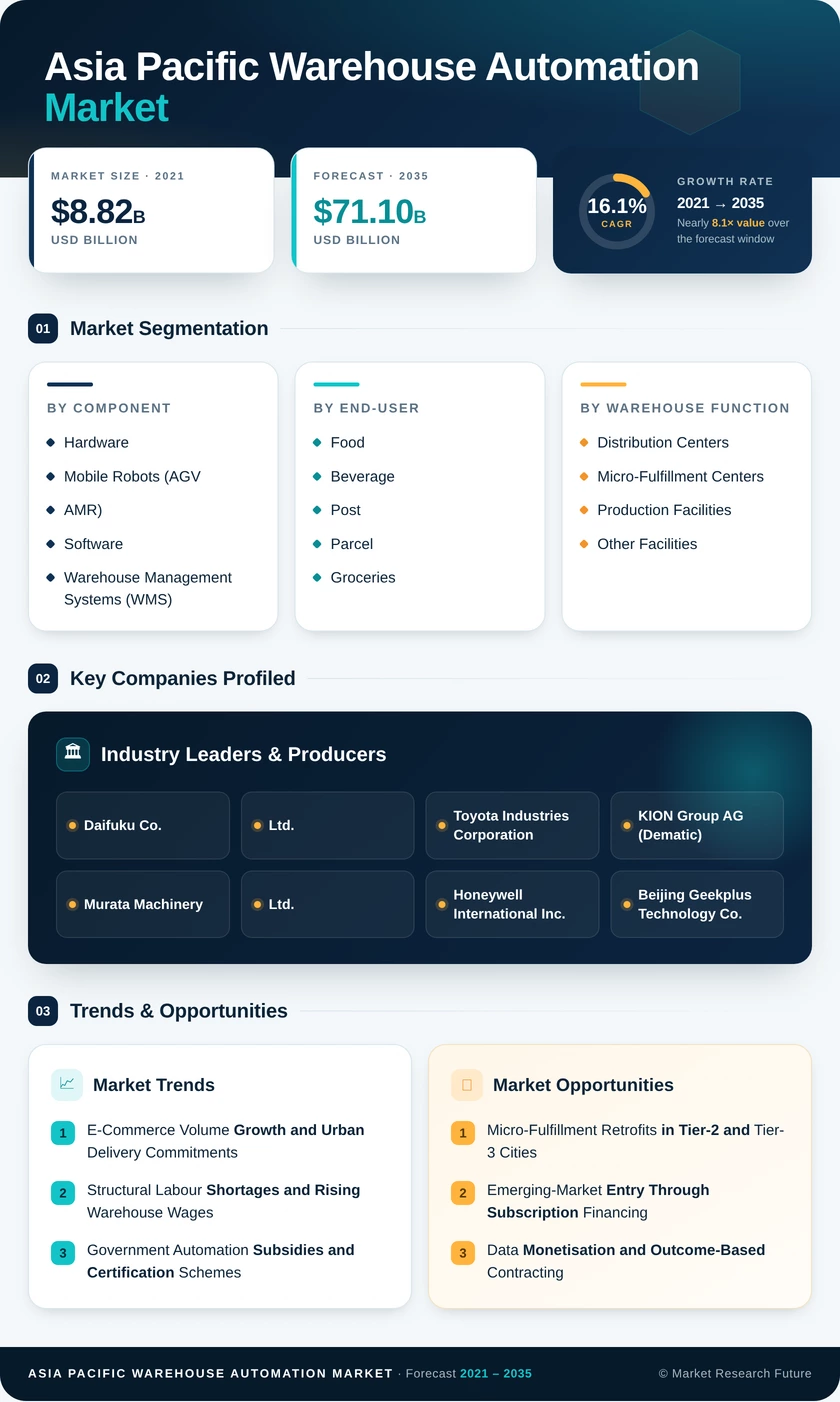
Asia-Pacific Warehouse Automation Market Size, Share and Research Report By Component (Hardware, Software, Services), By End-User (Food and Beverage, Post and Parcel, Groceries, General Merchandise, Apparel, Manufacturing, Other End-User Industries), By Warehouse Function (Distribution Centers, Micro-Fulfillment Centers, Production Facilities, Other Facilities), By Warehouse Size (Large (Above 250,000 sq ft), Medium (50,000–250,000 sq ft), Small (Below 50,000 sq ft)) and By Country (China, India, Japan, South Korea, Australia, Rest of Asia-Pacific) - Industry Forecast to 2035.
Asia-Pacific Warehouse Automation Market
Market Size
Forecast Period2026-2035
CAGR (2026-2035)16.1%
2025 Market SizeUSD 15.15 Billion
2035 Market SizeUSD 71.10 Billion
Key Players
Daifuku Co., Ltd.
Toyota Industries Corporation
KION Group AG
Murata Machinery, Ltd.
Honeywell International Inc.
Beijing Geekplus Technology Co., Ltd.
Opportunities
  • Micro-Fulfillment Retrofits in Tier-2 and Tier-3 Cities
  • Emerging-Market Entry Through Subscription Financing
  • Data Monetisation and Outcome-Based Contracting
  1. 1 Market Summary | |
    1. 1.1 Study Assumptions & Market Definition | |
    2. 1.2 Scope of the Study | |
    3. 1.3 Research Methodology | |
  2. 2 Key Report Takeaways | |
    1. 2.1 By Component | |
    2. 2.2 By End-User | |
    3. 2.3 By Warehouse Function | |
    4. 2.4 By Warehouse Size | |
    5. 2.5 By Country | |
    6. 2.6 By Region | |
  3. 3 Market Size and Forecast (2021–2035) | |
    1. 3.1 Historical Market Size (2021–2024) | |
    2. 3.2 Base Year Estimate (2025) | |
    3. 3.3 Forecast Market Size (2026–2035) | |
    4. 3.4 Year-over-Year Growth Analysis | |
  4. 4 Driver Impact Analysis | |
    1. 4.1 E-Commerce Volume Growth and Urban Delivery Commitments | |
    2. 4.2 Structural Labour Shortages and Rising Warehouse Wages | |
    3. 4.3 Government Automation Subsidies and Certification Schemes | |
    4. 4.4 Falling Robot Hardware Costs and Subscription Financing | |
    5. 4.5 Cold-Chain Mechanisation Mandates | |
    6. 4.6 5G and Edge Connectivity for Dense Robot Fleets | |
    7. 4.7 Energy-per-Order and ESG Disclosure Requirements | |
  5. 5 Restraints Impact Analysis | |
    1. 5.1 High Upfront Capital Intensity and Long Payback | |
    2. 5.2 IT–OT Integration Complexity and Legacy Control Estates | |
    3. 5.3 Shortage of Automation Engineers and Certified Integrators | |
    4. 5.4 Fragmented Safety and Interoperability Standards | |
    5. 5.5 Building Constraints and Low Retrofit Ceiling Heights | |
  6. 6 Opportunities | |
    1. 6.1 Micro-Fulfillment Retrofits in Tier-2 and Tier-3 Cities | |
    2. 6.2 Emerging-Market Entry Through Subscription Financing | |
    3. 6.3 Data Monetisation and Outcome-Based Contracting | |
    4. 6.4 Cold-Chain Capacity Build-Out Under Regulatory Mandate | |
    5. 6.5 Energy-Linked Incentives and Green Fit-Out Packages | |
  7. 7 Regional Market Share and Country-Level Analysis | |
    1. 7.1 East Asia | | |
      1. 7.1.1 China | | |
      2. 7.1.2 Japan | | |
      3. 7.1.3 South Korea | |
    2. 7.2 South Asia | | |
      1. 7.2.1 India | | |
      2. 7.2.2 Rest of South Asia | |
    3. 7.3 Southeast Asia | | |
      1. 7.3.1 Singapore | | |
      2. 7.3.2 Indonesia | | |
      3. 7.3.3 Thailand | | |
      4. 7.3.4 Vietnam | | |
      5. 7.3.5 Malaysia | | |
      6. 7.3.6 Rest of Southeast Asia | |
    4. 7.4 Oceania | | |
      1. 7.4.1 Australia | | |
      2. 7.4.2 New Zealand | |
    5. 7.5 Rest of Asia-Pacific | | |
      1. 7.5.1 Taiwan | | |
      2. 7.5.2 Other Asia-Pacific Markets | |
  8. 8 Future Outlook (2026–2035) | |
    1. 8.1 Autonomous Orchestration Replaces Rule-Based Control | |
    2. 8.2 Platform Economics and the Rise of Recurring Revenue | |
    3. 8.3 Cold-Chain and Pharmaceutical Compliance as a Growth Engine | |
    4. 8.4 Energy Intensity Becomes a Procurement Criterion | |
  9. 9 Segmentation Analysis | |
    1. 9.1 By Component | | |
      1. 9.1.1 Hardware | | |
      2. 9.1.2 Software | | |
      3. 9.1.3 Services | |
    2. 9.2 By End-User | | |
      1. 9.2.1 Food and Beverage | | |
      2. 9.2.2 Post and Parcel | | |
      3. 9.2.3 Groceries | | |
      4. 9.2.4 General Merchandise | | |
      5. 9.2.5 Apparel | | |
      6. 9.2.6 Manufacturing | | |
      7. 9.2.7 Other End-User Industries | |
    3. 9.3 By Warehouse Function | | |
      1. 9.3.1 Distribution Centers | | |
      2. 9.3.2 Micro-Fulfillment Centers | | |
      3. 9.3.3 Production Facilities | | |
      4. 9.3.4 Other Facilities | |
    4. 9.4 By Warehouse Size | | |
      1. 9.4.1 Large (Above 250,000 sq ft) | | |
      2. 9.4.2 Medium (50,000–250,000 sq ft) | | |
      3. 9.4.3 Small (Below 50,000 sq ft) | |
    5. 9.5 By Country | | |
      1. 9.5.1 China | | |
      2. 9.5.2 India | | |
      3. 9.5.3 Japan | | |
      4. 9.5.4 South Korea | | |
      5. 9.5.5 Australia | | |
      6. 9.5.6 Rest of Asia-Pacific | |
  10. 10 Competitive Landscape | |
    1. 10.1 Market Concentration Analysis | |
    2. 10.2 Competitive Benchmarking Matrix | |
    3. 10.3 Company Profiles | |
  11. 11 Recent News and Developments | |
  12. 12 Report Scope and Methodology | |
  13. 13 Detailed Sources and Citations | |
  14. 14 Frequently Asked Questions | | LIST OF TABLES | |
  15. TABLE 1 Asia-Pacific Warehouse Automation Market Size & Forecast, by Revenue (USD Billion), 2021–2035 | |
  16. TABLE 2 Asia-Pacific Warehouse Automation Market – Year-over-Year Growth Analysis, 2021–2035 | |
  17. TABLE 3 Driver Impact Analysis – Asia-Pacific Warehouse Automation Market, 2026–2035 | |
  18. TABLE 4 Restraint Impact Analysis – Asia-Pacific Warehouse Automation Market, 2026–2035 | |
  19. TABLE 5 Asia-Pacific Warehouse Automation Market Size, by Region, 2021–2035 (USD Billion) | |
  20. TABLE 6 East Asia Warehouse Automation Market Size, by Country, 2021–2035 (USD Billion) | |
  21. TABLE 7 South Asia Warehouse Automation Market Size, by Country, 2021–2035 (USD Billion) | |
  22. TABLE 8 Southeast Asia Warehouse Automation Market Size, by Country, 2021–2035 (USD Billion) | |
  23. TABLE 9 Oceania Warehouse Automation Market Size, by Country, 2021–2035 (USD Billion) | |
  24. TABLE 10 Rest of Asia-Pacific Warehouse Automation Market Size, by Country, 2021–2035 (USD Billion) | |
  25. TABLE 11 Asia-Pacific Warehouse Automation Market Size, by Component, 2021–2035 (USD Billion) | |
  26. TABLE 12 Asia-Pacific Warehouse Automation Market Size, by End-User, 2021–2035 (USD Billion) | |
  27. TABLE 13 Asia-Pacific Warehouse Automation Market Size, by Warehouse Function, 2021–2035 (USD Billion) | |
  28. TABLE 14 Asia-Pacific Warehouse Automation Market Size, by Warehouse Size, 2021–2035 (USD Billion) | |
  29. TABLE 15 Asia-Pacific Warehouse Automation Market Size, by Country, 2021–2035 (USD Billion) | |
  30. TABLE 16 Competitive Benchmarking Matrix – Asia-Pacific Warehouse Automation Market, 2026 | |
  31. TABLE 17 Company Profiles – Key Players, Asia-Pacific Warehouse Automation Market | |
  32. TABLE 18 Recent Developments & Strategic Announcements, 2023–2025 | |
  33. TABLE 19 Report Scope & Methodology Summary | |
  34. TABLE 20 Detailed Sources and Citations Index | |
  35. TABLE 21 China Warehouse Automation Market Size, by Component, 2021–2035 (USD Billion) | |
  36. TABLE 22 India Warehouse Automation Market Size, by End-User, 2021–2035 (USD Billion) | |
  37. TABLE 23 Japan Warehouse Automation Market Size, by Warehouse Function, 2021–2035 (USD Billion) | |
  38. TABLE 24 Segmentation Quick Reference – Dominant and Fastest Growing Segments | | LIST OF FIGURES | |
  39. FIGURE 1 Asia-Pacific Warehouse Automation Market Dynamics – Drivers, Restraints and Opportunities | |
  40. FIGURE 2 Industry Value Chain Analysis – Asia-Pacific Warehouse Automation Market | |
  41. FIGURE 3 Porter's Five Forces Analysis – Asia-Pacific Warehouse Automation Market | |
  42. FIGURE 4 Market Size Trend and Forecast, 2021–2035 (USD Billion) | |
  43. FIGURE 5 Year-over-Year Growth Trajectory, 2022–2035 (%) | |
  44. FIGURE 6 Market Share by Component, 2025 (%) | |
  45. FIGURE 7 Market Share by End-User, 2025 (%) | |
  46. FIGURE 8 Market Share by Warehouse Function, 2025 (%) | |
  47. FIGURE 9 Market Share by Warehouse Size, 2025 (%) | |
  48. FIGURE 10 Market Share by Country, 2025 (%) | |
  49. FIGURE 11 Regional Revenue Share Distribution, 2025 vs 2035 (%) | |
  50. FIGURE 12 Fastest Growing Sub-Regions by CAGR, 2026–2035 (%) | |
  51. FIGURE 13 Competitive Landscape – Estimated Revenue Share Bands, 2026 | |
  52. FIGURE 14 Competitive Positioning Matrix – Capability vs Regional Coverage | |
  53. FIGURE 15 Driver Impact Weighting on Forecast Growth, 2026–2035

Segmentation Quick Reference

DimensionSub-SegmentsDominant SegmentFastest Growing Segment
By ComponentHardware; Mobile Robots (AGV, AMR); Software; Warehouse Management Systems (WMS); Warehouse Execution Systems (WES); Services; Value Added Services; MaintenanceHardware – 63.8% share (2025)Services – 16.7% CAGR (2026–2035)
By End-UserFood and Beverage; Post and Parcel; Groceries; General Merchandise; Apparel; Manufacturing; Other End-User IndustriesFood and Beverage – 21.5% share (2025)Groceries – 17.5% CAGR (2026–2035)
By Warehouse FunctionDistribution Centers; Micro-Fulfillment Centers; Production Facilities; Other FacilitiesDistribution Centers – 38.5% share (2025)Micro-Fulfillment Centers – 17.2% CAGR (2026–2035)
By Warehouse SizeLarge (Above 250,000 sq ft); Medium (50,000–250,000 sq ft); Small (Below 50,000 sq ft)Large (Above 250,000 sq ft) – 43.5% share (2025)Small (Below 50,000 sq ft) – 16.7% CAGR (2026–2035)
By CountryChina; India; Japan; South Korea; Australia; Rest of Asia-PacificChina – 52.9% share (2025)India – 17.3% CAGR (2026–2035)


Market Segmentation Overview

By Component

Sub-SegmentKey Trend
HardwareMobile robot fleets and shuttle storage remain the physical basis of throughput gains.
Mobile Robots (AGV, AMR)Falling unit prices and flexible deployment displace fixed conveyor networks.
SoftwareControl layers increasingly licensed independently of the equipment award.
Warehouse Management Systems (WMS)Multi-site inventory orchestration standardising across regional operators
Warehouse Execution Systems (WES)Live task arbitration across mixed-vendor fleets becoming the core differentiator.
ServicesMulti-year contracts bundling integration, safety certification and upskilling
Value Added ServicesProcess redesign and workforce certification lifting service margins
MaintenanceUptime-guaranteed contracts replacing scheduled-visit models


Hardware leads this dimension with 63.8% of 2025 revenue because Mobile Robots (AGV, AMR) and shuttle storage still resolve the throughput constraint that every project confronts first. Services grow fastest at a 16.7% CAGR, since the binding difficulty in Asian deployments has shifted from machine capability to joining legacy execution estates to modern control stacks. Within software, Warehouse Execution Systems outpace Warehouse Management Systems because live arbitration across mixed fleets is the harder engineering problem and commands separate licensing.

By End-User

Sub-SegmentKey Trend
Food and BeveragePalletising robots absorbing repetitive heavy case handling at scale
Post and ParcelHigh-speed sortation at hubs clearing tens of thousands of pieces hourly
GroceriesCold-chain mandates and sub-hour delivery windows driving mechanised storage
General MerchandiseSKU proliferation across omnichannel assortments straining manual picking
ApparelReturns processing volume rising faster than robotic grasping capability.
ManufacturingLine-side sequencing and finished-goods staging using mobile fleets
Other End-User IndustriesPharmaceutical traceability standards rewarding automated data capture.


Food and Beverage holds the largest share at 21.5% because beverage distribution presents uniform, heavy cases moving in predictable volumes — the cleanest case for palletising automation anywhere in the region. Groceries grow fastest at a 17.5% CAGR as provincial cold-chain mechanisation targets and one-hour delivery promises push capital toward multi-zone temperature-controlled storage. Apparel remains the laggard on growth despite substantial volume, since soft-goods geometry and SKU variability still defeat reliable robotic grasping at commercial speeds.

By Warehouse Function

Sub-SegmentKey Trend
Distribution CentersMaster hubs feeding regional spokes absorbing the largest single awards
Micro-Fulfillment CentersGoods-to-person workcells under 10,000 sq ft matching full-scale pick rates.
Production FacilitiesLine-side buffering and work-in-progress storage using automated transport
Other FacilitiesReturns processing and cross-dock operations mechanising selectively.


Distribution Centers command 38.5% of 2025 revenue because master hubs justify the highest capital per site and continue to anchor national network design across China, Japan and Australia. Micro-Fulfillment Centers grow fastest at a 17.2% CAGR as urban consumers prioritise delivery speed over assortment breadth, making dark stores in Beijing, Singapore and Sydney economically viable. Compact grid systems now hold 20,000 or more SKUs in footprints that once supported only staging, which is what closed the gap against full-scale facilities.

By Warehouse Size

Sub-SegmentKey Trend
Large (Above 250,000 sq ft)Mega-hubs processing millions of parcels daily, concentrating major installations.
Medium (50,000–250,000 sq ft)Multi-client third-party operators adopting modular, redeployable systems
Small (Below 50,000 sq ft)Inner-city rents driving vertical storage and four-fold density gains


Large facilities above 250,000 sq ft dominate with 43.5% of 2025 revenue because parcel mega-hubs concentrate the region's biggest equipment installations in a small number of sites. Small facilities below 50,000 sq ft grow fastest at a 16.7% CAGR since urban land pricing makes cubic capacity more valuable than floor area, and grid systems multiply density within existing footprints. Japan and South Korea show the sharpest shift toward the small format as zoning limits curb greenfield construction and force retrofits into buildings with constrained clear heights.

By Country

Sub-SegmentKey Trend
ChinaDomestic robot manufacturing scale paired with certified-project equipment subsidies.
IndiaCorridor infrastructure and quick-commerce specifying automation at lease signing.
JapanDriver-hour caps redirecting investment toward dock and storage productivity.
South KoreaCertification-linked tax deductions grading facilities by automation level
AustraliaGrocery chain grid programmes tied to energy-intensity disclosure
Rest of Asia-PacificManufacturing relocation creating finished-goods staging demand


China anchors the dimension with 52.9% of 2025 revenue, sustained by parcel volumes no other market approaches and by domestic suppliers whose pricing shapes regional equipment economics. India grows fastest at a 17.3% CAGR from a comparatively small base, because Gati Shakti corridor capacity is being built new and specifies automation from the outset rather than as a retrofit. Japan converts along a different path, favouring density-led retrofits over new construction given land constraints and an ageing facility stock.




Download PDF ×

We do not share your information with anyone. However, we may send you emails based on your report interest from time to time. You may contact us at any time to opt-out.