Request Free Sample ×

Kindly complete the form below to receive a free sample of this Report

* Please use a valid business email

Leading companies partner with us for data-driven Insights

clients tt-cursor
Hero Background

Asia Pacific Tortilla Market

ID: MRFR/FnB/3720-CR
128 Pages
Snehal Singh
Last Updated: February 03, 2026

Asia Pacific Tortilla Market Size, Share, Industry Trend & Analysis Report Information by Product Type (Tortilla Mix, Pre-Cooked Tortilla, Frozen Tortilla, Tortilla Chips), Source (Corn, Wheat), Claim (Gluten-Free, Low-carb), Distribution Channel (Store & Non-store) & Region - Forecast till 2032

Share:
Download PDF ×

We do not share your information with anyone. However, we may send you emails based on your report interest from time to time. You may contact us at any time to opt-out.

  1. 1 SECTION I: EXECUTIVE SUMMARY AND KEY HIGHLIGHTS
    1. 1.1 EXECUTIVE SUMMARY
      1. 1.1.1 Market Overview
      2. 1.1.2 Key Findings
      3. 1.1.3 Market Segmentation
      4. 1.1.4 Competitive Landscape
      5. 1.1.5 Challenges and Opportunities
      6. 1.1.6 Future Outlook
  2. 2 SECTION II: SCOPING, METHODOLOGY AND MARKET STRUCTURE
    1. 2.1 MARKET INTRODUCTION
      1. 2.1.1 Definition
      2. 2.1.2 Scope of the study
        1. 2.1.2.1 Research Objective
        2. 2.1.2.2 Assumption
        3. 2.1.2.3 Limitations
    2. 2.2 RESEARCH METHODOLOGY
      1. 2.2.1 Overview
      2. 2.2.2 Data Mining
      3. 2.2.3 Secondary Research
      4. 2.2.4 Primary Research
        1. 2.2.4.1 Primary Interviews and Information Gathering Process
        2. 2.2.4.2 Breakdown of Primary Respondents
      5. 2.2.5 Forecasting Model
      6. 2.2.6 Market Size Estimation
        1. 2.2.6.1 Bottom-Up Approach
        2. 2.2.6.2 Top-Down Approach
      7. 2.2.7 Data Triangulation
      8. 2.2.8 Validation
  3. 3 SECTION III: QUALITATIVE ANALYSIS
    1. 3.1 MARKET DYNAMICS
      1. 3.1.1 Overview
      2. 3.1.2 Drivers
      3. 3.1.3 Restraints
      4. 3.1.4 Opportunities
    2. 3.2 MARKET FACTOR ANALYSIS
      1. 3.2.1 Value chain Analysis
      2. 3.2.2 Porter's Five Forces Analysis
        1. 3.2.2.1 Bargaining Power of Suppliers
        2. 3.2.2.2 Bargaining Power of Buyers
        3. 3.2.2.3 Threat of New Entrants
        4. 3.2.2.4 Threat of Substitutes
        5. 3.2.2.5 Intensity of Rivalry
      3. 3.2.3 COVID-19 Impact Analysis
        1. 3.2.3.1 Market Impact Analysis
        2. 3.2.3.2 Regional Impact
        3. 3.2.3.3 Opportunity and Threat Analysis
  4. 4 SECTION IV: QUANTITATIVE ANALYSIS
    1. 4.1 Life Sciences, BY Type (USD Million)
      1. 4.1.1 Industrial
      2. 4.1.2 Artisanal
    2. 4.2 Life Sciences, BY Processing Type (USD Million)
      1. 4.2.1 Fresh
      2. 4.2.2 Frozen
    3. 4.3 Life Sciences, BY Product Type (USD Million)
      1. 4.3.1 Tortilla mix
      2. 4.3.2 Pre-cooked tortilla
      3. 4.3.3 Tostadas
      4. 4.3.4 Tortilla chips
      5. 4.3.5 Taco shell
      6. 4.3.6 Others
    4. 4.4 Life Sciences, BY Nature (USD Million)
      1. 4.4.1 Organic
      2. 4.4.2 Conventional
    5. 4.5 Life Sciences, BY Source (USD Million)
      1. 4.5.1 Corn
      2. 4.5.2 Wheat
    6. 4.6 Life Sciences, BY Category (USD Million)
      1. 4.6.1 Standard/regular
      2. 4.6.2 Gluten-free
    7. 4.7 Life Sciences, BY Distribution Channel (USD Million)
      1. 4.7.1 B2B
      2. 4.7.2 B2C
  5. 5 SECTION V: COMPETITIVE ANALYSIS
    1. 5.1 Competitive Landscape
      1. 5.1.1 Overview
      2. 5.1.2 Competitive Analysis
      3. 5.1.3 Market share Analysis
      4. 5.1.4 Major Growth Strategy in the Life Sciences
      5. 5.1.5 Competitive Benchmarking
      6. 5.1.6 Leading Players in Terms of Number of Developments in the Life Sciences
      7. 5.1.7 Key developments and growth strategies
        1. 5.1.7.1 New Product Launch/Service Deployment
        2. 5.1.7.2 Merger & Acquisitions
        3. 5.1.7.3 Joint Ventures
      8. 5.1.8 Major Players Financial Matrix
        1. 5.1.8.1 Sales and Operating Income
        2. 5.1.8.2 Major Players R&D Expenditure. 2023
    2. 5.2 Company Profiles
      1. 5.2.1 Gruma (MX)
        1. 5.2.1.1 Financial Overview
        2. 5.2.1.2 Products Offered
        3. 5.2.1.3 Key Developments
        4. 5.2.1.4 SWOT Analysis
        5. 5.2.1.5 Key Strategies
      2. 5.2.2 Mission Foods (US)
        1. 5.2.2.1 Financial Overview
        2. 5.2.2.2 Products Offered
        3. 5.2.2.3 Key Developments
        4. 5.2.2.4 SWOT Analysis
        5. 5.2.2.5 Key Strategies
      3. 5.2.3 Tortilla Land (US)
        1. 5.2.3.1 Financial Overview
        2. 5.2.3.2 Products Offered
        3. 5.2.3.3 Key Developments
        4. 5.2.3.4 SWOT Analysis
        5. 5.2.3.5 Key Strategies
      4. 5.2.4 Bimbo Bakeries USA (US)
        1. 5.2.4.1 Financial Overview
        2. 5.2.4.2 Products Offered
        3. 5.2.4.3 Key Developments
        4. 5.2.4.4 SWOT Analysis
        5. 5.2.4.5 Key Strategies
      5. 5.2.5 El Milagro (US)
        1. 5.2.5.1 Financial Overview
        2. 5.2.5.2 Products Offered
        3. 5.2.5.3 Key Developments
        4. 5.2.5.4 SWOT Analysis
        5. 5.2.5.5 Key Strategies
      6. 5.2.6 La Banderita (US)
        1. 5.2.6.1 Financial Overview
        2. 5.2.6.2 Products Offered
        3. 5.2.6.3 Key Developments
        4. 5.2.6.4 SWOT Analysis
        5. 5.2.6.5 Key Strategies
      7. 5.2.7 Tortilla Factory (US)
        1. 5.2.7.1 Financial Overview
        2. 5.2.7.2 Products Offered
        3. 5.2.7.3 Key Developments
        4. 5.2.7.4 SWOT Analysis
        5. 5.2.7.5 Key Strategies
      8. 5.2.8 Casa Fiesta (US)
        1. 5.2.8.1 Financial Overview
        2. 5.2.8.2 Products Offered
        3. 5.2.8.3 Key Developments
        4. 5.2.8.4 SWOT Analysis
        5. 5.2.8.5 Key Strategies
    3. 5.3 Appendix
      1. 5.3.1 References
      2. 5.3.2 Related Reports
  6. 6 LIST OF FIGURES
    1. 6.1 MARKET SYNOPSIS
    2. 6.2 APAC MARKET ANALYSIS BY TYPE
    3. 6.3 APAC MARKET ANALYSIS BY PROCESSING TYPE
    4. 6.4 APAC MARKET ANALYSIS BY PRODUCT TYPE
    5. 6.5 APAC MARKET ANALYSIS BY NATURE
    6. 6.6 APAC MARKET ANALYSIS BY SOURCE
    7. 6.7 APAC MARKET ANALYSIS BY CATEGORY
    8. 6.8 APAC MARKET ANALYSIS BY DISTRIBUTION CHANNEL
    9. 6.9 KEY BUYING CRITERIA OF LIFE SCIENCES
    10. 6.10 RESEARCH PROCESS OF MRFR
    11. 6.11 DRO ANALYSIS OF LIFE SCIENCES
    12. 6.12 DRIVERS IMPACT ANALYSIS: LIFE SCIENCES
    13. 6.13 RESTRAINTS IMPACT ANALYSIS: LIFE SCIENCES
    14. 6.14 SUPPLY / VALUE CHAIN: LIFE SCIENCES
    15. 6.15 LIFE SCIENCES, BY TYPE, 2024 (% SHARE)
    16. 6.16 LIFE SCIENCES, BY TYPE, 2024 TO 2035 (USD Million)
    17. 6.17 LIFE SCIENCES, BY PROCESSING TYPE, 2024 (% SHARE)
    18. 6.18 LIFE SCIENCES, BY PROCESSING TYPE, 2024 TO 2035 (USD Million)
    19. 6.19 LIFE SCIENCES, BY PRODUCT TYPE, 2024 (% SHARE)
    20. 6.20 LIFE SCIENCES, BY PRODUCT TYPE, 2024 TO 2035 (USD Million)
    21. 6.21 LIFE SCIENCES, BY NATURE, 2024 (% SHARE)
    22. 6.22 LIFE SCIENCES, BY NATURE, 2024 TO 2035 (USD Million)
    23. 6.23 LIFE SCIENCES, BY SOURCE, 2024 (% SHARE)
    24. 6.24 LIFE SCIENCES, BY SOURCE, 2024 TO 2035 (USD Million)
    25. 6.25 LIFE SCIENCES, BY CATEGORY, 2024 (% SHARE)
    26. 6.26 LIFE SCIENCES, BY CATEGORY, 2024 TO 2035 (USD Million)
    27. 6.27 LIFE SCIENCES, BY DISTRIBUTION CHANNEL, 2024 (% SHARE)
    28. 6.28 LIFE SCIENCES, BY DISTRIBUTION CHANNEL, 2024 TO 2035 (USD Million)
    29. 6.29 BENCHMARKING OF MAJOR COMPETITORS
  7. 7 LIST OF TABLES
    1. 7.1 LIST OF ASSUMPTIONS
  8. 7.1.1
    1. 7.2 APAC MARKET SIZE ESTIMATES; FORECAST
      1. 7.2.1 BY TYPE, 2025-2035 (USD Million)
      2. 7.2.2 BY PROCESSING TYPE, 2025-2035 (USD Million)
      3. 7.2.3 BY PRODUCT TYPE, 2025-2035 (USD Million)
      4. 7.2.4 BY NATURE, 2025-2035 (USD Million)
      5. 7.2.5 BY SOURCE, 2025-2035 (USD Million)
      6. 7.2.6 BY CATEGORY, 2025-2035 (USD Million)
      7. 7.2.7 BY DISTRIBUTION CHANNEL, 2025-2035 (USD Million)
    2. 7.3 PRODUCT LAUNCH/PRODUCT DEVELOPMENT/APPROVAL
  9. 7.3.1
    1. 7.4 ACQUISITION/PARTNERSHIP
  10. 7.4.1

APAC Life Sciences Market Segmentation

Life Sciences By Type (USD Million, 2025-2035)
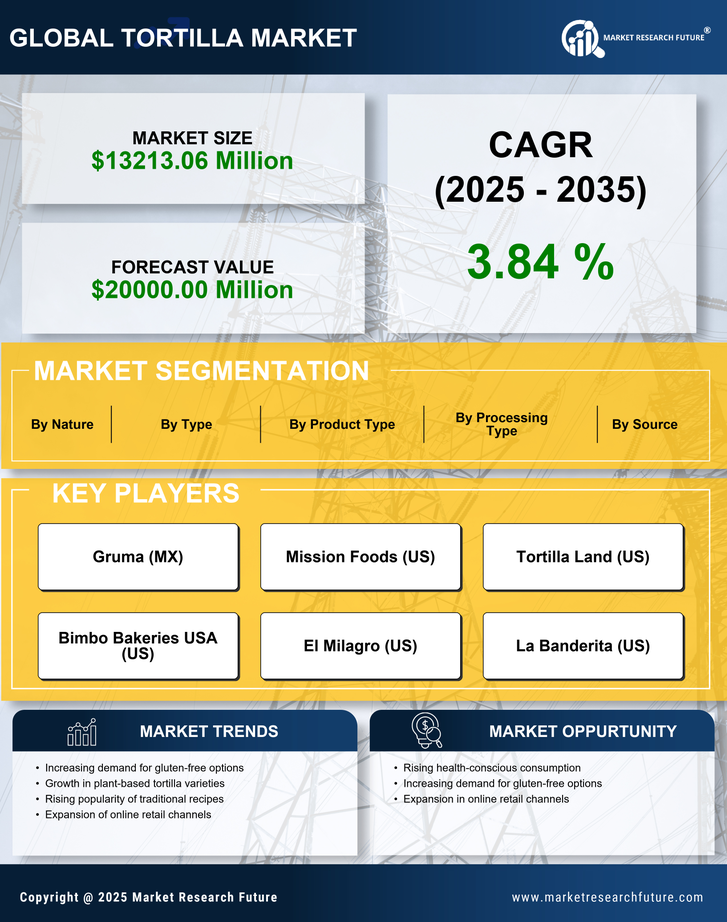
  • Industrial
  • Artisanal

Life Sciences By Processing Type (USD Million, 2025-2035)

  • Fresh
  • Frozen

Life Sciences By Product Type (USD Million, 2025-2035)

  • Tortilla mix
  • Pre-cooked tortilla
  • Tostadas
  • Tortilla chips
  • Taco shell
  • Others

Life Sciences By Nature (USD Million, 2025-2035)

  • Organic
  • Conventional

Life Sciences By Source (USD Million, 2025-2035)

  • Corn
  • Wheat

Life Sciences By Category (USD Million, 2025-2035)

  • Standard/regular
  • Gluten-free

Life Sciences By Distribution Channel (USD Million, 2025-2035)

  • B2B
  • B2C

Compare Licence

×
Features License Type
Single User Multiuser License Enterprise User
Price $4,950 $5,950 $7,250
Maximum User Access Limit 1 User Upto 10 Users Unrestricted Access Throughout the Organization
Free Customization
Direct Access to Analyst
Deliverable Format
Platform Access
Discount on Next Purchase 10% 15% 15%
Printable Versions